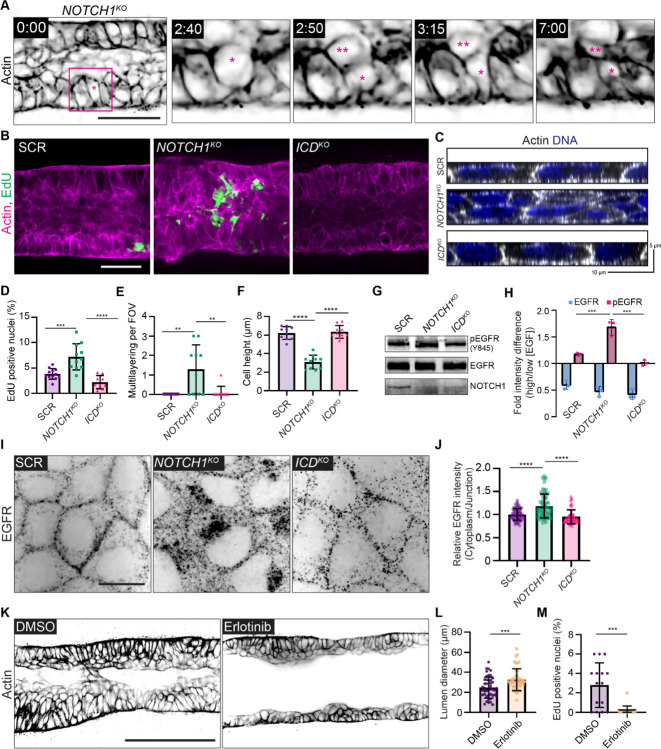
Figure 2. Notch1 cortical signaling regulates epithelial cell architecture and suppresses EGFR mitogenic signaling.
(A) Individual time frames from a live cell movie of actin within a NOTCH1KO duct labeled with SPY650-FastAct (black). Inset for individual time frames outlined in magenta in the 0:00-hour frame. Parent cell is labeled with (*) and daughter cell is labeled with (**). Scale bar, 50 μm. (B) Maximum projection micrographs of 30 μm medial stacks of SCR, NOTCH1KO, and ICDKO epithelial ducts labeled with phalloidin (magenta) and EdU (green). Scale bar, 30 μm. (C) YZ orthogonal projections from fluorescence micrographs of SCR, NOTCH1KO, and ICDKO monolayers labeled with phalloidin (grey) and Hoechst (blue). (D) Quantification of the percentage of EdU positive nuclei in ducts. n ≥ 9 ducts from three independent experiments. (E) Quantification of regions of cell multilayering per field of view in fluorescence micrographs of SCR, NOTCH1KO, and ICDKO monolayers. n ≥ 10 fields of view from three independent experiments. (F) Quantification of cell height from SCR, NOTCH1KO, and ICDKO monolayers plated on hydrogels. n ≥ 10 fields of view from three independent experiments. (G) Western blot of lysates from confluent SCR, NOTCH1KO, and ICDKO monolayers immunoblotted for pEGFR (Y845), EGFR, and Notch1. (H) Quantification of western blot intensity difference of pEGFR and total EGFR levels in monolayers stimulated with EGF. n = 3 independent experiments. (I) Fluorescence micrographs of SCR, NOTCH1KO, and ICDKO monolayers immunostained for EGFR (black). Scale bar, 10 μm. (J) Quantification of relative cytoplasmic to junctional EGFR intensity. n ≥ 30 cells from three independent experiments. (K) Representative medial confocal slice micrographs of NOTCH1KO ducts treated with DMSO or 1 μM Erlotinib labeled with phalloidin (black). Scale bar, 100 μm. (L) Quantification of duct lumen diameter. n ≥ 15 average diameters from three independent experiments. (M) Quantification of the percentage of EdU positive nuclei in NOTCH1KO monolayers treated with DMSO or 1 μM Erlotinib. n ≥ 15 fields of view from three independent experiments. For plots D–F, H, and J, mean ± SEM; one-way ANOVA with Tukey’s post-hoc test, **p<0.01, ***p<0.001, ****p<0.0001. For plots L and M, mean ± SEM; two-tailed unpaired t test, ***p<0.001.

