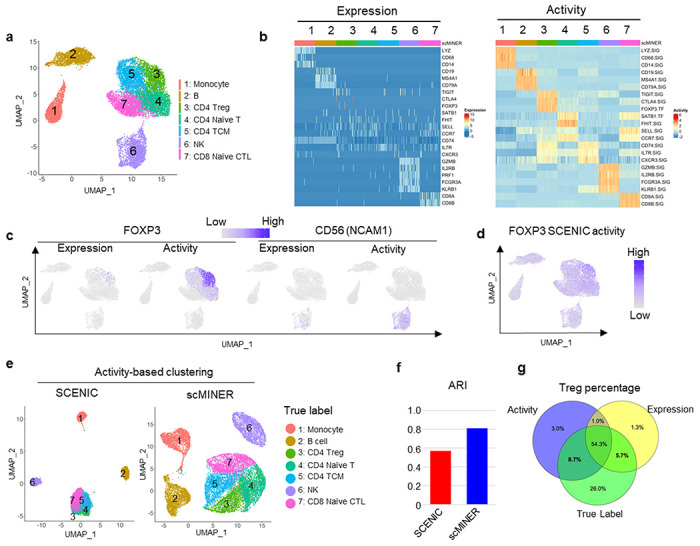
Figure 4: Comparison of scMINER and SCENIC on activity-based mark identification and clustering of PBMC cell types.

a, Unsupervised scMINER clustering of 7 clusters of sorted PBMC cell types on UMAP. b, Heatmap visualization of cell marker expression (left) and predicted activity (right) in each cell from sorted PBMC cell types. The regulatory networks are generated in cell-type specific manner. c, FOXP3 (left) and CD56 (encoded by NCAM1, right) expression and scMINER activity on UMAP. d, UMAP visualization of FOXP3 activity predicted by SCENIC pipeline. e, Unsupervised clustering of the 7 sorted PBMC cell types based on SCENIC and scMINER activity. The true labels of these 7 cell types are labeled. f, The Adjusted Rand Index (ARI) of clustering in e based on SCENIC and scMINER activity.
