

Abstract
Cell surface proteins (CSPs) are vital molecular mediators for cells and their extracellular environment. Thus, understanding which CSPs are displayed on cells, especially in different cell states, remains an important endeavor in cell biology. Here, we describe the integration of cell surface engineering with radical-mediated protein biotinylation to profile CSPs. This method relies on the pre-functionalization of cells with cholesterol lipid groups, followed by the sortase-catalyzed conjugation with an APEX2 ascorbate peroxidase enzyme. In the presence of biotin-phenol and H2O2, APEX2 catalyzes the formation of highly reactive biotinyl radicals that covalently tag electron-rich residues within CSPs for subsequent streptavidin-based enrichment and analysis by quantitative mass spectrometry. While APEX2 is traditionally used to capture proximity-based interactomes, we envisioned using it in a ‘baitless’ manner on cell surfaces to capture CSPs. We evaluate this strategy in light of another CSP labeling method that relies on the presence of cell surface sialic acid. Using the APEX2 strategy, we describe the CSPs found in three mammalian cell lines, and compare CSPs in adherent versus three-dimensional pancreatic adenocarcinoma cells.
Introduction
The collection of proteins and biomolecules at the cell surface, referred to as the surfaceome, plays important roles in cell biology. The composition of the surfaceome can be highly variable, changing wildly between different cell types and cell states1–3. Within the surfaceome are cell surface proteins (CSPs), which can serve as functional receptors for pathogens, cytokines, and other biomolecules, rendering them valuable molecular targets for drug discovery. Indeed, 66% of the approved drug candidates identified in the DrugBank database are annotated as CSPs.4 Thus, the identification of uniquely expressed CSPs in different cell states, especially disease states, can serve as critical starting points to maximize target selectivity in drug discovery5–7.
Due to the crucial role of CSPs in cell biology and their potential as therapeutic targets, strategies to profile them continue to be developed and optimized. However, the unique features of CSPs can often complicate straightforward analysis using mass spectrometry (MS)-based proteomics. CSPs can be hydrophobic due to the presence of transmembrane domains8, their expression levels can be highly variable9, 10, and the relatively high levels of intracellular proteins can overwhelm the direct identification of CSPs from whole cell lysates11. While (~90%12) of CSPs are glycosylated, there are also non-glycosylated members, which are seldom described. Furthermore, the annotation of protein sub-cellular localization is not always straightforward, as some proteins are known to localize differently depending on cell states, post translational modifications, or cell type4, 13, 14.
To overcome these complications, methods to enrich and improve the empirical detection of CSPs away from intracellular proteins have been and continue to be developed. Ultracentrifugation, which separates molecules based on differing sedimentation rates, has often been used to differentiate membrane versus soluble proteins. While useful as a first-pass experiment, this method detects significant amounts of non-membrane proteins15 and it cannot discriminate between membrane proteins found at the cell surface versus those embedded in intracellular organelles (e.g. mitochondrial, nuclear)11. Alternative methods to label CSPs rely on the chemical functionalization of cell surface reactive groups (e.g. lysine residues, sialic acid or galactose glycans) with biotin moieties, such that they can be enriched using streptavidin16–18. In the case of the sialic acid-based method (SiA), cell surface sialic acid diols are oxidized to generate a reactive ketone group, which can then be reacted with amino-oxy biotin.16
To complement these approaches and to potentially shed light on the less studied non-glycosylated counterparts of the cell surface proteome, we envisioned a ‘baitless’ radical-mediated tagging of CSPs, enabled by integration of an engineered ascorbate peroxidase enzyme19, 20 APEX2 and a universal cell surface engineering technique (Fig. 1A). This strategy relies on a chimeric molecule composed of cholesterol conjugated to a sortase A recognition peptide (GGGYC). Upon incubation with cells, this conjugate spontaneously incorporates into cell membranes,21 and subsequent introduction of APEX2 modified with a cognate sortase A recognition peptide (LPETG) results in the covalent modification of cholesterol via an engineered sortase enzyme21–23 (eSrtA) and the de novo display of APEX2 at the cell surface. In the presence of biotin-phenol and H2O2, APEX2 catalyzes the formation of short-lived biotinyl radicals that react with electron-rich residues in CSPs. The biotin-tagged CSPs can then be enriched over the rest of the proteome using streptavidin-based solid supports and identified by quantitative MS. We hypothesized that this baitless APEX2 radical-mediated strategy could permit significant tagging of CSPs due to the abundance of multiple electron-rich amino acids at the cell surface, beyond the presence of reactive lysine residues or certain glycans16, 17. Owing to prior reports of the relative membrane impermeability of the biotin-phenol substrate, we additionally postulated that this strategy could offer selective cell surface labeling with some optimization24.
Figure 1. Overview of APEX2-based profiling of cell surface proteins (CSPs).

(A) Cartoon representation for the experimental workflow. GGGYC-PEG2000-cholesterol (abbreviated as GGGYC-cholesterol) is introduced to live cells (1 hr, 37°C) and incorporates into cell membranes. APEX2-LPETG is introduced to the pre-modified cells and is covalently linked to the membrane-incorporated cholesterol by an engineered sortase A enzyme (eSrtA; 1 hr, 37°C). Upon addition of biotin-phenol (BP; 30 min, 37 °C) and H2O2 (1 min, RT), APEX2 catalyzes the formation of reactive biotinyl radicals, which covalently label CSPs. (B) Confocal microscopy imaging of adherent HPAF-II cells labeled by the APEX2 method following staining by a streptavidin-CY5 fluorophore. Biotin labeling (red) was dependent on the presence of APEX2-LPETG, GGGYC-cholesterol, and eSrtA. (C) Western blotting to probe for biotinylated proteins (left) in whole cell lysates following live cell labeling of HPAF-II cells with SiA or APEX2 methods. Endogenously biotinylated proteins are marked with arrowheads, and are presumed to be pyruvate carboxylase (129 kDa), propionyl-CoA carboxylase (80 kDa), and methylcrotonoyl-CoA carboxylase (79 kDa). The conditions selected for subsequent comparison of both methods are indicated by dashed boxes. The corresponding gel image (right) indicates equivalent loading of protein lysates.
Here, we evaluate this integrated cell surface engineering and radical-mediated tagging as a strategy to profile CSPs across three different cell lines, as well as to profile cells in adherent two-dimensional (2D) versus three-dimensional (3D) states. We compare this strategy with the SiA method, because of a prior report identifying it as the most effective at selective CSP biotinylation11. We also optimize cell surface selectivity by varying biotin-phenol incubation times. Overall, we observe that the APEX2 and SiA methods permit identification of unique subsets of proteins, placing the proposed strategy as a viable alternative to the existing arsenal of strategies to profile CSPs.
RESULTS AND DISCUSSION
We first prepared a recombinant APEX2 protein terminated by an LPETG peptide (Fig. S1) in E. coli and a GGGYC-PEG2000-cholesterol lipid conjugate by chemical synthesis (Fig. S2). Encouraged by the formation of the intended APEX2-cholesterol adduct upon eSrtA-catalyzed conjugation in vitro (Fig. S3), we evaluated the conjugation in live adherent human pancreatic adenocarcinoma HPAF-II cells as a model system for optimization. Upon incubation of live HPAF-II cells with GGGYC-PEG2000-cholesterol (1 hr, 37°C), followed by incubation with increasing concentrations of APEX2-LPETG and eSrtA (1 hr, 37°C), we initiated the APEX2-mediated biotinylation reaction at the cell surface by the addition of biotin-phenol (30 min, 37°C) and H2O2 (1 min, 25°C). We then qualitatively probed for the presence of biotinylated proteins using a streptavidin (SA)-conjugated fluorophore. Using confocal microscopy, we observed dose-dependent fluorescence signals around the cell surface (Fig. 1B, Fig. S4). Limited fluorescence was observed in the absence of the APEX2-LPETG protein, the GGGYC-PEG2000-cholesterol conjugate, or the eSrtA enzyme. These observations indicate a requirement for the presence of APEX2-LPETG, as well as its ability to be anchored onto the cell surface, for robust cell surface tagging, and they also imply that the incorporation of the GGGYC-PEG2000-cholesterol motif resulted in the exposure of the GGGYC motif at the cell surface, permitting its subsequent functionalization by eSrtA. The covalent nature of the APEX2-cholesterol linkage, permitted by eSrtA, was observed to be necessary for potent proximity tagging, as non-covalent complexation via the hexa-histidine tag on APEX2-LPETG and a nitriloacetic acid (NTA) derivative of cholesterol failed to generate significant signals for baitless proximity tagging (Fig. S5), presumably due to the reduced tethering of APEX2 at the cell surface. By Western blotting, we qualitatively noted that the efficiency of biotin-mediated tagging was significantly enhanced upon treatment with PNGaseF, which cleaves N-linked glycans, suggesting that the large abundance of N-linked glycans may occlude electron-rich residues (Fig. S6; Fig. S7).
Both APEX2 (Fig. 2B) and SiA methods (Fig. S8A) generated biotin signals around the periphery of cells (Fig. S8B). Given the non-catalytic nature of the SiA strategy compared to the APEX2 method, we titrated the reagents within each protocol to determine appropriate conditions for comparison. Using western blotting to probe for the presence of biotinylated proteins, we observed that both protocols resulted in dose-dependent increases in total biotinylated signals (Fig. 1C; Fig. S8C) and we then used conditions resulting in approximately similar biotinylation signals for comparison. We also observed that the SiA-based method seemed to preferentially label larger (and presumably, glycosylated) proteins, whereas the APEX2-based strategy generated stronger signals for smaller (and presumably, non-sialylated non-glycosylated) proteins.
Figure 2 – Optimization of APEX2 labeling.
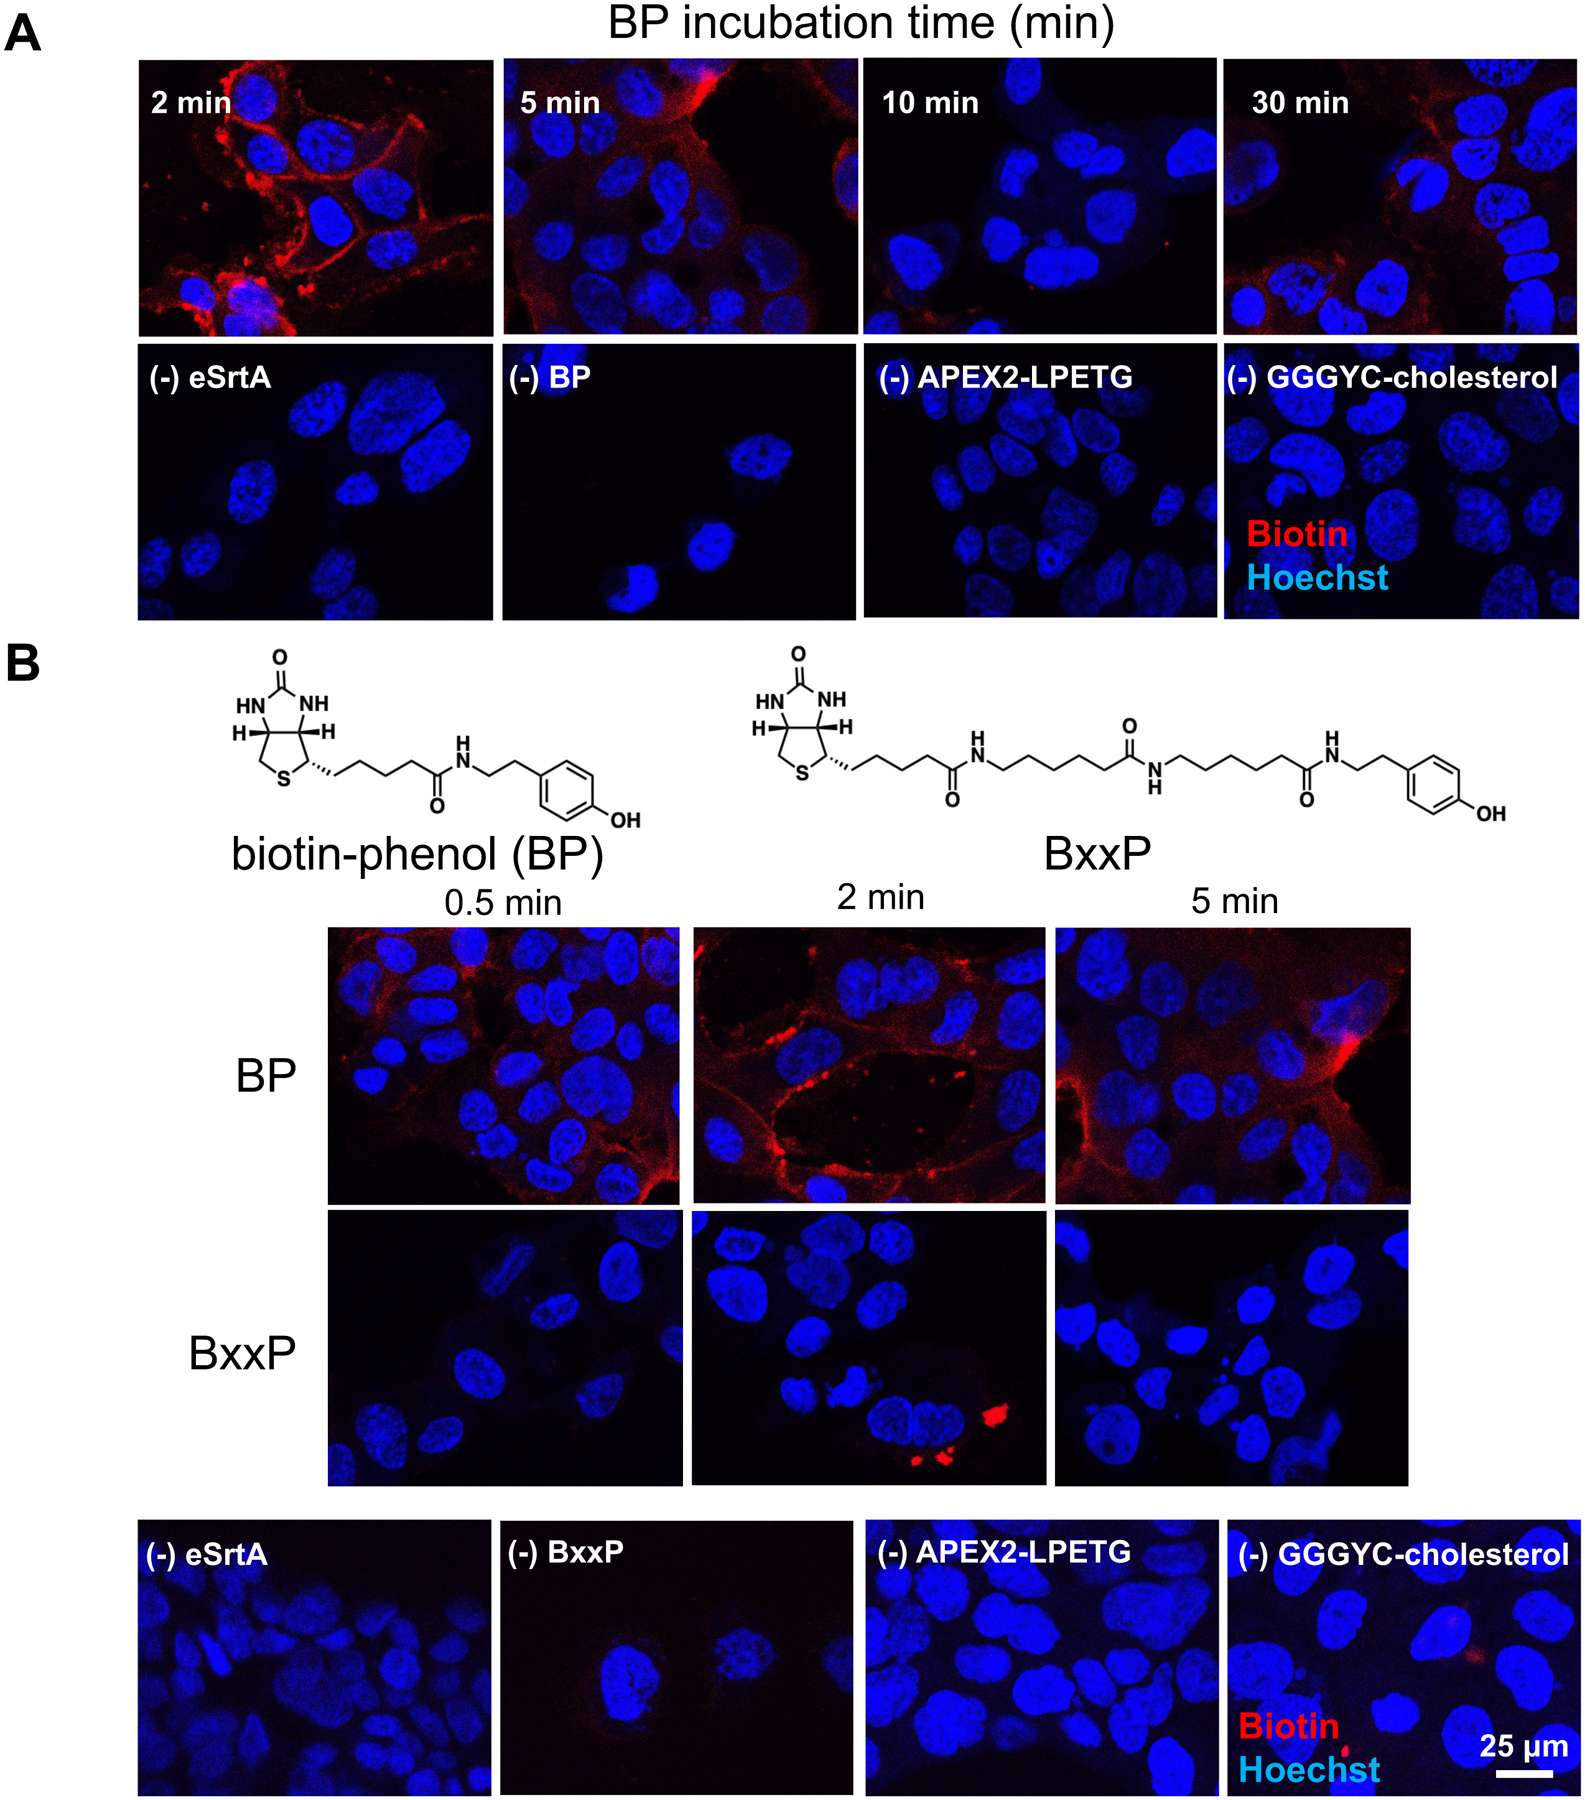
(A) Confocal microscopy images of APEX2-LPETG labeled adherent HPAF-II cells with variable biotin-phenol incubation times, following staining with SA-CY5 (red). Reducing the biotin-phenol incubation time (<30 mins) results in increased biotinylation (red) with BP. (B) With shorter incubation times, BP generates significantly greater biotin signals (red) over BxxP.
Our initial proteomics data based on these experimental conditions yielded significant contamination from intracellular protein components. Thus, we opted to perform further optimizations to enhance selective CSP labeling. Because of new reports describing the relative cellular permeability of biotin-phenol25, we hypothesized that reducing the incubation periods for biotin-phenol while increasing those for H2O2 incubation could mitigate intracellular labeling while retaining robust biotinylation signals. Consistent with previous observations26, we observed improved selectivity in CSP biotinylation signals by reducing biotin-phenol incubation times (≤ 30 min; Fig. 2A) and increasing H2O2 incubation times to two minutes (Fig. S9) in live HPAF-II cells.
We also compared our optimized tagging conditions to APEX2-based tagging using BxxP26, a biotin-phenol derivative that has been found to promote cell surface labeling, due to its increased polarity (Fig. 2B). In these short incubation periods (0.5 – 2 mins), we found that BP remained active, whereas BxxP exhibited limited biotin tagging (Fig. S10 – S12). To maximize workflow efficiency, we thus performed all subsequent APEX2 experiments with reduced biotin-phenol (2 mins) and increased H2O2 incubation periods (2 mins), relative to our original protocol.
Armed with optimized conditions for APEX2-based tagging of CSPs with BP, we proceeded towards MS-based profiling of HPAF-IIs and two additional cell lines, C2C12 mouse myoblasts and JEG-3 human choriocarcinoma cells. Following live cell tagging, cells were lysed, harvested, enriched using a SA-based solid support, and tryptic peptides were labeled with tandem mass tags (TMT) for quantitative MS-based proteomics.27 We performed APEX2- and SiA-based labeling in triplicate, with appropriate negative controls in duplicate within a single 10-plex TMT experiment. For each cell type, we identified the proteins with ≥ 2 unique peptides across three replicates (Fig. S13) that were significantly (p ≤ 0.5) and highly enriched over the appropriate negative control (TMT ratio ≥ 3), as well as the proteins preferentially enriched by either method.
We observed hundreds of proteins identified by APEX2 (Fig. 3A) and SiA methods (Fig. 3B), with both methods identifying similar amounts of proteins. The catalytic nature of the biotin tagging reaction in the APEX2 method resulted in larger enrichment ratios (vs) compared to the SiA method (Fig 3C). Across the three cell lines, the APEX2 method enriched 279–451 proteins (average 365), whereas the SiA method enriched 331–363 proteins (average 347). Among these enriched proteins, an average of 57% and 62% are annotated as CSPs across three lines by the APEX2 and SiA methods, respectively (Fig. 3D). Bioinformatic analysis of the HPAF-II dataset (Table S1) reveals a statistically significant enrichment of proteins associated with Gene Ontology terms such as membrane, intrinsic component of membrane, and other relevant terms (Fig. S14). An average of 41% (APEX2) and 44% (SiA) of enriched proteins across three cell lines are annotated as N-linked glycoproteins. Based on these parameters, APEX2 appears to perform on par to SiA.
Figure 3 – MS-based identification of 2D adherent cell surface proteins (CSPs) in HPAF-II, C2C12, and JEG-3 cells.

(A) Volcano plots of protein enrichment resulting from APEX2 labeling of adherent cells across three replicates over no APEX2-LPETG controls. Vertical dashed lines indicated 3-fold enrichment over the negative controls, whereas horizontal lines indicate a p-value of 0.05. (B) Volcano plots of protein enrichment resulting from SiA-based labeling over no NaIO4 controls across three replicates. Vertical dashed lines indicated 3-fold enrichment over the negative controls, while horizontal lines indicate a p-value of 0.05. (C) Volcano plots of the relative enrichment between APEX2 vs SiA methods. Vertical dashed lines indicate no differential enrichment between the two methods, whereas proteins identified to the left of the line indicate preferential enrichment by SiA, and proteins to the right are preferentially enriched by APEX2. Horizontal dashed lines indicate a p-value of 0.05. (D) A summarized table of results from quantitative MS-based proteomics. U.P ≥ 2 indicates the proteins identified by Proteome Discoverer with two or more unique peptides. Assignment of proteins as a CSP is elaborated in the methods section. Glycosylated specifically refers to proteins annotated as N-linked glycoproteins by UniProt.
Overall, the APEX2-based strategy generated higher levels of enrichment across the three cell lines, presumably due to its catalytic nature and the ability to biotinylate an individual protein at many sites, unlike the SiA-based method which is limited by the number of sialic acids present on the glycoprotein. Nevertheless, many common CSPs are found enriched by both APEX2 and SiA. Within adherent HPAF-II cells (Table S1), both APEX2 and SiA detected CDH2 (cadherin-2, N-cadherin), an N-linked cell surface glycoprotein commonly found on the surfaces of pancreatic cancer cells28. Consistent with the epithelial and polarized nature of these cells, we identified CSPs that belong to the apical (CRB3, PARD3, SLCs) and basolateral (SCRIB, ATPases) domains, as well as tight junction proteins (e.g. MYADM). Within the C2C12 cells (Table S2), both methods identified several components of the extracellular matrix (ITGA4, ITGAV, COL18A1, COL1A1) as well as adhesion-associated proteins (CADM4, CDH2, CDH1, NCAM1). Similarly, a number of adhesion-associated proteins (CDH5, CD47, DAG1) and extracellular matrix components (ITGA5, ITGB5, ITGA3, FBLN2) were identified within the JEG-3 cell line (Table S3).
Some known CSPs were exclusively or preferentially enriched by APEX2 or SiA (Fig. 3C). Occludin (OCLN), a non-glycosylated tight junction protein, was only enriched by APEX2 and not SiA in HPAF-II cells, presumably because of its non-glycosylated nature. We confirmed that OCLN can be present at the cell surface by confocal microscopy (Fig. S15), consistent with prior observations regarding its sub-cellular localization29, 30. Similarly, the non-glycosylated extracellular matrix protein nephronectin (NPTN) and adhesion protein talin 1(TLN1) were exclusively enriched by APEX2 in C2C12 cells. Myeloid associated differentiation marker (MYADM) was preferentially identified by the APEX2 technique in both C2C12 and JEG-3 cells, consistent with its non-glycosylated nature. Glypican-4, a N-linked protein glycoconjugate modified with glycosaminoglycan chains, was preferentially enriched by the APEX2 in HPAF-II cells, presumably because it may not be appropriately modified with sialic acids (in another context, glypican-4 was identified successfully by the SiA-based technique31). Many solute carrier (SLC) proteins, including SLC39A14, SLC19A1, SLC44A2, were preferentially enriched by SiA across the three cell lines. Although the glycosylation states of SLCs have yet to be fully defined, these observations are consistent with the multiple canonical N-linked glycosylation sequons present in SLCs, as well as previous experiments pointing to their highly glycosylated and potentially sialic acid-regulated nature32,33, 34. Additionally, the glycoprotein basigin (BSG) is consistently preferentially enriched by the SiA method, consistent with previous literature indicating the presence of terminally sialylated glycans35.
To observe how CSP expression changes in different cell states, we generated 3D spheroids from HPAF-II cells for comparison to the live adherent 2D cells (Fig. S16). The 3D spheroid model, which results in sphere-like clusters of cells with non-uniform access to nutrients and oxygen, more closely resembles cells responsible for metastasis, especially in pancreatic cancers, and has been proposed as a model of the epithelial to mesenchymal transition28, 36 (EMT). We hypothesized that the surfaceome, broadly responsible for cell-cell interaction, including adherence, infiltration, and signaling, would undergo broad remodeling when cultured in a 3D state rather than as a 2D monolayer28, 36.We performed CSP labeling with the HPAF-II 3D spheroids using both APEX2 and SiA techniques before enriching and identifying labeled proteins by MS-based proteomics (Fig. 4A, Fig. 4B; Table S4). A larger number of proteins were identified and enriched in the 3D spheroids by both the APEX2 and SiA method compared to the 2D adherent cells (Fig. 4C), with APEX2 and SiA exclusively enriching 26 and 9 unique CSPs respectively.
Figure 4 – APEX2 profiling of HPAF-II cells in 3D spheroids.

(A)Labeling of HPAF-II 3D spheroids with either APEX2- (left) or SiA-based (middle) methods over appropriate negative controls,. Vertical dashed lines indicate 3-fold enrichment over the negative controls, whereas horizontal lines indicate a p-value of 0.05. Relative enrichment of APEX2 over SiA (right) indicates differential enrichment of many proteins between the two methods. Vertical dashed lines indicate no differential enrichment between the two methods, while proteins identified to the left of the line indicate preferential enrichment by SiA, and proteins to the right are preferentially enriched by APEX2. Horizontal dashed lines indicate a p-value of 0.05. (B) A summary of statistics describing the quantitative proteomics comparison of APEX2 and SiA methods in HPAF-II spheroids. (C) Pi charts describing the overlap between proteins identified as significantly enriched in 2D adherent cultures and 3D spheroid cultures via APEX2 methods (left) and SiA methods (right).
Some proteins were exclusively enriched only in the 2D or 3D state, or only by APEX2 or SiA. Both APEX2 and SiA identified several extracellular matrix proteins (ITGAV, ITGA3, DAG1, LAMC1; Fig. 4A, Fig. 4B). Both techniques identified E-cadherin only in the 2D adherent state, consistent with its downregulation as being a hallmark of EMT28, 37. Additionally, both methods enriched proteins localized to the collagen containing extracellular matrix (SDC2, AGRN, LG3BP), which are heavily involved in regulating cell-cell adhesion only in the 3D spheroids. Only APEX2 identified the non-glycosylated tight junction protein OCLN in the 3D spheroids, and the non-glycosylated extracellular matrix proteins ANXA5 and ANXA6. In contrast, only SiA identified the glycosylated cell surface antigen CD47.
Given that APEX2-based constructs have been used to generate localized contrast to image intracellular compartments for electron microscopy (EM)38, we also explored whether our strategy could be used to image cell surfaces. Upon application of the APEX2 protocol on adherent HPAF-II cells, fixation, and optimization of staining with diamino-benzidine (DAB, Fig. S17), samples were processed and sectioned for imaging by transmission electron microscopy (TEM). The TEM images (Fig. 5) exhibit strong and specific accumulations of electron dense materials outside of the cell membrane that are dependent on the presence of the APEX2-LPETG. High magnification images identified basal microvilli characteristic of PDAC strains39, a unique pathological feature of these cancers. Cytoskeletal elements, such as bundles of microtubules are also faintly visible, as well as mitochondrion, although neither are stained by APEX2. Quantification of the optical density of the imaged filopodia (Fig. S18) indicates the generation of strong signal at the cell surface over the negative control.
Figure 5 – Viewing the surfaceome with APEX2 tagging and transmission electron microscopy (TEM).

Micrographs of adherent HPAF-II cells at increasing magnification (top to bottom) following APEX2 tagging. Electron density at the cell surface was generated by incorporation of GGGYC-PEG2000-cholesterol lipid and conjugation of APEX2-LPETG at the cell surface, followed by diamino-benzidine treatment in the presence of H2O2. Cells were counterstained with OsO4 and sectioned prior to imaging. A significantly darker deposition was present at the cell surface (indicated by arrows) compared to the non-treated negative control (left). Microvillus (Mv) and mitochondrion (Mt) characteristic of pancreatic ductal adenocarcinoma cell lines were observed in both conditions, while N indicates the nucleus.
Overall, we have shown that cell surface engineering with APEX2 enables CSP profiling across several cell types. While other peroxidases might offer enhanced catalytic activity (HRP40) APEX2 is active in both cell surface41 and intracellular compartments42. The biotinyl radical generated by APEX2 and BP reacts with electron-rich amino acid residues (e.g. tyrosine, histidine, tryptophan, cysteine43) rather than targeting terminal sialic acid modifications like the SiA method44, 45. Thus, the APEX2-based method may be even more suitable for cells that have altered sialic acid compositions46–48.
It is worth noting that the classification of proteins as glycosylated and cell surface relies heavily on gene annotation and predictive software. These databases often rely on the presence of transmembrane motifs4, 49, signal peptides, or canonical N-linked glycosylation sites. Whereas predictive classification is valuable, it may fall short in describing the intricacies of protein trafficking that result in intracellular proteins being present at the cell surface. In principle, APEX2 should generally enrich for more non-glycosylated proteins over SiA. However, several parameters limit the comprehensive comparison of the two methods, and thus we observe this advantage only in the adherent JEG-3 cells and in the comparison between 2D vs 3D HPAF-II cells (Table S1–S4). These parameters include the fact that our analysis is limited to the annotation of N-linked (and not O-linked) glycoproteins in UniProt, and not all glycoproteins are modified by terminal sialic acids. Additionally, non-glycosylated proteins may already occur in complex with sialylated glycoproteins, resulting in co-enrichment. Despite these limitations, APEX2 achieved considerable enrichment in both adherent and 3D spheroid cell culture formats, and in each context tested APEX2 preferentially enriched for several proteins, and even identified unique CSPs not identified by SiA. Altogether, this suggests that APEX2 is a valuable alternate system for profiling CSPs to complement existing techniques.
Methods
Extended methods available in the supplementary info
APEX2-LPETG Cell Surface Labeling
Cells were seeded and grown overnight. Cells were incubated with 30 μM GGGYC-cholesterol (1 hr, 37 °C). Cells were washed 3x before co-incubation with 15 μM eSrtA and 15 μM APEX2-LPETG in serum-free medium supplemented with 1.3 mM CaCl2 (1 hr, 37°C). Cells were washed 3x then incubated in 500 μM biotin phenol in serum-free medium supplemented with 1.3 mM CaCl2 before addition of 1 mM H2O2 for two minutes. Cells were washed 3x with 10 mM NaN3, 5 mM Trolox, and 10 mM sodium ascorbate in PBS to quench the reaction.
Confocal Microscopy
HPAF-II cells (0.2 × 10⁶) were seeded in Lab-Tek II glass chamber slides (System 154534) overnight. Labeling was performed and cells were fixed in 4% paraformaldehyde (10 min, RT) before staining SA-Cy5 (Biolegend 405209, 1:500 PBST) or rabbit α-occludin (Invitrogen 40–4700, 1:250) with goat α-rabbit Alexa Fluor 488 secondary (Invitrogen A11008, 1:1000; 18 hr, 4 °C). Cells were washed three times with PBST then incubated with Hoechst (1 μg/mL, 10 min, RT, PBST). Images were collected on a Zeiss LSM 780 confocal microscope with a Plan-Apo 20X objective (NA 0.8). Pixel size was 0.17 μm. Microscope was adjusted to image at 1 airy unit with a Z-step size of 0.98 μm. Images were processed in the free Fiji software.
Proteomics preparation
Post cell surface labeling cells were harvested by centrifugation, resuspended in 400 μL PBS and lysed by sonication. After precipitation overnight in MeOH (−20°C) the pellet was dissolved in Urea (6 M) and 10 μL of 10% (w/v) SDS in PBS. Proteins were reduced(30 mins, 37 °C) with 50 μL 1:1 solution of 20 mM TCEP (PBS) and 600 mM K2CO3 (PBS). Samples were treated (RT, 30 mins) in the dark with iodoacetamide followed by 10% SDS (w/v) prior to incubation with streptavidin agarose beads (RT, 1.5 hr). After washing to remove unbound protein, beads were incubated in sequencing grade trypsin solution(Promega, 20 μg) in 100 mM TEAB supplemented with CaCl2 (overnight, 37 °C). Supernatant was harvested and labelled with tandem mass tags (Thermo Scientific cat# A34808, 1 hr, RT) before quenching with hydroxylamine (15 mins, RT). Samples wereacidified with formic acid, before being dried by vacuum centrifugation. Dry samples were combined, desalted, and dried by vacuum centrifugation and stored at −80 °C until injection.
Proteomics liquid chromatography mass spectrometry (LC/MS) analysis
Tryptic peptide samples were run on a Fusion Tribrid mass spectrometer (Thermo Scientific) with an EASY PepMapTM RSLC C18 column. Precise run gradients and conditions are available in the SI.
SPS-MS3 method for Proteomics
A synchronous precursor selection (SPS)-MS3 mass spectrometry method was used based on Ting et. al.27 Extended methods are available in the SI.
Proteomics analysis
Proteomics data were processed in Proteome Discoverer 2.4 (Thermo Scientific). Parameters are available in the SI. Proteins identified were filtered by at least 2 unique peptides prior to statistical analysis using Prism 9.0 (GraphPad Software Inc.). TMT values obtained from Proteome Discoverer were transformed by log2(x) and p-values were obtained by t-test function across 3 replicates of experimental conditions, and 2 replicates for negative controls. The mass spectrometry proteomics data have been deposited to the ProteomeXchange Consortium via the PRIDE partner repository with the dataset identifier PXD031845.
DAB staining for transmission electron microscopy
HPAF-II cells were seeded overnight at a concentration of 1 × 10⁶ cells/mL into a dish containing coverslips (Thermanox, Electron microscopy Science). Samples were incubated with 30 μM chol-CYGGG in serum-free DMEM (37 °C, 1 hr). Cells were incubated with 15 μM APEX2-LPETG and 15 μM eSrtA (37 °C, 1 hr). After washing, samples were incubated with EM grade 2% (v/v) glutaraldehyde solution (100 mM EM grade sodium cacodylate buffer (CB), pH 7.4) (RT, 5 min) before incubation on ice (1 hr). Cells were washed 3x with CB before incubation in glycine solution (20 mM, 5 min, on ice). Cells were washed 3x with CB before being incubated with a freshly prepared solution of 0.5 mg/mL diamino-benzidine, 10 mM H2O2 (5 – 45 min, on ice) until a light brown stain was visible by brightfield microscopy.
Transmission electron microscopy
Cells on coverslips were treated with 2% OsO4 in CB on ice for 60min and en bloc stained with 1% aqueous uranyl acetate for 25 minutes. Samples were dehydrated with an ascending ethanol series, followed by acetone and overnight infiltration of Durcupan resin (Sigma). Samples were then flat embedded and polymerized at 60°C for 48 hours. Ultrathin sections (65 nm) were cut (UC7; Leica), and no counter staining was added to evaluate the DAB stained materials. Sections were examined in a Tecnai G2 Spirit BioTwin transmission electron microscope (Thermo Fisher Scientific) at 100 kV acceleration voltage. Three different magnification Images (at × 8,200, × 26,500 and × 87,000) were taken with a Veleta CCD camera (Olympus) operated by TIA software (Thermo Fisher Scientific).
Supplementary Material
Acknowledgements
We are grateful to Appaso Jadhav for assistance with the synthesis of the BxxP molecule, as well as the Scripps Research Florida Proteomics (G. Tsaprailis) and Bioinformatics (P. Natarajan and G. Crynen) Core Facilities for their assistance with data analysis. We are grateful for the assistance of the Scripps Research California Microscopy Core Facilities (K. Spencer and S. Henderson) with confocal imaging. This work was supported by the NIGMS (R35GM142464). Z.V. is supported by a fellowship provided by the Joe W. and Dorothy Dorsett Brown Foundation. A.E.R. is supported by a Skaggs Graduate Fellowship enabled by the Schimmel Family Foundation. E.J. is supported by a Skaggs Graduate Fellowship, enabled by the Henry and Jennifer Luttrell Foundation.
Footnotes
Supporting Information Available: Experimental data describing preparation of necessary reagents, preliminary data, and additional optimization are available. Additionally, complete record of all significantly enriched proteins identified within each proteomic run are included with annotation. This material is available free of charge via the Internet.
References
- [1].Haun RS, Quick CM, Siegel ER, Raju I, Mackintosh SG, and Tackett AJ (2015) Bioorthogonal labeling cell-surface proteins expressed in pancreatic cancer cells to identify potential diagnostic/therapeutic biomarkers, Cancer Biol Ther 16, 1557–1565. [DOI] [PMC free article] [PubMed] [Google Scholar]
- [2].Orentas RJ, Yang JJ, Wen X, Wei JS, Mackall CL, and Khan J (2012) Identification of cell surface proteins as potential immunotherapy targets in 12 pediatric cancers, Front Oncol 2, 194. [DOI] [PMC free article] [PubMed] [Google Scholar]
- [3].da Cunha JP, Galante PA, de Souza JE, de Souza RF, Carvalho PM, Ohara DT, Moura RP, Oba-Shinja SM, Marie SK, Silva WA Jr., Perez RO, Stransky B, Pieprzyk M, Moore J, Caballero O, Gama-Rodrigues J, Habr-Gama A, Kuo WP, Simpson AJ, Camargo AA, Old LJ, and de Souza SJ (2009) Bioinformatics construction of the human cell surfaceome, Proc Natl Acad Sci U S A 106, 16752–16757. [DOI] [PMC free article] [PubMed] [Google Scholar]
- [4].Bausch-Fluck D, Goldmann U, Muller S, van Oostrum M, Muller M, Schubert OT, and Wollscheid B (2018) The in silico human surfaceome, Proc Natl Acad Sci U S A 115, E10988–E10997. [DOI] [PMC free article] [PubMed] [Google Scholar]
- [5].Chen W, Mou KY, Solomon P, Aggarwal R, Leung KK, and Wells JA (2021) Large remodeling of the Myc-induced cell surface proteome in B cells and prostate cells creates new opportunities for immunotherapy, Proc Natl Acad Sci U S A 118. [DOI] [PMC free article] [PubMed] [Google Scholar]
- [6].Ferguson ID, Escobar BP, Tuomivaara ST, Lin Y-HT, Nix MA, Leung KK, Hale M, Choudhry P, Lopez-Girona A, Ramos E, Wong SW, Wolf JL, Martin TG, Shah N, Vandenberg S, Prakash S, Besse L, Driessen C, Wells JA, and Wiita AP (2021) Defining the cell surface proteomic landscape of multiple myeloma reveals immunotherapeutic strategies and biomarkers of drug resistance, BioRXIV. [Google Scholar]
- [7].Leung KK, Wilson GM, Kirkemo LL, Riley NM, Coon JJ, and Wells JA (2020) Broad and thematic remodeling of the surfaceome and glycoproteome on isogenic cells transformed with driving proliferative oncogenes, Proc Natl Acad Sci U S A 117, 7764–7775. [DOI] [PMC free article] [PubMed] [Google Scholar]
- [8].Rees DC, DeAntonio L, and Eisenberg D (1989) Hydrophobic Organization of Membrane Proteins, Science 245, 510–513. [DOI] [PubMed] [Google Scholar]
- [9].Wagner S, Baars L, Ytterberg AJ, Klussmeier A, Wagner CS, Nord O, Nygren PA, van Wijk KJ, and de Gier JW (2007) Consequences of membrane protein overexpression in Escherichia coli, Mol Cell Proteomics 6, 1527–1550. [DOI] [PubMed] [Google Scholar]
- [10].Mathieu K, Javed W, Vallet S, Lesterlin C, Candusso MP, Ding F, Xu XN, Ebel C, Jault JM, and Orelle C (2019) Functionality of membrane proteins overexpressed and purified from E. coli is highly dependent upon the strain, Sci Rep 9, 2654. [DOI] [PMC free article] [PubMed] [Google Scholar]
- [11].Weekes MP, Antrobus R, Lill JR, Duncan LM, Hör S, and Lehner PJ (2010) Comparative Analysis of Techniques to Purify Plasma Membrane Proteins, Journal of Biomolecular Techniques, 108–115. [PMC free article] [PubMed] [Google Scholar]
- [12].Apweiler R, Hermjakob H, and Sharon N (1999) On the frequency of protein glycosylation, as deduced from analysis of the SWISS-PROT database, Biochemica et Biophysica Acta, 4–8. [DOI] [PubMed] [Google Scholar]
- [13].Moharir A, Peck SH, Budden T, and Lee SY (2013) The role of N-glycosylation in folding, trafficking, and functionality of lysosomal protein CLN5, PLoS One 8, e74299. [DOI] [PMC free article] [PubMed] [Google Scholar]
- [14].Acconcia F, Barnes CJ, Singh RR, Talukder AH, and Kumar R (2007) Phosphorylation-dependent regulation of nuclear localization and functions of integrin-linked kinase, Proc Natl Acad Sci U S A 104, 6782–6787. [DOI] [PMC free article] [PubMed] [Google Scholar]
- [15].Zhou Y, Gao J, Zhu H, Xu J, He H, Gu L, Wang H, Chen J, Ma D, Zhou H, and Zheng J (2018) Enhancing Membrane Protein Identification Using a Simplified Centrifugation and Detergent-Based Membrane Extraction Approach, Anal Chem 90, 2434–2439. [DOI] [PubMed] [Google Scholar]
- [16].Zeng Y, Ramya TN, Dirksen A, Dawson PE, and Paulson JC (2009) High-efficiency labeling of sialylated glycoproteins on living cells, Nat Methods 6, 207–209. [DOI] [PMC free article] [PubMed] [Google Scholar]
- [17].Ramya TN, Weerapana E, Cravatt BF, and Paulson JC (2013) Glycoproteomics enabled by tagging sialic acid- or galactose-terminated glycans, Glycobiology 23, 211–221. [DOI] [PMC free article] [PubMed] [Google Scholar]
- [18].Wojdyla K, Collier AJ, Fabian C, Nisi PS, Biggins L, Oxley D, and Rugg-Gunn PJ (2020) Cell-Surface Proteomics Identifies Differences in Signaling and Adhesion Protein Expression between Naive and Primed Human Pluripotent Stem Cells, Stem Cell Reports 14, 972–988. [DOI] [PMC free article] [PubMed] [Google Scholar]
- [19].Lam SS, D. MJ, Kamer KJ, Deerinck TJ, Ellisman MH, Mootha VK, and Ting AY (2015) Directed evolution of APEX2 for electron microscopy and proximity labeling, Nature Methods, 51–54. [DOI] [PMC free article] [PubMed] [Google Scholar]
- [20].Hung V, Udeshi ND, Lam SS, Loh KH, Cox KJ, Pedram K, Carr SA, and Ting AY (2016) Spatially resolved proteomic mapping in living cells with the engineered peroxidase APEX2, Nat Protoc 11, 456–475. [DOI] [PMC free article] [PubMed] [Google Scholar]
- [21].Tomita U, Yamaguchi S, Maeda Y, Chujo K, Minamihata K, and Nagamune T (2013) Protein cell-surface display through in situ enzymatic modification of proteins with a poly(Ethylene glycol)-lipid, Biotechnol Bioeng 110, 2785–2789. [DOI] [PubMed] [Google Scholar]
- [22].Dorr BM, Ham HO, An C, Chaikof EL, and Liu DR (2014) Reprogramming the specificity of sortase enzymes, Proc Natl Acad Sci U S A 111, 13343–13348. [DOI] [PMC free article] [PubMed] [Google Scholar]
- [23].Mazmanian SK, Ton-That H, and Schneewind O (2001) Sortase-catalysed anchoring of surface proteins to the cell wall of Staphylococcus aureus, Molecular Microbiology 40, 1049–1057. [DOI] [PubMed] [Google Scholar]
- [24].Tan B, Peng S, Yatim S, Gunaratne J, Hunziker W, and Ludwig A (2020) An Optimized Protocol for Proximity Biotinylation in Confluent Epithelial Cell Cultures Using the Peroxidase APEX2, STAR Protoc 1, 100074. [DOI] [PMC free article] [PubMed] [Google Scholar]
- [25].Hwang J, and Espenshade PJ (2016) Proximity-dependent biotin labelling in yeast using the engineered ascorbate peroxidase APEX2, Biochem J 473, 2463–2469. [DOI] [PMC free article] [PubMed] [Google Scholar]
- [26].Loh KH, Stawski PS, Draycott AS, Udeshi ND, Lehrman EK, Wilton DK, Svinkina T, Deerinck TJ, Ellisman MH, Stevens B, Carr SA, and Ting AY (2016) Proteomic Analysis of Unbounded Cellular Compartments: Synaptic Clefts, Cell 166, 1295–1307 e1221. [DOI] [PMC free article] [PubMed] [Google Scholar]
- [27].Ting L, Rad R, Gygi SP, and Haas W (2011) MS3 eliminates ratio distortion in isobaric multiplexed quantitative proteomics, Nat Methods 8, 937–940. [DOI] [PMC free article] [PubMed] [Google Scholar]
- [28].Gagliano N, Celesti G, Tacchini L, Pluchino S, Sforza C, Rasile M, Valerio V, Laghi L, Conte V, and Procacci P (2016) Epithelial-to-mesenchymal transition in pancreatic ductal adenocarcinoma: Characterization in a 3D-cell culture model, World J Gastroenterol 22, 4466–4483. [DOI] [PMC free article] [PubMed] [Google Scholar]
- [29].Elias BC, Suzuki T, Seth A, Giorgianni F, Kale G, Shen L, Turner JR, Naren A, Desiderio DM, and Rao R (2009) Phosphorylation of Tyr-398 and Tyr-402 in occludin prevents its interaction with ZO-1 and destabilizes its assembly at the tight junctions, J Biol Chem 284, 1559–1569. [DOI] [PMC free article] [PubMed] [Google Scholar]
- [30].Suzuki T, Elias BC, Seth A, Shen L, Turner JR, Giorgianni F, Desiderio D, Guntaka R, and Rao R (2009) PKC eta regulates occludin phosphorylation and epithelial tight junction integrity, Proc Natl Acad Sci U S A 106, 61–66. [DOI] [PMC free article] [PubMed] [Google Scholar]
- [31].Konze SA, Cajic S, Oberbeck A, Hennig R, Pich A, Rapp E, and Buettner FFR (2017) Quantitative Assessment of Sialo-Glycoproteins and N-Glycans during Cardiomyogenic Differentiation of Human Induced Pluripotent Stem Cells, Chembiochem 18, 1317–1331. [DOI] [PubMed] [Google Scholar]
- [32].Pedersen NB, Carlsson MC, and Pedersen SF (2016) Glycosylation of solute carriers: mechanisms and functional consequences, Pflugers Arch 468, 159–176. [DOI] [PubMed] [Google Scholar]
- [33].Johnson D, and Bennett ES (2008) Gating of the shaker potassium channel is modulated differentially by N-glycosylation and sialic acids, Pflugers Arch 456, 393–405. [DOI] [PubMed] [Google Scholar]
- [34].Johnson D, Montpetit ML, Stocker PJ, and Bennett ES (2004) The sialic acid component of the beta1 subunit modulates voltage-gated sodium channel function, J Biol Chem 279, 44303–44310. [DOI] [PubMed] [Google Scholar]
- [35].Li Q, Xie Y, Wong M, Barboza M, and Lebrilla CB (2020) Comprehensive structural glycomic characterization of the glycocalyxes of cells and tissues, Nat Protoc 15, 2668–2704. [DOI] [PMC free article] [PubMed] [Google Scholar]
- [36].Gagliano N, Sforza C, Sommariva M, Menon A, Conte V, Sartori P, and Procacci P (2017) 3D-spheroids: What can they tell us about pancreatic ductal adenocarcinoma cell phenotype?, Exp Cell Res 357, 299–309. [DOI] [PubMed] [Google Scholar]
- [37].Thiery JP (2002) Epithelial-mesenchymal transitions in tumour progression, Nat Rev Cancer 2, 442–454. [DOI] [PubMed] [Google Scholar]
- [38].Martell JD, Deerinck TJ, Lam SS, Ellisman MH, and Ting AY (2017) Electron microscopy using the genetically encoded APEX2 tag in cultured mammalian cells, Nat Protoc 12, 1792–1816. [DOI] [PMC free article] [PubMed] [Google Scholar]
- [39].Hexige S, Ardito-Abraham CM, Wu Y, Wei Y, Fang Y, Han X, Li J, Zhou P, Yi Q, Maitra A, Liu JO, Tuveson DA, Lou W, and Yu L (2015) Identification of novel vascular projections with cellular trafficking abilities on the microvasculature of pancreatic ductal adenocarcinoma, J Pathol 236, 142–154. [DOI] [PMC free article] [PubMed] [Google Scholar]
- [40].Rees JS, Li XW, Perrett S, Lilley KS, and Jackson AP (2015) Selective Proteomic Proximity Labeling Assay Using Tyramide (SPPLAT): A Quantitative Method for the Proteomic Analysis of Localized Membrane-Bound Protein Clusters, Curr Protoc Protein Sci 80, 19 27 11–19 27 18. [DOI] [PubMed] [Google Scholar]
- [41].Zhen Y, Haugsten EM, Singh SK, and Wesche J (2018) Proximity Labeling by a Recombinant APEX2-FGF1 Fusion Protein Reveals Interaction of FGF1 with the Proteoglycans CD44 and CSPG4, Biochemistry 57, 3807–3816. [DOI] [PubMed] [Google Scholar]
- [42].Hung V, Zou P, Rhee HW, Udeshi ND, Cracan V, Svinkina T, Carr SA, Mootha VK, and Ting AY (2014) Proteomic mapping of the human mitochondrial intermembrane space in live cells via ratiometric APEX tagging, Mol Cell 55, 332–341. [DOI] [PMC free article] [PubMed] [Google Scholar]
- [43].Davies KJ, Delsignore ME, and Lin SW (1987) Protein damage and degradation by oxygen radicals. II. Modification of amino acids, Journal of Biological Chemistry 262, 9902–9907. [PubMed] [Google Scholar]
- [44].Wollscheid B, Bausch-Fluck D, Henderson C, O’Brien R, Bibel M, Schiess R, Aebersold R, and Watts JD (2009) Mass-spectrometric identification and relative quantification of N-linked cell surface glycoproteins, Nat Biotechnol 27, 378–386. [DOI] [PMC free article] [PubMed] [Google Scholar]
- [45].Gundry RL, Raginski K, Tarasova Y, Tchernyshyov I, Bausch-Fluck D, Elliott ST, Boheler KR, Van Eyk JE, and Wollscheid B (2009) The mouse C2C12 myoblast cell surface N-linked glycoproteome: identification, glycosite occupancy, and membrane orientation, Mol Cell Proteomics 8, 2555–2569. [DOI] [PMC free article] [PubMed] [Google Scholar]
- [46].Teoh ST, Ogrodzinski MP, Ross C, Hunter KW, and Lunt SY (2018) Sialic Acid Metabolism: A Key Player in Breast Cancer Metastasis Revealed by Metabolomics, Front Oncol 8, 174. [DOI] [PMC free article] [PubMed] [Google Scholar]
- [47].Ma X, Dong W, Su Z, Zhao L, Miao Y, Li N, Zhou H, and Jia L (2016) Functional roles of sialylation in breast cancer progression through miR-26a/26b targeting ST8SIA4, Cell Death Dis 7, e2561. [DOI] [PMC free article] [PubMed] [Google Scholar]
- [48].Almaraz RT, Tian Y, Bhattarcharya R, Tan E, Chen SH, Dallas MR, Chen L, Zhang Z, Zhang H, Konstantopoulos K, and Yarema KJ (2012) Metabolic flux increases glycoprotein sialylation: implications for cell adhesion and cancer metastasis, Mol Cell Proteomics 11, M112 017558. [DOI] [PMC free article] [PubMed] [Google Scholar]
- [49].Waas M, Littrell J, and Gundry RL (2020) CIRFESS: An Interactive Resource for Querying the Set of Theoretically Detectable Peptides for Cell Surface and Extracellular Enrichment Proteomic Studies, J Am Soc Mass Spectrom 31, 1389–1397. [DOI] [PMC free article] [PubMed] [Google Scholar]
Associated Data
This section collects any data citations, data availability statements, or supplementary materials included in this article.