

Abstract
We recently reported that the “Dopamine Neuron Challenge Test” (DNC Test), a diagnostic method that measures the levels of dopamine metabolites in cerebrospinal fluid (CSF) and plasma samples after pharmacologically inducing a transient dopamine release, can detect early-stage Parkinson’s disease (PD) with high sensitivity and selectivity in mouse models. The use of haloperidol in the original DNC test to challenge dopamine neurons was less than ideal, as it may cause extrapyramidal motor symptoms. Here we report an improved DNC Test, in which the original challenging agents, haloperidol and methylphenidate, are replaced by a single challenging agent, a dopamine autoreceptor preferring antagonist AJ76 or UH232. We show that the improved DNC Test can achieve the same level of sensitivity and selectivity in detecting early PD in a mouse model without causing motor side effects. These findings significantly improve the practicality of using the DNC Test as a screening or diagnostic test for detecting early-stage PD in the high-risk population in humans.
Keywords: Parkinson’s disease; diagnosis; homovanillic acid (HVA); 3,4-Dihydroxyphenylacetic acid (DOPAC); cerebrospinal fluid (CSF); plasma
1. Introduction
Parkinson’s disease (PD) is a common neurodegenerative disorder featuring an ensemble of motor and non-motor symptoms primarily in people older than 60 years old(Lang and Lozano, 1998a, b). The most pronounced neuropathological feature is the progressive loss of dopamine neurons (DANs) in the substantia nigra pars compacta (SNc)(Lima et al., 2012). Since the loss of DANs is irreversible, an early diagnosis of the disease is critical for an early start of interventions(Chan et al., 2007). However, because the hallmark PD symptoms do not manifest until about 60 to 80 percent of DANs in the SNc have been lost(Cheng et al., 2010; Dauer and Przedborski, 2003; Noyce et al., 2016), diagnosing PD at an early stage before the clinical onset remains challenging.
We recently reported a new diagnostic method called “Dopamine Neuron Challenge Test” (DNC Test), in which we used a single injection of dopamine D2 receptor (D2R) agonist haloperidol and dopamine transporter blocker methylphenidate to induce a transient surge of dopamine release, and subsequently measured the dopamine metabolites 3,4-Dihydroxyphenylacetic acid (DOPAC) and homovanillic acid (HVA) in cerebrospinal fluid (CSF) and plasma samples. We showed that the DNC Test could detect early-stage PD in MitoPark mice(Ekstrand et al., 2007) with less than 30% loss of DANs with 100% sensitivity and selectivity using CSF samples, and 100% sensitivity and 82% selectivity using plasma samples. It could also reveal the hypodopaminergic state at an ultra-early stage when MitoPark mice did not show detectable loss of DANs(Zhou et al., 2021). One reasonable concern with the original DNC Test is the use of haloperidol as a challenging agent. Haloperidol is known to have the risk of causing extrapyramidal symptoms in elderly adults by blocking postsynaptic D2Rs(Sanberg, 1980) (Figure 1). Even though we have shown that when co-administered, methylphenidate partially offsets haloperidol’s inhibitory effect on locomotor activity, the inclusion of haloperidol in the DNC Test may still pose a concern, limiting the test’s use as a diagnostic for early-stage PD in clinical settings.
Figure 1 |. Illustration of the binding targets of haloperidol, AJ76 and UH232.

Blockade of dopamine autoreceptors by D2 receptor antagonist haloperidol and dopamine autoreceptors preferring antagonists AJ76 and UH232 mediates the DNC Test. Blockade of postsynaptic D2 receptors by haloperidol leads to Parkinsonian symptoms.
Haloperidol is a nonselective DR2 antagonist blocking both pre- (autoreceptors) and postsynaptic D2Rs(Garau et al., 1978; Schwarcz et al., 1978). Since its DAN challenging effect is mediated by blocking dopamine autoreceptors, and its motor side effects are mediated by blocking the postsynaptic D2Rs(Sanberg, 1980), we hypothesize that replacing haloperidol with a dopamine autoreceptor preferring antagonist(Sotnikova et al., 2001) should achieve the same DAN challenging effect as haloperidol in the DNC Test without causing motor side effects (Figure 1). In the current study, we explored whether dopamine autoreceptor antagonists AJ76(Johansson et al., 1985; Svensson et al., 1986b) or UH232(Svensson et al., 1986a) could be used as suitable challenging agents in the DNC Test.
2. Materials and Methods
2.1. Animals
All animal protocols were approved by the US National Institute of Environmental Health Sciences Animal Care and Use Committee. Adult male and female C57BL/6J mice were acquired from the Jackson Laboratory. MitoPark mice (DATIREScre/+;Tfamflox/flox) were bred in house by crossing DATIREScre/+ mice(Backman et al., 2006) (006660, Jackson Laboratory) with Tfamflox/flox (026123, Jackson Laboratory). Tfamflox/flox and DATIREScre/+;Tfamflox/+ mice were used as breeders to generate MitoPark mice. Tfamflox/flox, Tfamflox/+ and DATIREScre/+;Tfamflox/+ mice were used as littermate controls.
2.2. Drug preparation
AJ76 and UH232 were obtained from Tocris Bioscience: (+)-AJ 76 hydrochloride (Cat. No.0678), (+)-UH 232 maleate (Cat. No. 0775). AJ76 and UH232 were stored at room temperature and dissolved with saline at 2 mg/ml on the day of experiment. Either AJ76 or UH232 was injected intraperitoneally (i.p.) at 0.1ml/10g body weight one hour before CSF and blood collection.
2.3. Viral vectors
pAAV-CAG-dLight1.1 was a gift from Lin Tian (Addgene plasmid # 111067 ; http://n2t.net/addgene:111067 ; RRID:Addgene_111067)(Patriarchi et al., 2018). pAAV-hSyn1(S)-tdTomato-WPRE was a gift from Hongkui Zeng (Addgene plasmid # 51506 ; http://n2t.net/addgene:51506 ; RRID:Addgene_51506)(Oh et al., 2014). All viral vectors were recovered in house by the NIEHS Viral Vector Core, had titers of 1.3 × 10¹³ to 2 × 10¹⁴ genome copies per ml and were packaged with AAV9 capsid.
2.4. Viral expression of dLight1.1 and tdTomato
Viral vectors were micro-injected into the left and right dorsal striatum by standard stereotaxic procedures with animals under isoflurane anesthesia(Cui et al., 2014). The coordinates used for targeting the dorsal striatum were AP +0.50 mm, ML ±2.30 mm from Bregma; and DV −2.75 mm from the brain surface. A total volume of 1.0 μl of AAV vectors per site was injected at the rate of 0.1 μl per min through a Hamilton Neuros syringe with a 30-gauge needle. The needle was left in place for ten more minutes before withdrawal. The volume ratio of viral vectors in the mixtures for injections was 30:1 for dLight1.1 and tdTomato.
2.5. Optical fiber probe implantation for in vivo fiber photometry recordings in normal C57BL/6J mice
Two weeks after the AAV injection, normal C57BL/6J mice underwent the second stereotaxic surgery to receive fiber probe implantation. Two bur holes were drilled though the skull to target the dorsal striatum bilaterally (AP +0.50 mm, ML ±2.40 mm from Bregma) using a #1/2 (0.027” Diameter) drill bit. Another pair of bur holes for anchoring screws were drilled bilaterally above the parietal lobes. After the anchoring screws were in place, a lab-made optical-fiber probe, fabricated using a multimode fiber (Thorlabs, FG105UCA, NA: 0.22, core diameter: 105 μm, total fiber diameter with cladding: 125 μm, fiber length: flat-cleaved to 2.5 mm after probe assembling and before use) and a ceramic ferrule disassembled from commercial LC connectors (Precision Fiber Products, Inc. SKU: MM-CON2010, ferrule outer diameter: 1.25, bore diameter: 127 μm) was slowly lowered onto the surface of the cortex through the burr hole, then further lowered toward the dorsal striatum at approximately 200 μm per step until the spectra of dLight1.1 and tdTomato were detected by the spectrometer. The probe was then lowered at 50 μm per step until the fluorescence intensity reached a plateau. The final tip location was approximately 1.8-2.2 mm below the brain surface. The probe was then fixed in place with a generous amount of dental acrylic (Jet, Lang Dental Mfg. Co.). The animals were allowed to recover for 2 weeks before experiments proceeded.
2.6. Spectrally resolved fiber photometry
A blue laser (473nm) was used as the light source to excite both dLight1.1 and tdTomato. Emitted photons were collected by a spectrometer as described previously(Meng et al., 2018). The in vivo recordings in awake behaving mice were carried out in an open-top mouse operant chamber (21.6 × 17.8 × 12.7 cm, Med-Associates) housed in a sound attenuating box. Fluorescence spectra were acquired using 19 ms integration time and were triggered by 25 Hz TTL pulses sent from a digital output module (DIG-726TTL, Med-Associates) on a customized mouse operant conditioning package from Med-Associates. Spectral linear unmixing was carried out using a customized program written in R. The customized spectral linear unmixing algorithm script written in R is available at https://www.niehs.nih.gov/research/atniehs/labs/ln/pi/iv/tools/index.cfm. A digital video camera (Grasshopper3 GS3-U3-23S6M-C, FLIR Integrated Imaging Solutions), frame by frame triggered by the same TTL pulses triggering the spectrometer, was used to record the animal’s behavior. The output power of the 473 nm laser measured at the end of patch cable was set at 20 μW. Under these conditions, we found that the dLight1.1 fluorescence showed significant fading during the recordings. To correct for the fluorescence fading, we first applied linear regression to fit the first 10 min of the unmixed coefficients plotted over time, and then used the fitted curve as the theoretical baseline (F0) to calculate ΔF/F0%.
2.7. CSF and plasma sample collections
CSF and blood samples were collected separately from different mice 1 hr after the i.p. injection of AJ76 (20 mg/kg) or UH232 (20 mg/kg).
CSF was collected through cisterna magna puncture(Liu and Duff, 2008). The mice were anesthetized by 5% isoflurane in the induction chamber and then transferred to a stereotaxic frame where the anesthesia was maintained with 1-2% isoflurane. The mice were placed on the stereotaxic frame in the way that the head formed a ~135 ° angle with the body. A sagittal incision was made above the occiput. The subcutaneous tissue and muscles were separated with forceps. A glass capillary (1B150-4, WPI) pulled by a puller (PC-10, NARISHIGE Group) with the tip trimmed with scissors was used to penetrate into the cisterna manga through the dura mater to collect CSF. The collected CSF was injected into an Eppendorf tube with a 0.3 ml insulin syringe (324702, BD Biosciences). After the CSF collection, the muscles were realigned, and the skin was sutured. The mice were either perfused or sacrificed after CSF collection. The CSF samples were either put on ice for immediate HPLC analysis or stored at −80 °C.
Blood was collected through submandibular bleeding(Golde et al., 2005). Mice were anesthetized by 5% isoflurane in the induction chamber. The cheek was shaved, and a 22-gauge needle was used to puncture the submandibular vein. Drops of blood (0.2~0.5 ml) were collected with heparin pre-coated tubes (NC9016222, Fisher Scientific). The penetration point was pressed with cotton swaps to stop the bleeding after the blood collection. The mice were housed on heat pad until ambulatory. Blood samples were centrifuged at 2000 g × 5 min at 4 °C. The clear supernatants (plasma) were placed on ice for immediate HPLC analysis or stored at −80 °C.
2.8. Sample preparation and HPLC analysis of DA metabolites
60-62% perchloric acid (9.5 M PCA, 33263, Thermo Fisher Scientific) was diluted with water to 1 M and stored at room temperature. CSF (2-5 μl) samples were mixed with 20 μl 1 M PCA. 20 μl plasma samples were mixed with 50 μl 1 M PCA. The mixtures were vortexed immediately and centrifuged at 18,000 g × 15 min at 4 ° C. The clear supernatants were collected and filtered with micro centrifuge filters (18,000 g × 5 min at 4 ° C, 8169, Costar) before the HPLC assay. All sample tubes were kept on ice between centrifugations.
Purchased reference standards for DA (43658-50MG, Sigma-Aldrich), DOPAC (11569-25MG, Sigma-Aldrich), HVA (H1252-100MG, Sigma-Aldrich) and 5-HIAA (55697-10MG, Sigma-Aldrich) were dissolved in methanol (A456-4, Fisher Chemical) to make 1 mg/ml stock and stored at −80 ° C. The stock solutions were further diluted with 1 M PCA to make final DA (100 ng/ml), DOPAC (10 ng/ml), HVA (10 ng/ml) and 5-HIAA (10 ng/ml) solutions for use as reference standards.
The Dionex UltiMate 3000 UHPLC system consisted of an ISO-3100BM pump, a WPS-3000 autosampler, an ECD-3000RS electrochemical detector with 6020RS omni coulometric cell and 6041RS ultra amperometric cell, connected to a computer equipped with Chromeleon 7 chromatography software. The coulometric cell was set to −100 mV, and the amperometric cell was set to 300 mV. The mobile phase buffer (Thermo Scientific MDTM 70-1332, NC9777698, Fisher Scientific) was pumped at a flow rate of 0.75 mL/min through an Acclaim™ 120 C18 column (3.0 × 100 mm, Thermo Fisher Scientific). The injection volume was 10 μl for CSF and the mixture of reference standards and was 40 μl for plasma samples.
The area under the curve in the chromatogram was used to calculate the concentrations of the components detected by Chromeleon 7. To report DOPAC and HVA levels in the CSF samples, we used the ratios of DOPAC/5-HIAA and HVA/5-HIAA because the extremely small volumes of the CSF samples that could be collected from each mouse (2-5 μl per mouse in a successful procedure, with about 70% success rate) made it difficult to accurately calculate the absolute concentrations of DOPAC and HVA in the CSF. Ideally, when a large volume of sample is available, the concentrations of DOPAC and HVA can be calculated from the calibration curve if a fixed volume of sample is mixed with a fixed volume of the PCA solution. Typically, to meet the minimal injection volume requirement and to avoid over dilution of the samples, 5 μl or more sample is needed. However, in our mouse study, we could only collect 2-5 μl CSF per mouse. To maximize the use of all collected samples and to minimize the error associated with small volume handling and excessive sample dilution, we mixed the entire CSF sample from each mouse with variable volumes (2-5 μl) with a fixed volume (20 μl) of the PCA solution, and used the ratios of DOPAC and HVA against an internal control to represent the levels of DOPA and HVA in the CSF. We used 5-HIAA as the internal control in this study because the MitoPark PD model specifically targets DAT-expressing neurons and does not damage the 5-HT system, and that AJ76 and UH232 do not alter brain 5-HT and 5-HIAA levels (Svensson et al., 1986b). Since the sample volume was not a limiting factor for plasma samples, the absolute concentration of HVA in the plasma was calculated from the calibration curves. To calculate the absolute concentration of HVA in plasma samples, a standard curve was generated by running HPLC on samples made of 20 μl HVA reference standard of different concentrations (0.5, 1, 5, 10, 20, 30, 40, 50 ng/ml) mixed with 50 μl 1 M PCA, with 40 μl injection volume.
2.9. Open field test in normal C57BL/6J mice
The open field test was carried out in a seamless open field chamber (27.31 × 27.31 × 20.32 cm, ENV-510, Med-Associates) housed in a sound attenuating box (ENV-018MD-EMS-27, Med-Associates). C57BL/6J mice was placed in the chamber 30 min after injection for a 30-min measurement. Movements were tracked by three 16-beam IR arrays located on the X and Y axes for positional tracking and on the Z axis for rearing detection. Ambulatory counts, stereotypic counts, jump counts, and vertical counts were used to represent the voluntary movement of mice.
2.10. Rotarod test in normal C57BL/6J mice
Mice were placed on a rotating rod (Mouse 6 Lane, Maze Engineers) with rotation speed gradually increasing from 4 to 40 RPM with an acceleration of 20 rpm2 over a period of 5 min. Mice were pre-trained for 3 consecutive days with 1 session consisting of 3 trials. Mice were run for one session consisting of 3 trials as test session on the 4th day 30 min after injection. The fall latency, the time until mice fell from the rotating rod, was measured for comparison of motor coordination.
2.11. Immunohistochemistry
Mice were transcardially perfused with phosphate buffered saline (PBS) followed by 4% paraformaldehyde (PFA). Brains were post-fixed in 4% PFA for 24 hours, and then transferred to 30% sucrose in PBS for storage at 4° C. Coronal slices were sectioned on a microtome (KS34, Thermo Fisher Scientific) at the thickness of 35 μm.
For DAB staining, sections were blocked with 10% normal goat serum (S-1000-20, Vector Labs) and 0.2% Triton X-100 (T9284-100ML, Sigma) for 1 hr at room temperature, followed by incubation at 4° C with a primary antibody against tyrosine hydroxylase (TH) (1:4000, ab152, Millipore/Chemicon) overnight. Sections were then incubated with a biotinylated secondary antibody (1:200, BA-1000, Vector Laboratories) for 1 hr, followed by incubation in avidin-biotin peroxidase complex (PK6100, Vector Laboratories) for 1 hr, and immunoreactivity was detected with 3,3’-diaminobenzidine (DAB, D5905, Sigma-Aldrich). The tissue was then dehydrated and cleared with ethanol and xylenes prior to cover slipping. Tissue was imaged at the NIEHS Image Analysis Group using an Aperio AT2 slide scanner (Leica Biosystems).
For immunofluorescence staining, sections were blocked with 10% normal goat serum (S-1000-20, Vector Labs) and 0.2% Triton X-100 (T9284-100ML, Sigma) for 1 hr at room temperature, followed by incubation at 4° C overnight with primary antibodies against TH (1:4000, ab152, Millipore/Chemicon) and anti-GFP (1:1000, ab13970, Abcam) for detecting dLight1.1. After washing out excessive primary antibodies, the slices were incubated in the secondary antibodies for 2 hr at room temperature. The secondary antibodies used were Alexa Fluor 488 conjugated goat anti-chicken (1:500, A-11039, Invitrogen), and goat anti rabbit Alexa Fluor 647 (1:1000, A-21245, Invitrogen). After thoroughly washing, the slices were mounted on slides and imaged on a Zeiss Axiocam MR monochrome camera installed on Axio observer Z1 fluorescent microscope with 20x objective (numerical aperture 0.8). The images were acquired and processed using Zen 2012 Blue software (Carl Zeiss).
2.12. Sensitivity and specificity
The threshold for a positive diagnosis was defined as the mean of two means of the challenged groups: Threshold = (Meanchallenged_control + Meanchallenged_PD)/2. To calculate the sensitivity and specificity for DNC Test, we defined NTrue+ as the number of MitoPark mice that were correctly diagnosed, that is, the number of MitoPark mice with measured DNC Test values smaller than the defined threshold; NTotal_PD as the total number of MitoPark mice that were tested; NTrue- as the number of littermate control mice that were correctly diagnosed, that is, the number of littermate control mice with measured DNC Test values larger than the defined threshold; NTotal_control as the total number of littermate control mice tested.
Sensitivity = NTrue+/ NTotal_PD × 100%;
Specificity = NTrue-/ NTotal_control × 100%
2.13. Statistical analysis
One-way ANOVA, two-way ANOVA followed by multiple comparisons, unpaired and paired t-tests were carried out using GraphPad Prism 8 (GraphPad Software). Results of the statistical analyses, including Mean ± SEM, sample sizes and P values are indicated in either the text or figure legends.
3. Results
3.1. Effects of AJ76 and UH232 on motor function
We first examined whether AJ76 and UH232 would cause motor side effects by performing open field tests and accelerating rotarod tests in normal C57BL/6J mice after an intraperitoneal (i.p.) injection of vehicle (normal saline), AJ76 (20 mg/kg), or UH232 (20 mg/kg). We found that there was no significant difference in ambulatory (ANOVA: F(2,24) = 0.8220; P = 0.4515), stereotypic (ANOVA: F(2,24) = 1.049; P = 0.3657), jump (ANOVA: F(2,24) = 2.934; P = 0.0724), and vertical (ANOVA: F(2,24) = 2.648; P = 0.0914) counts in open field tests between vehicle, AJ76 or UH232 groups (Fig. 2A–D). AJ76 and UH232 also didn’t affect the latency to fall in accelerating rotarod tests (ANOVA: F(2,6) = 0.2223; P = 0.8070, Fig. 2E). These results suggest that AJ76 and UH232, unlike haloperidol, do not cause motor side effects after a single injection at the dose we used for the DNC Test.
Figure 2 |. AJ76 and UH232 do not cause adverse motor side effects.

A-D, Ambulatory (A), stereotypic (B), jump (C), and vertical (D) counts in an open field test 30 min after an i.p. injection of saline (black), AJ76 (orange) or UH232 (green) in C57/BL6 mice. n.s., p > 0.05, n = 9 for each group, one-way ANOVA followed by Tukey’s multiple comparisons test. E, Latency to fall in rotarod tests from 3 consecutive days for training (consisting of 3 trials per day) and followed by a testing session (consisting of 3 trials) on the 4th day. Saline (black), AJ76 (orange) or UH232 (green) was injected 30 min before the testing session only. n = 10 for saline; n = 8 for AJ76; n = 9 for UH232. n.s., p > 0.05, one-way ANOVA followed by Tukey’s multiple comparisons test. All data are plotted as Mean ± SEM overlaid with individual replicates.
3.2. Effect of AJ76 and UH232 on striatal dopamine release
We next examined whether AJ76 and UH232 could induce dopamine release in vivo. As previously described(Zhou et al., 2021), to measure the drug-induced dopamine release in vivo, we expressed genetically encoded fluorescent dopamine indicator dLight1.1(Patriarchi et al., 2018) in the brain of normal C57BL/6J mice and used spectrally resolved fiber photometry(Meng et al., 2018) to monitor the striatal extracellular dopamine level before and after an i.p. injection of saline, AJ76 (20 mg/kg) or UH232 (20 mg/kg) (Fig. 3A, B). We found that both AJ76 and UH232 produced a rise in the extracellular dopamine level (Fig. 3C), with AJ76 producing a more prominent rise than UH232 (ANOVA: F(2,57) = 5.484; P = 0.0066, Fig. 3D).
Figure 3 |. AJ76 and UH232 induce dopamine release in the striatum in vivo in normal C57BL/6J mice.
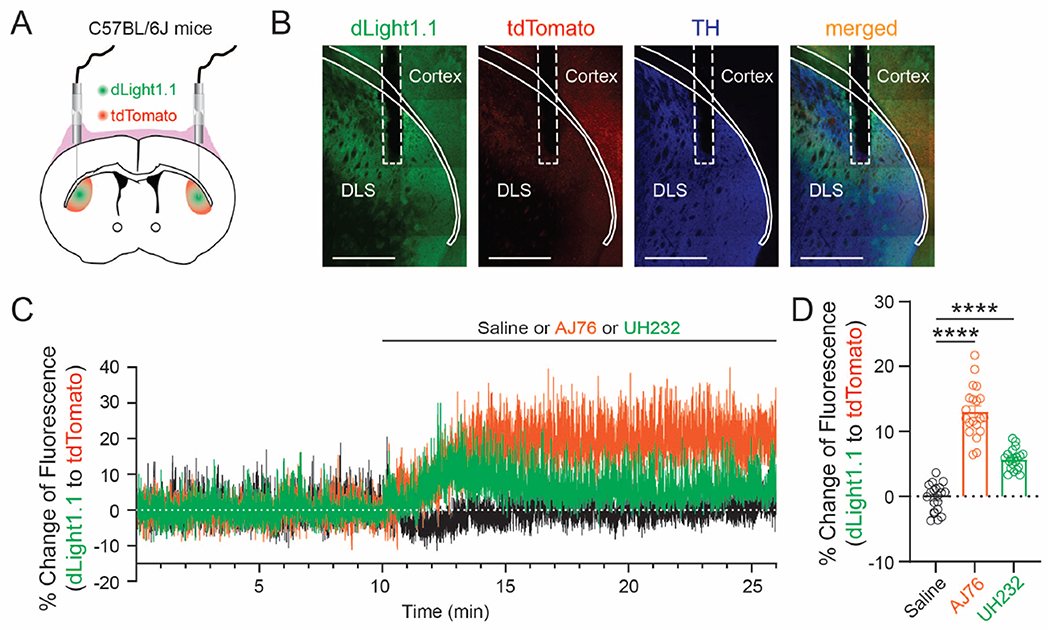
A, Schematic illustration of the intrastriatal fiber photometry recordings using green fluorescent DA sensor dLight1.1 and red fluorescent protein tdTomato. B, Immunofluorescence images to show the expression of dLight1.1, tdTomato and TH. In this particular immunostaining experiment, TH is labelled with Alexa Fluor 647 secondary antibody and dLight1.1 is labelled with Alexa Fluor 488 secondary antibody, whereas tdTomato is unstained and visualized by its endogenous fluorescence. Scale: 1000 μm. Cortex and DLS (dorsolateral striatum) were indicated with solid line. Optical fiber tip was indicated with dashed line. C, The dynamic changes of extracellular DA level, represented by the fluorescence ratio of dLight1.1 to tdTomato in a freely moving mouse before and after an i.p. injection of saline (black), AJ76 (orange) or UH232 (green). D, Comparison of the percent increase in the ratio of dLight1.1/tdTomato caused by different compounds. n = 20 samples recorded bilaterally from 10 C57BL/6J mice for each group. ****, p < 0.0001, one-way ANOVA followed by Dunnett’s multiple comparisons test. All data are plotted as Mean ± SEM overlaid with individual replicates.
3.3. DNC Test using AJ76 or UH232 can detect PD at early stages.
To test the sensitivity and selectivity of the DNC Test using AJ76 or UH232 as the challenging agent for detecting PD at various early stages, we used MitoPark mice, a progressively degenerating genetic PD model with age-dependent loss of DANs(Ekstrand et al., 2007). As shown in our previous study(Zhou et al., 2021), MitoPark mice lose 28% of DANs compared to littermate controls (Fig. 4A) and show a significant loss of TH+ axonal terminals in the dorsal striatum (Fig. 4B) by the age of 20 weeks. At the age of 15 weeks, MitoPark mice have not developed significant loss of DANs compared to littermate controls (Fig. 4F) with only mild loss of TH+ axonal terminals in the dorsal striatum (Fig. 4G). Thus, we used 20-week-old MitoPark mice to model an early stage PD and 15-week-old MitoPark mice to model an ultra-early stage PD in this study.
Figure 4 |. DNC Test using AJ76 or UH232 can detect the hypodopaminergic state in MitoPark PD mice at early and ultra-early stages.

A,B, DAB staining of TH+ cells in the ventral midbrain (A) and TH+ terminals in the striatum (B) in 20-week-old littermate control and MitoPark mice. Scale bar: 500 μm in A; 1000 μm in B. C-E, Levels of DOPAC (C) and HVA (D) in CSF and HVA in plasma (E) at the resting state (black) and after an i.p. injection of AJ76 (20 mg/kg, orange) or UH232 (20 mg/kg, green) in 20-week-old littermate control (filled columns) and MitoPark mice (blank columns), n = 10 and 10 for control and MitoPark at resting state; n = 9 and 10 for control and MitoPark after injection of AJ76; n = 15 and 12 for control and MitoPark after injection of UH232 in C and D; n = 6 and 6 for control and MitoPark at resting state; n = 18 and 10 for control and MitoPark after injection of AJ76; n = 17 and 10 for control and MitoPark after injection of UH232 in E. F,G, DAB staining of TH+ cells in the ventral midbrain (F) and TH+ terminals in the striatum (G) in 15-week-old littermate control and MitoPark mice. Scale bar: 500 μm in F; 1000 μm in G. H-J, Levels of DOPAC (H) and HVA (I) in CSF and HVA in plasma (J) at the resting state (black) and after an i.p. injection of AJ76 (20 mg/kg, orange) or UH232 (20 mg/kg, green) in 15-week-old littermate control (filled columns) and MitoPark mice (blank columns). n = 15 and 13 for control and MitoPark at resting state; n = 12 and 11 for control and MitoPark after injection of AJ76; n = 14 and 12 for control and MitoPark after injection of UH232 in H and I; n = 15 and 11 for control and MitoPark at resting state; n = 16 and 11 for control and MitoPark after injection of AJ76; n = 19 and 12 for control and MitoPark after injection of UH232 in J. n.s., p > 0.05; *, p < 0.05; **, p < 0.01; ***, p < 0.001; ****, p < 0.0001, two-way ANOVA followed by Sidak’s multiple comparisons test. All data are plotted as Mean ±SEM overlaid with individual replicates.
We first compared the levels of DOPAC and HVA in CSF samples and the level of HVA in plasma samples between 20-week-old MitoPark mice and their littermate controls at the resting state and at 60 min after the i.p. injection of AJ76 (20 mg/kg) or UH232 (20 mg/kg). To minimize the errors produced by small volume handling and dilution in CSF samples, we used the main serotonin metabolite 5-Hydroxyindoleacetic acid (5-HIAA) as the internal control, and used ratios of DOPAC/5-HIAA and HVA/5-HIAA to represent DOPAC and HVA levels in the CSF. We found that there was no significant difference in the baseline values of DOPAC/5-HIAA, HVA/5-HIAA in the CSF or the HVA level in the plasma between 20-week-old MitoPark mice and controls at the resting state (CSF DOPAC/5-HIAA: littermate control = 9.76 × 10⁻² ± 6.58 × 10⁻³, MitoPark = 7.81 × 10⁻² ± 8.16 × 10⁻³. CSF HVA/5-HIAA: littermate control = 8.19 × 10⁻² ± 2.89 × 10⁻³, MitoPark = 6.78 × 10⁻² ± 5.10 × 10⁻³. Plasma HVA: littermate control = 9.65 ± 0.46 ng/ml, MitoPark = 8.32 ± 0.45 ng/ml. Fig. 4C–E). However, after an AJ76 or UH232 challenge, significant differences between PD and control mice were revealed (For AJ76, CSF DOPAC/5-HIAA: littermate control = 1.40 × 10⁻¹ ± 7.24 × 10⁻³, MitoPark = 7.05 × 10⁻² ± 7.61 × 10⁻³; CSF HVA/5-HIAA: littermate control = 1.40 × 10⁻¹ ± 5.44 × 10⁻³, MitoPark = 6.78 × 10⁻² ± 4.46 × 10⁻³; Plasma HVA: littermate control = 15.54 ± 0.67 ng/ml, MitoPark = 11.05 ± 0.43 ng/ml. For UH232, CSF DOPAC/5-HIAA: littermate control = 1.18 × 10⁻¹ ± 5.72 × 10⁻³, MitoPark = 7.29 × 10⁻² ± 4.66 × 10⁻³; CSF HVA/5-HIAA: littermate control = 1.21 × 10⁻¹ ± 4.51 × 10⁻³, MitoPark = 7.02 × 10⁻² ± 3.21 × 10⁻³; Plasma HVA: littermate control = 15.41 ± 0.46 ng/ml, MitoPark = 11.11 ± 0.44 ng/ml. For Fig. 4C, ANOVA: F(1,60) = 77.09; P < 0.0001; for Fig. 4D, ANOVA: F(1,60) = 125.8; P < 0.0001; for Fig. 4E, ANOVA: F(1,61) = 40.32; P < 0.0001. Fig. 4C–E), suggesting that the DNC Test using AJ76 or UH232 can detect PD at an early stage when less than 30% of DANs have been lost.
Next, we examined whether the DNC Test using AJ76 or UH232 could detect ultra-early stage PD using 15-week-old MitoPark mice. We compared the ratios of DOPAC/5-HIAA and HVA/5-HIAA in CSF samples and the level of HVA in plasma samples between 15-week-old MitoPark mice and their littermate controls at the resting state and at 60 min after the drug challenge. Similar to 20-week-old MitoPark mice, we found that there was no significant difference of DOPAC/5-HIAA, HVA/5-HIAA in the CSF or the HVA level in the plasma between MitoPark mice and controls at the resting state (CSF DOPAC/5-HIAA: littermate control = 8.10 × 10⁻² ± 4.14 × 10⁻³, MitoPark = 8.65 × 10⁻² ± 5.79 × 10⁻³. CSF HVA/5-HIAA: littermate control = 8.63 × 10⁻² ± 3.56 × 10⁻³, MitoPark = 8.15 × 10⁻² ± 4.84 × 10⁻³. Plasma HVA (ng/ml): littermate control = 8.58 ± 0.36, MitoPark = 7.58 ± 0.26. Fig. 4H–J). After the AJ76 or UH232 challenge however, significant differences in these measurements were revealed (For AJ76, CSF DOPAC/5-HIAA: littermate control = 1.25 × 10⁻¹ ± 1.01 × 10⁻², MitoPark = 9.25 × 10⁻² ± 8.40 × 10⁻³; CSF HVA/5-HIAA: littermate control = 1.47 × 10⁻¹ ± 6.91 × 10⁻³, MitoPark = 1.03 × 10⁻¹ ± 7.08 × 10⁻³; Plasma HVA: littermate control = 13.25 ± 0.48 ng/ml, MitoPark = 10.52 ± 0.63 ng/ml. For UH232, CSF DOPAC/5-HIAA: littermate control = 1.27 × 10⁻¹ ± 8.82 × 10⁻³, MitoPark = 9.64 × 10⁻² ± 4.83 × 10⁻³; CSF HVA/5-HIAA: littermate control = 1.34 × 10⁻¹ ± 6.95 × 10⁻³, MitoPark = 9.38 × 10⁻² ± 2.70 × 10⁻³; Plasma HVA: littermate control = 13.44 ± 0.35 ng/ml, MitoPark = 11.18 ± 0.55 ng/ml. For Fig. 4H, ANOVA: F(1,71) = 10.73; P = 0.0016; for Fig. 4I, ANOVA: F(1,71) = 42.8; P < 0.0001; for Fig. 4J, ANOVA: F(1,78) = 28.75; P < 0.0001. Fig. 4H–J).
4. Discussion
The goal of this study was to address the potential concern of using haloperidol in the DNC Test for early diagnosis of PD. We explored whether dopamine autoreceptor preferring agonists AJ76 or UH232 could be used as a single challenging agent to replace the dual agents, haloperidol and methylphenidate, used in the original DNC Test. We first showed that unlike haloperidol, an injection of AJ76 or UH232 did not cause motor side effects in open field and rotarod tests. We then tested their efficacy in inducing dopamine release in the striatum and their sensitivity and selectivity for detecting early stages of PD in 20-week-old and 15-week-old MitoPark mice.
Our results show that DNC Tests using AJ76 or UH232 can achieve 100% sensitivity and specificity in detecting the hypodopaminergic state in 20-week-old MitoPark mice and 82-100% sensitivity and 79-83% specificity in 15-week-old MitoPark mice when the CSF HVA/5-HIAA is used as the diagnostic index (Table 1). When using plasma samples, DNC Tests with AJ76 or UH232 can achieve 90% sensitivity and 82-89% specificity in 20-week-old MitoPark mice, and 73-75% sensitivity and 80-81% specificity in 15-week-old MitoPark mice (Table 1). Notably, in 20-week-old MitoPark mice, the HVA level in CSF did not show an increase after the challenge with AJ76 or UH232 (resting = 6.78 × 10⁻² ± 5.10 × 10⁻³, AJ76 = 6.78 × 10⁻² ± 4.46 × 10⁻³, UH232 = 7.02 × 10⁻² ± 3.21 × 10⁻³; n.s., p > 0.05, two-way ANOVA followed by Sidak’s multiple comparisons test. Figure 4c, d), while there was a significant increase in the plasma HVA level after the challenge (resting = 8.32 ± 0.45 ng/ml, AJ76 = 11.05 ± 0.43 ng/ml, UH232 = 11.11 ± 0.44 ng/ml; *, p < 0.05, two-way ANOVA followed by Sidak’s multiple comparisons test. Figure 4e). This differential effects of DNC Tests on CSF and plasma HVA levels, which resulted in a reduced sensitivity and specificity when using plasma samples, is likely due to the large contribution of the peripheral dopamine sources, such as the sympathetic nervous system and the adrenal medulla, to the plasma HVA level(Goldstein et al., 2003).
Table 1.
Sensitivity and specificity of the DNC Test using AJ76 or UH232 for detecting early and ultra-early-stage PD in MitoPark mice.
|
|
|||||
|---|---|---|---|---|---|
| 20w | Antagonist | DNC Test parameter | Threshold for positive diagnosis (Meancontrol + MeanPD)/2 | Sensitivity (true positive rate) | Specificity (true negative rate) |
|
|
|||||
| AJ76-20mg/kg | CSF DOPAC/5-HIAA | 0.09781 | 100% (10/10) | 89% (8/9) | |
|
|
|||||
| UH232-20mg/kg | CSF DOPAC/5-HIAA | 0.09523 | 92% (11/12) | 93% (14/15) | |
|
|
|||||
| AJ76-20mg/kg | CSF HVA/5-HIAA | 0.1040 | 100% (10/10) | 100% (9/9) | |
|
|
|||||
| UH232-20mg/kg | CSF HVA/5-HIAA | 0.09571 | 100% (12/12) | 100% (15/15) | |
|
|
|||||
| AJ76-20mg/kg | Plasma HVA (ng/ml) | 13.30 | 90% (9/10) | 89% (16/18) | |
|
|
|||||
| UH232-20mg/kg | Plasma HVA (ng/ml) | 13.26 | 90% (9/10) | 82% (14/17) | |
|
|
|||||
|
|
|||||
| 15w | Antagonist | DNC Test parameter | Threshold for positive diagnosis (Meancontrol + MeanPD)/2 | Sensitivity (true positive rate) | Specificity (true negative rate) |
|
|
|||||
| AJ76-20mg/kg | CSF DOPAC/5-HIAA | 0.1089 | 64% (7/11) | 58% (7/12) | |
|
|
|||||
| UH232-20mg/kg | CSF DOPAC/5-HIAA | 0.1193 | 83% (10/12) | 57% (8/14) | |
|
|
|||||
| AJ76-20mg/kg | CSF HVA/5-HIAA | 0.1310 | 82% (9/11) | 83% (10/12) | |
|
|
|||||
| UH232-20mg/kg | CSF HVA/5-HIAA | 0.1193 | 100% (12/12) | 79% (11/14) | |
|
|
|||||
| AJ76-20mg/kg | Plasma HVA (ng/ml) | 11.88 | 73% (8/11) | 81% (13/16) | |
|
|
|||||
| UH232-20mg/kg | Plasma HVA (ng/ml) | 12.31 | 75% (9/12) | 80% (15/19) | |
|
|
|||||
AJ76 and UH232 are relatively older drugs that were developed decades ago and are not frequently seen in more recent publications (Johansson et al., 1985; Sotnikova et al., 2001; Svensson et al., 1986a; Svensson et al., 1986b). Many newer, selective D2 and D3 receptor antagonists are available that may be good candidates for the DNC Test. However, their selectivity is compared between D2, D3, D1 and other neurotransmitter receptors, not between pre- (autoreceptors) and postsynaptic D2 and D3 receptors. When we searched for potential DAN challenging agents, we set two criteria: the ability to induce robust dopamine release and the lack of extrapyramidal side effects. In our literature search on all available D2 and D3 antagonists, AJ76 and UH232 were the only preferential autoreceptor antagonists that met the criteria. So far, very little is known about the safety and other pharmacological properties of these two drugs in humans (Lahti et al., 1998). Thus, their values in clinical use are uncertain.
Other compounds based on UH232 (Sonesson et al., 1994) showed excellent performance in elevating brain dopamine metabolites without causing severe extrapyramidal side effects. They can be tested as additional choices in the pool of DAN challenging agents.
It is estimated that by the time when PD symptoms occur in human patients, about 30% (Burke and O’Malley, 2013) to 60%(Dauer and Przedborski, 2003) of nigral DANs have already been lost. The DNC Test showed excellent sensitivity and selectivity in detecting the hypodopaminergic state in 20-week-old MitoPark mice with 28% loss of DANs (Zhou et al., 2021), suggesting that the DNC Test, if carried out in patients, may be sensitive enough to detect PD at the clinical onset or a prodromal stage close to the clinical onset. However, the DNC Test’s sensitivity and selectivity dropped significantly in 15-week-old MitoPark mice with 44% loss of dopaminergic axons in the dorsal striatum but no detectable nigral DAN loss (Zhou et al., 2021), suggesting that the DNC Test’s ability to detect the very early prodromal phase of human PD is limited. A potential strategy to detect the very early stage of prodromal phase of PD is to use pharmacological agents to challenge the central or peripheral nervous system that is impacted before the DANs are lesioned (Goldstein et al., 2019).
Furthermore, many challenges exist in implementing the DNC Test in diagnosing human PD. To overcome the distinct pharmacokinetic issues for the DAN challenging drug between individuals, the timing of the sample collection is critical. The CSF and blood samples need to be collected after the drug effect has reached the plateau and before it starts to decay. To correct for variants such as body weight, drug absorption, distribution and metabolism, the concentrations of the drug and its metabolites can be measured in the CSF and blood samples and used as correcting factors. Since PD patients may have distinct levels of lesion in serotonin and other neurotransmitter systems, 5-HIAA and other neurotransmitter metabolites cannot be used as internal controls when measuring CSF DOPAC and HVA as we did in this animal study.
However, since the volume of the CSF collected through lumbar puncture in humans is in the range of several milliliters, the absolute concentrations of CSF DOPAC and HVA can be easily calculated. Also, the range of DOPAC and HVA values between normal individuals is tremendously large, and aged individuals will have a natural decrease in dopaminergic fibers. A normal range of DOPAC and HVA for the DNC Test will be difficult to establish or may be too large to compare against a diseased condition. One potential solution is to collect the samples twice, one before the drug challenge as the baseline value, and one after the drug has achieved full effect. The percent change from the baseline may be a more sensitive indicator for the degree of the lesion in the dopaminergic system.
In summary, we tested two dopamine autoreceptor preferring antagonists, AJ76 and UH232, as potential, alternative challenging agents for the DNC Test to replace haloperidol and methylphenidate with a single, safer compound. Our results show that DNC Tests using AJ76 or UH232 can reach the same range of sensitivity and selectivity as the original DNC Test in detecting early stages of PD without causing adverse motor side effects.
Dopamine autoreceptor preferring antagonists AJ76 and UH232 increase striatal dopamine release without causing adverse motor side effects.
The “Dopamine Neuron Challenge Test” (DNC Test) using AJ76 or UH232 as the challenging agent can detect early-stage and ultra-early-stage Parkinson’s disease (PD) in a mouse model.
The DNC Test using AJ76 or UH232 significantly improves its practicality as a diagnostic test for detecting early PD.
Acknowledgements
We thank Lin Tian for the gift of pAAV-CAG-dLight1.1 plasmid, Hongkui Zeng for the gift of pAAV-hSyn1(S)-tdTomato-WPRE plasmid and NIEHS Viral Vector Core for packaging AAVs; Jeff Tucker and Erica Scappini of NIEHS Fluorescence Microscopy and Imaging Center, and Eli Ney of NIEHS Image Analysis Group for their assistance on imaging of brain sections.
Funding
This work is supported by the Intramural Research Program of the NIH/NIEHS of the United States (1ZIAES103310 to G.C.).
Abbreviations
- DNC
Dopamine Neuron Challenge
- CSF
Cerebrospinal fluid
- PD
Parkinson’s disease
- DANs
Dopamine neurons
- SNc
Substantia nigra pars compacta
- D2R
Dopamine D2 receptor
- DOPAC
3,4-Dihydroxyphenylacetic acid
- HVA
homovanillic acid
- 5-HIAA
5-Hydroxyindoleacetic acid
Footnotes
Publisher's Disclaimer: This is a PDF file of an unedited manuscript that has been accepted for publication. As a service to our customers we are providing this early version of the manuscript. The manuscript will undergo copyediting, typesetting, and review of the resulting proof before it is published in its final form. Please note that during the production process errors may be discovered which could affect the content, and all legal disclaimers that apply to the journal pertain.
Competing interests
The authors have declared that NO conflict of interest exists.
Data Availability Statement
All data needed to evaluate the conclusions in the paper are present in the paper and/or the Supplementary Materials. The raw and analyzed datasets generated during the study are available for research purposes from the corresponding author upon reasonable request. Additional data related to this paper may be requested from the authors.
References
- Backman CM, Malik N, Zhang Y, Shan L, Grinberg A, Hoffer BJ, Westphal H, Tomac AC, 2006. Characterization of a mouse strain expressing Cre recombinase from the 3’ untranslated region of the dopamine transporter locus. Genesis 44, 383–390. [DOI] [PubMed] [Google Scholar]
- Burke RE, O’Malley K, 2013. Axon degeneration in Parkinson’s disease. Exp Neurol 246, 72–83. [DOI] [PMC free article] [PubMed] [Google Scholar]
- Chan CS, Guzman JN, Ilijic E, Mercer JN, Rick C, Tkatch T, Meredith GE, Surmeier DJ, 2007. ‘Rejuvenation’ protects neurons in mouse models of Parkinson’s disease. Nature 447, 1081–1086. [DOI] [PubMed] [Google Scholar]
- Cheng HC, Ulane CM, Burke RE, 2010. Clinical progression in Parkinson disease and the neurobiology of axons. Ann Neurol 67, 715–725. [DOI] [PMC free article] [PubMed] [Google Scholar]
- Cui G, Jun SB, Jin X, Luo G, Pham MD, Lovinger DM, Vogel SS, Costa RM, 2014. Deep brain optical measurements of cell type-specific neural activity in behaving mice. Nat Protoc 9, 1213–1228. [DOI] [PMC free article] [PubMed] [Google Scholar]
- Dauer W, Przedborski S, 2003. Parkinson’s disease: mechanisms and models. Neuron 39, 889–909. [DOI] [PubMed] [Google Scholar]
- Ekstrand MI, Terzioglu M, Galter D, Zhu S, Hofstetter C, Lindqvist E, Thams S, Bergstrand A, Hansson FS, Trifunovic A, Hoffer B, Cullheim S, Mohammed AH, Olson L, Larsson NG, 2007. Progressive parkinsonism in mice with respiratory-chain-deficient dopamine neurons. Proc Natl Acad Sci U S A 104, 1325–1330. [DOI] [PMC free article] [PubMed] [Google Scholar]
- Garau L, Govoni S, Stefanini E, Trabucchi M, Spano PF, 1978. Dopamine receptors: pharmacological and anatomical evidences indicate that two distinct dopamine receptor populations are present in rat striatum. Life Sci 23, 1745–1750. [DOI] [PubMed] [Google Scholar]
- Golde WT, Gollobin P, Rodriguez LL, 2005. A rapid, simple, and humane method for submandibular bleeding of mice using a lancet. Lab Anim (NY) 34, 39–43. [DOI] [PubMed] [Google Scholar]
- Goldstein DS, Eisenhofer G, Kopin IJ, 2003. Sources and significance of plasma levels of catechols and their metabolites in humans. J Pharmacol Exp Ther 305, 800–811. [DOI] [PubMed] [Google Scholar]
- Goldstein DS, Pekker MJ, Eisenhofer G, Sharabi Y, 2019. Computational modeling reveals multiple abnormalities of myocardial noradrenergic function in Lewy body diseases. JCI Insight 5. [DOI] [PMC free article] [PubMed] [Google Scholar]
- Johansson AM, Arvidsson LE, Hacksell U, Nilsson JL, Svensson K, Hjorth S, Clark D, Carlsson A, Sanchez D, Andersson B, et al. , 1985. Novel dopamine receptor agonists and antagonists with preferential action on autoreceptors. J Med Chem 28, 1049–1053. [DOI] [PubMed] [Google Scholar]
- Lahti AC, Weiler M, Carlsson A, Tamminga CA, 1998. Effects of the D3 and autoreceptor-preferring dopamine antagonist (+)-UH232 in schizophrenia. J Neural Transm (Vienna) 105, 719–734. [DOI] [PubMed] [Google Scholar]
- Lang AE, Lozano AM, 1998a. Parkinson’s disease. First of two parts. N Engl J Med 339, 1044–1053. [DOI] [PubMed] [Google Scholar]
- Lang AE, Lozano AM, 1998b. Parkinson’s disease. Second of two parts. N Engl J Med 339, 1130–1143. [DOI] [PubMed] [Google Scholar]
- Lima MM, Martins EF, Delattre AM, Proenca MB, Mori MA, Carabelli B, Ferraz AC, 2012. Motor and non-motor features of Parkinson’s disease - a review of clinical and experimental studies. CNS Neurol Disord Drug Targets 11, 439–449. [DOI] [PubMed] [Google Scholar]
- Liu L, Duff K, 2008. A technique for serial collection of cerebrospinal fluid from the cisterna magna in mouse. J Vis Exp. [DOI] [PMC free article] [PubMed] [Google Scholar]
- Meng C, Zhou J, Papaneri A, Peddada T, Xu K, Cui G, 2018. Spectrally Resolved Fiber Photometry for Multi-component Analysis of Brain Circuits. Neuron 98, 707–717 e704. [DOI] [PMC free article] [PubMed] [Google Scholar]
- Noyce AJ, Lees AJ, Schrag AE, 2016. The prediagnostic phase of Parkinson’s disease. J Neurol Neurosurg Psychiatry 87, 871–878. [DOI] [PMC free article] [PubMed] [Google Scholar]
- Oh SW, Harris JA, Ng L, Winslow B, Cain N, Mihalas S, Wang Q, Lau C, Kuan L, Henry AM, Mortrud MT, Ouellette B, Nguyen TN, Sorensen SA, Slaughterbeck CR, Wakeman W, Li Y, Feng D, Ho A, Nicholas E, Hirokawa KE, Bohn P, Joines KM, Peng H, Hawrylycz MJ, Phillips JW, Hohmann JG, Wohnoutka P, Gerfen CR, Koch C, Bernard A, Dang C, Jones AR, Zeng H, 2014. A mesoscale connectome of the mouse brain. Nature 508, 207–214. [DOI] [PMC free article] [PubMed] [Google Scholar]
- Patriarchi T, Cho JR, Merten K, Howe MW, Marley A, Xiong WH, Folk RW, Broussard GJ, Liang R, Jang MJ, Zhong H, Dombeck D, von Zastrow M, Nimmerjahn A, Gradinaru V, Williams JT, Tian L, 2018. Ultrafast neuronal imaging of dopamine dynamics with designed genetically encoded sensors. Science 360. [DOI] [PMC free article] [PubMed] [Google Scholar]
- Sanberg PR, 1980. Haloperidol-induced catalepsy is mediated by postsynaptic dopamine receptors. Nature 284, 472–473. [DOI] [PubMed] [Google Scholar]
- Schwarcz R, Creese I, Coyle JT, Snyder SH, 1978. Dopamine receptors localised on cerebral cortical afferents to rat corpus striatum. Nature 271, 766–768. [DOI] [PubMed] [Google Scholar]
- Sonesson C, Lin CH, Hansson L, Waters N, Svensson K, Carlsson A, Smith MW, Wikstrom H, 1994. Substituted (S)-phenylpiperidines and rigid congeners as preferential dopamine autoreceptor antagonists: synthesis and structure-activity relationships. J Med Chem 37, 2735–2753. [DOI] [PubMed] [Google Scholar]
- Sotnikova TD, Gainetdinov RR, Grekhova TV, Rayevsky KS, 2001. Effects of intrastriatal infusion of D2 and D3 dopamine receptor preferring antagonists on dopamine release in rat dorsal striatum (in vivo microdialysis study). Pharmacol Res 43, 283–290. [DOI] [PubMed] [Google Scholar]
- Svensson K, Hjorth S, Clark D, Carlsson A, Wikstrom H, Andersson B, Sanchez D, Johansson AM, Arvidsson LE, Hacksell U, et al. , 1986a. (+)-UH 232 and (+)-UH 242: novel stereoselective dopamine receptor antagonists with preferential action on autoreceptors. J Neural Transm 65, 1–27. [DOI] [PubMed] [Google Scholar]
- Svensson K, Johansson AM, Magnusson T, Carlsson A, 1986b. (+)-AJ 76 and (+)-UH 232: central stimulants acting as preferential dopamine autoreceptor antagonists. Naunyn Schmiedebergs Arch Pharmacol 334, 234–245. [DOI] [PubMed] [Google Scholar]
- Zhou J, Li J, Papaneri AB, Kobzar NP, Cui G, 2021. Dopamine Neuron Challenge Test for early detection of Parkinson’s disease. NPJ Parkinsons Dis 7, 116. [DOI] [PMC free article] [PubMed] [Google Scholar]
Associated Data
This section collects any data citations, data availability statements, or supplementary materials included in this article.
Data Availability Statement
All data needed to evaluate the conclusions in the paper are present in the paper and/or the Supplementary Materials. The raw and analyzed datasets generated during the study are available for research purposes from the corresponding author upon reasonable request. Additional data related to this paper may be requested from the authors.