

Abstract
Background and objectives
The hemodynamic evaluation of coronary stenoses undergoes a transition from wire-based invasive measurements to image-based computational assessments. However, fractional flow reserve (FFR) values derived from coronary CT angiography (CCTA) and angiography-based quantitative flow ratio have certain limitations in accuracy and efficiency, preventing their widespread use in routine practice. Hence, we aimed to investigate the diagnostic performance of FFR derived from the integration of CCTA and invasive angiography (FFRCT-angio) with artificial intelligence assistance in patients with stable coronary artery disease (CAD).
Methods
Forty stable CAD patients with 67 target vessels (50%–90% diameter stenosis) were included in this single-center retrospective study. All patients underwent CCTA followed by coronary angiography with FFR measurement within 30 days. Both CCTA and angiographic images were combined to generate a three-dimensional reconstruction of the coronary arteries using artificial intelligence. Subsequently, functional assessment was performed through a deep learning algorithm. FFR was used as the reference.
Results
FFRCT-angio values were significantly correlated with FFR values (r = 0.81, P < 0.001, Spearman analysis). Per-vessel diagnostic accuracy of FFRCT-angio was 92.54%. Sensitivity and specificity in identifying ischemic lesions were 100% and 88.10%, respectively. Positive predictive value and negative predictive value were 83.33% and 100%, respectively. Moreover, the diagnostic performance of FFRCT-angio was satisfactory in different target vessels and different segment lesions.
Conclusions
FFRCT-angio exhibits excellent diagnostic performance of identifying ischemic lesions in patients with stable CAD. Combining CCTA and angiographic imaging, FFRCT-angio may represent an effective and practical alternative to invasive FFR in selected patients.
Key words: artificial intelligence, CT angiography-derived fractional flow reserve, fractional flow reserve, quantitative flow ratio, stable coronary artery disease
Introduction
Fractional flow reserve (FFR) is considered to be one of the gold standards for assessing the hemodynamic significance of a coronary stenosis and is commonly used to guide decision-making during coronary interventions.[1, 2, 3] Increasing evidence has shown that FFR-guided strategies help to improve clinical outcomes, to avoid unnecessary revascularization, and to reduce medical costs in patients with coronary artery disease (CAD).[4, 5, 6, 7] However, the use of FFR in clinical practice remains low due to the potential risk of pressure wire injury, extra time and cost, and side effects of hyperemic agents associated with the invasive measurement.[8, 9, 10] To overcome FFR limitations, coronary CT angiography (CCTA)- and invasive coronary angiography (CAG)-based methods that functionally evaluate coronary stenoses were developed, that is, FFR derived from CCTA (FFRCT) and angiography-based quantitative flow ratio (QFR) measurements. These methods can simultaneously evaluate the anatomic and hemodynamic significance of stenotic lesions.[11] A number of studies have demonstrated that FFRCT has high sensitivity and specificity in identifying myocardial ischemia.[12, 13, 14, 15] However, the diagnostic accuracy of FFRCT depends on the CCTA image quality, and this method is not indicated in lesions with severe calcification.[16] In addition, FFRCT commonly relies on the analysis of computational fluid dynamics, which is complicated and time-consuming.[17] As for QFR, recent studies have shown that this method shows excellent diagnostic performance in evaluating the functional significance of a coronary stenosis.[18, 19, 20, 21, 22] However, QFR relies on a three-dimensional (3D) reconstruction of vessels from two or more images, which usually requires large imaging angles between/among the images, as well as no substantial foreshortening and vessel overlap.[23] Given the above issues concerning FFRCT and QFR, we propose here a novel approach that integrates CCTA and CAG images to calculate FFR (FFRCT-angio) with artificial intelligence assistance.
Materials and methods
Study population
This was a single-center retrospective study. Between April 2018 and September 2019, we consecutively included 50 stable CAD patients (≥ 18 years old) who had undergone 64-slice or higher CCTA as part of their diagnostic workup, followed by invasive CAG and preprocedural FFR to assess at least one intermediate lesion within 30 days. The definition of stable CAD followed the criteria of the latest guideline.[24] Coronary lesions with intermediate stenoses were defined as an angiographic diameter stenosis of 50%–90% on visual estimation. Patients were ineligible if they had acute coronary syndrome, severe liver or renal dysfunction, malignant tumor, severe heart failure, or severe arrhythmia. Angiographic exclusion criteria were as follows: ostial lesion, myocardial bridge, poor image quality, and previous stenting of the target vessel. As slow or no flow caused by microcirculatory dysfunction may affect the accuracy of coronary functional evaluation, only patients with Thrombolysis in Myocardial Infarction (TIMI) grade 3 were enrolled to exclude any influence of flow reduction on the results of our study. The decision for patients to undergo invasive CAG or FFR measurement was based on clinical information, response to therapy, and CCTA data, as well as noninvasive functional test results. The study protocol conforms to the ethical guidelines of the 1975 Declaration of Helsinki and was approved by the Ethics Committee of the First Affiliated Hospital of Harbin Medical University (No. 2021XS24-02). Informed consent was not required due to the retrospective nature of the study. The corresponding author has full access to all data of the study and takes full responsibility for the integrity of the data.
CAG image acquisition and FFR measurement
CAG was performed via either a transradial or a transfemoral approach. Only one end-diastolic frame with a clear vascular contour was selected for the 3D reconstruction of the target coronary artery. The contrast medium was injected at a steady and uniform speed of 4 mL/s. Angiographic images were recorded at 15 frames per second by a monoplane X-ray system (Innova GE; AlluraXper, Philips). The angiographic recording was started before contrast injection and lasted at least three cardiac cycles after the injection had stopped.
Invasive FFR was measured in intermediate stenoses according to the current guideline.[25] The RadiAnalyzer Xpress system and Certus pressure wires (St. Jude Medical, St. Paul, Minnesota) were used. Hyperemia was induced by intravenous adenosine injection at 140 μg/kg/min. The exact position of the pressure transducer was documented during angiography. Drift values < 0.02 for FFR values between 0.75 and 0.85 or < 0.04 for all other FFR values were required. Otherwise, the procedure was repeated. An FFR value ≤ 0.80 was considered to be associated with myocardial ischemia. In patients with two or more suspected ischemia-producing lesions, FFR was measured on each lesion of interest.
CCTA image acquisition
All patients underwent CCTA within 30 days before the invasive procedure. The CCTA images were acquired with 64-slice or higher detector row scanners (Philips or Siemens). The heart rate was controlled to be ≤ 70 bpm for 64-slice and ≤ 90 bpm for higher-slice scanners. Patients were given oral beta-blockers to achieve the target heart rate if necessary. Scan parameters for CCTA were as follows: detector collimation, 320×0.5 mm; tube current, 300–500 mA; tube voltage, 100–120 kV; gantry rotation time, 270 ms; and temporal resolution, 135 ms. Prospective electrocardiogram gating was used, covering 70%–99% of the R-R interval.
FFRCT-angio assessment
Figure 1 shows the FFRCT-angio flow chart. First, a 3D model reconstruction of the coronary vessel was performed using a hybrid approach that incorporates the advantages of CCTA and CAG while overcoming their limitations. Once the hybrid model was reconstructed, a deep learning-based approach with a sequential recurrent neural network was adopted to calculate FFR for the vessel.
Figure 1.

FFRCT-angio flow chart. CAG: coronary angiography; CCTA: coronary CT angiography; FFR: fractional flow reserve; 3D: three dimensional; 2D: two dimensional.
Hybrid 3D model reconstruction
The 3D model of the coronary vessel was reconstructed from CCTA and CAG images. The final reconstructed model was a set of connected circular cross sections, which consisted of vessel centerlines determined in CCTA images and vessel radii derived from CAG images. CCTA is considered to be a superior modality for extracting the centerlines without foreshortening and vessel overlap. Therefore, the centerlines were extracted from CCTA images using a proprietary software package (DEEPVESSEL; Keya Medical, China). The extracted centerlines provided accurate spatial information of the coronary anatomy and were used as the spatial “backbones” of the hybrid 3D reconstruction. CAG images taken from the same patient were used to provide the accurate radii for the 3D hybrid reconstruction, given that CAG offers better image quality and is less affected by calcification and plaque. First, a CAG image frame with distinguishable luminal contours of the target vessel was selected. A segmentation method similar to the U-Net deep learning neural network was used to extract the model and centerline of the target vessel. Vessel radii were then calculated by estimating smooth vessel contours at each centerline point. The mapping between CCTA and CAG domains had to be established, so that the radii estimated in CAG images could be transferred to the CCTA centerlines in the hybrid model. This was achieved by a two-dimensional (2D)–3D registration, which was an optimization problem to maximize the projection cost.[26] In the present study, the CCTA centerlines and vessels were first projected onto a 2D space by using a projection matrix built from the imaging parameters stored in CAG DICOM metadata. Intersection-over-union, defined as the ratio of the overlap region over the combined regions with 1 indicating a perfect match and 0 a failed match, between the projected CCTA and CAG vessel models was used as the optimization metric. After the optimization, the registration provided the mapping between the points of the two centerlines. The radii along the CAG centerline were then transferred to the 3D CCTA centerline using a distance-based linear interpolation method. The final result was a hybrid model with the overall spatial structure from the CCTA centerline and CAG-derived vessel radii. In addition to the radius estimation, CAG images were used to estimate the contrast flow velocity for the FFR simulation. The travel time of the contrast medium in the reconstructed vessel was calculated based on the TIMI frame count,[27] which is defined as the number of frames required for the contrast agent to travel from the inlet to the outlet of the selected vessel. The time interval between two adjacent frames was calculated based on the frame rate (15 frames per second in this study). The mean flow rate was calculated as the ratio of lumen volume of the reconstructed vessel and the mean travel time of the contrast medium.
FFRCT-angio calculation
Once the hybrid model had been constructed, a deep learning-based approach with a sequential recurrent neural network was adopted to calculate FFR for the vessel. The deep learning algorithm was trained on the data from a previous work, which was validated and published before.[28] More specifically, this algorithm comprised neural networks of each point along the vascular path, receiving the radius, flow velocity, and related features of these points as inputs and predicting the FFR value for each point of the vascular path as the output. The structure of the deep learning model consisted of a multilayer perceptron network (MLPN) and a bidirectional recurrent neural network (BRNN). The model not only considered the various features of the centerline points independently via the MLPN but also embedded the spatial relationships among all centerline points in the path of the coronary vessel via the BRNN. Thereby, it was capable of seamlessly integrating the information from the centerline points in the coronary artery to achieve an accurate prediction. To ensure the double-blind design, the person responsible for the FFRCT-angio calculations was blinded to the FFR results and was also excluded from participation in the invasive procedures.
Statistical analysis
The primary endpoint was the diagnostic accuracy of FFRCT-angio to identify a hemodynamically significant stenosis with FFR as the reference standard. Sensitivity, specificity, positive predictive value (PPV), and negative predictive value (NPV) of FFRCT-angio were also calculated. The diagnostic performance of FFRCT-angio was evaluated by the area under the receiver operating curve (AUC). Definitions of the above metrics are described in the publication by Baratloo et al.[29] Continuous data are presented as the mean ± standard deviation or median and interquartile range, and categorical data are presented as numbers and percentages. Spearman correlation analysis with 95% confidence intervals (CIs) was used to analyze the correlation between FFRCT-angio and FFR. Bland–Altman analysis was used to determine the agreement between FFRCT-angio and FFR.
Results
Patient and lesion characteristics
As shown in Figure 2, the final patient population after exclusions consisted of 67 vessels from 40 patients. Invasive FFR assessment detected the presence of a hemodynamically significant stenosis (FFR ≤ 0.80) in 25 vessels of 21 patients. The value of FFR ≤ 0.80 was found in 37.31% of all measurements, which is consistent with the results of a previous study.[20] Baseline and procedural characteristics of the patients are listed in Table 1.
Figure 2.
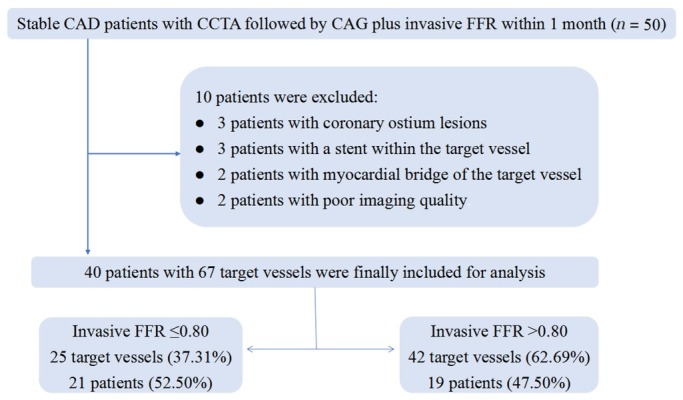
Flow diagram of the study. CAG: coronary angiography; CCTA: coronary CT angiography; FFR: fractional flow reserve; CAD: coronary artery disease.
Table 1.
Baseline and procedural characteristics of patients
| Parameters | Results |
|---|---|
| Age (y)* | 59.90 ± 7.25 |
| Female, n (%) | 21 (52.50) |
| Cardiovascular risk factors, n (%) | |
| Hypertension | 26 (65.00) |
| Diabetes mellitus | 17 (42.50) |
| Hyperlipidemia | 15 (37.50) |
| Smoking | 22 (55.00) |
| Left ventricular ejection fraction, %* | 63 ± 4 |
| Coronary angiography, n (%) | |
| Left anterior descending artery | 32 (47.76) |
| Diagonal branch | 4 (5.97) |
| Left circumflex artery | 10 (14.93) |
| Obtuse marginal | 1 (1.49) |
| Right coronary artery | 20 (29.85) |
| Bifurcation lesions | 5 (7.46) |
| Calcified lesions | 15 (22.39) |
| Diffuse lesions | 36 (53.73) |
| Proximal lesions | 27 (40.30) |
| Middle lesions | 27 (40.30) |
| Distal lesions | 13 (19.40) |
| FFR ≤ 0.80, n (%) | 25 (37.31) |
| FFR > 0.80, n (%) | 42 (62.69) |
Data are presented as the number of patients or the number of vessels with percentages in parentheses. *Data are presented as the mean ± standard deviation. FFR: fractional flow reserve.
Correlation and agreement between FFRCT-angio and FFR
Once all CCTA and CAG images had been acquired, the calculation of FFRCT-angio was very fast (120 ± 13 s) due to the deep learning-based approach, for which the complex computation had been done in the training stage. Our results showed a high degree of correlation (r = 0.81; P < 0.001) and agreement (mean difference: 0.03 ± 0.08, 95% limit of agreement: -0.12–0.19) between FFRCT-angio and FFR values (Figure 3). Representative cases are displayed in Figure 4. Clinical discordance of FFR > 0.80 and FFRCT-angio ≤ 0.80 occurred in five vessels, whereas there was no occurrence of FFR ≤ 0.80 and FFRCT-angio > 0.80.
Figure 3.

Correlation and agreement between FFRCT-angio and FFR. (A) Scatter plots of the Spearman analysis show a good correlation between invasive FFR and FFRCT-angio. (B) Bland–Altman plots illustrate the mean difference (solid line) between FFR and FFRCT-angio with 95% LoA (dashed lines). FFR: fractional flow reserve; FFR CT-angio: fractional flow reserve derived from integrated coronary CT angiography and invasive angiography; LoA: limit of agreement.
Figure 4.
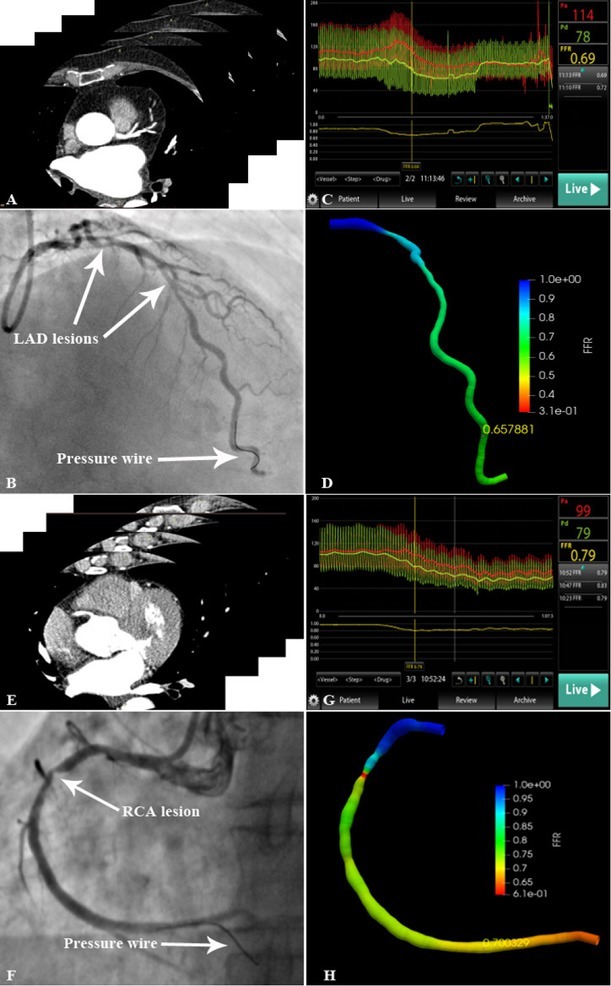
Representative lesions assessed by invasive FFR and FFRCT-angio (A) CCTA scan of LAD. (B) LAD lesion and pressure wire location are shown in the angiogram. (C) The FFR value measured using the pressure wire was 0.69. (D) 3D reconstruction of the LAD based on the integration of CAG and CCTA images. The FFRCT-angio value was highly correlated with the FFR value (FFRCT-angio = 0.66). (E) CCTA scan of RCA. (F) RCA lesion and pressure wire location are shown in the angiogram. (G) The FFR value measured using the pressure wire was 0.79. (H) 3D reconstruction of the RCA based on the integration of CAG and CCTA images. The FFRCT-angio value was highly correlated with the FFR value (FFRCT-angio = 0.70). CAG: coronary angiography; CCTA: coronary CT angiography; FFR: fractional flow reserve; LAD: left anterior descending artery; FFRCT-angio: fractional flow reserve derived from integrated CT angiography and invasive angiography; RCA: right coronary artery; 3D: three dimensional.
Diagnostic performance of FFRCT-angio
As demonstrated in Figure 5A, the AUC for determining significant flow-obstructive lesions on a per-vessel level was 0.95 for FFRCT-angio. Per-vessel diagnostic accuracy, sensitivity, specificity, PPV, and NPV of FFRCT-angio were 92.54% (95% CI 83.44%–97.53%), 100% (95% CI 86.28%–100%), 88.10% (95% CI 74.37%–96.02%), 83.33% (95% CI 65.28%–94.36%), and 100% (95% CI 90.51%–100%), respectively.
Figure 5.
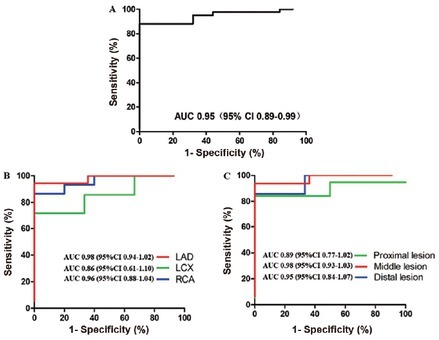
Diagnostic performance of FFRCT-angio. (A) Diagnostic performance of per-vessel level. (B) Diagnostic performance of different target vessels. (C) Diagnostic performance of different segments. AUC: area under receiver operating characteristics curve; CI: confidence interval; LAD: left anterior descending; LC: left circumflex artery; RCA: right coronary artery.
Diagnostic performance of FFRCT-angio in different target vessels and different segment lesions
Subgroup analyses showed that the diagnostic accuracy of FFRCT-angio in left anterior descending artery (LAD), right coronary artery (RCA), and left circumflex artery (LCX) were 96.88% (95% CI 83.78%–99.92%), 90.00% (95% CI 68.30%–98.77%), and 80.00% (95% CI 44.39%–97.48%), with AUC values of 0.98, 0.96, and 0.86, respectively (Figure 5B). Moreover, the diagnostic accuracy of FFRCT-angio in proximal, middle, and distal segments of the coronary artery were 88.89% (95% CI 70.84%–97.65%), 96.30% (95% CI 81.03%–99.91%), and 92.31% (95% CI 63.97%–99.81%), with AUC values of 0.89, 0.98, and 0.95, respectively (Figure 5C). Sensitivity, specificity, PPV, and NPV of FFRCT-angio in different target vessels and different segment lesions are listed in Table 2.
Table 2.
Diagnostic performance of FFRCT-angio with invasive FFR as the reference
| Metric | FFRCT-angio of different target vessels (95% CI) |
FFRCT-angio of different segments (95% CI) |
||||
|---|---|---|---|---|---|---|
| LAD | LCX | RCA | Proximal | Middle | Distal | |
| Sensitivity (%) | 100 (76.84–100) | 100 (29.24–100) | 100 (47.82–100) | 100 (63.06–100) | 100 (71.51–100) | 100 (54.07–100) |
| Specificity (%) | 94.44 (72.71– 99.86) | 71.43 (29.04– 96.33) | 86.67 (59.54– 98.34) | 84.21 (60.42– 96.62) | 93.75 (69.77– 99.84) | 85.71 (42.13– 99.64) |
| PPV (%) | 93.33 (68.05– 99.83) | 60.00 (14.66– 94.73) | 71.43 (29.04– 96.33) | 72.73 (39.03– 93.98) | 91.67 (61.52– 99.79) | 85.71 (42.13– 99.64) |
| NPV (%) | 100 (80.49–100) | 100 (47.82–100) | 100 (75.29–100) | 100 (79.41–100) | 100 (78.20–100) | 100 (54.07–100) |
| Target vessels (n) | 32 | 10 | 20 | 27 | 27 | 13 |
FFR: fractional flow reserve; PPV: positive predictive value; NPV: negative predictive value; CI: confidence interval; LAD: left anterior descending artery; LCX: left circumflex artery; RCA: right coronary artery.
Discussion
In this study, we demonstrated the feasibility and accuracy of FFRCT-angio as a novel technique to detect the hemodynamic significance of coronary stenoses. Vessel-level diagnostic accuracy of FFRCT-angio was 92.54% in stable CAD patients with invasive FFR as the reference standard, which was comparable to QFR in the FAVOR II China study and superior to FFRCT in the DISCOVER-FLOW study.[12,20] In addition, the sensitivity of FFRCT-angio was 100%, indicating that no false negatives occurred in this study. Subgroup analyses showed that the diagnostic performance of FFRCT-angio was satisfactory in different target vessels and various segment lesions. Furthermore, FFRCT-angio was determined in real time at the catheterization laboratory. The CCTA image was acquired before the CAG and was processed in advance to generate the centerlines, which then could be used as planning information for the invasive intervention at the catheterization laboratory.
Previous studies showed that FFR measurement changed the treatment plan in more than one-fifth of patients, and FFR-guided percutaneous coronary intervention (PCI) reduced major adverse cardiovascular event rates and avoided unnecessary stenting compared to angiography-guided PCI.[5,6, 30, 31, 32] Despite the benefits of FFR measurements, the additional time and costs of using pressure wires and the side effects associated with hyperemic agents prevent the wider use of this technique in routine practice. Therefore, there is an emerging transition from wire-based invasive FFR measurements to image-based computations.[33,34]
As a result, FFRCT and QFR were developed to address the issues of invasive FFR measurements. However, the accuracy of FFRCT is greatly influenced by plaque calcification and can drop to 75% in patients with coronary artery calcium scores ≥ 400.[16,35] A meta-analysis of 908 vessels in 536 patients showed that the overall diagnostic accuracy of FFRCT was only 81.9%.[36] For FFRCT values between 0.70 and 0.80, the diagnostic accuracy was reduced to 46.1%. Regarding QFR, high-quality images are required to accurately assess the functional significance of coronary stenoses, and two angiographic projections (at least 25° apart) of the target vessels are needed for the 3D reconstruction.[37] Accordingly, QFR may not be determined in complex lesions due to unclear coronary lumen contours, such as diffuse, tandem, calcified, and tortuous lesions, and it is not suitable for prior infarction-related or collateral donor arteries either.[23]
FFRCT-angio is a novel imaging approach that utilizes artificial intelligence to integrate the advantages of CCTA and CAG in the functional assessment of a coronary stenosis. First, the vessel centerline generated from CCTA is used as the spatial backbone, which is more reliable than the centerline reconstructed from 2D CAG images. On the other hand, CAG images display the accurate radii that form the vessel contour and provide the real blood flow to facilitate precise FFR calculations. This hybrid approach can ensure the correct vessel reconstruction by combining CCTA and CAG image data. Moreover, FFRCT-angio employs a deep learning algorithm based on artificial neural networks to evaluate the hemodynamic significance of a coronary stenosis. The deep learning algorithm establishes the mapping relationship between anatomical structure and physiological function and simultaneously calculates the FFR values for the entire coronary vessel.
As a data-driven model, the deep learning algorithm represents a new concept in the field of artificial intelligence. They are based on neural networks to simulate the human brain for the analysis of a large amount of data.[38] Compared to traditional methods, the deep learning algorithm is more efficient and time-saving.[39, 40, 41] The basic principle of FFRCT-angio is to directly learn the anatomical structure and functional information from images to derive the hemodynamic relevance of blood vessels. With increasing data volume, this data-driven approach can further improve its performance. By contrast, FFRCT and QFR are model-based approaches, and their performance will generally not improve as the data size increases. Additionally, the diagnostic performance of FFRCT-angio is not affected by severe calcification because only the centerline is extracted from CCTA images. More importantly, in this approach, only one angiographic projection with clear vascular contour is required for the 3D reconstruction, and it can complete the vessel reconstruction of tortuous lesions unsuitable for QFR measurements, thus expanding its clinical applications. For example, 5 of 67 target vessels in this study failed in the 3D reconstruction based on the 2D angiographic image due to obvious tortuosity or vessel overlap. With the integration of CCTA and CAG data, the 3D images of these five vessels were accurately reconstructed, and the FFRCT-angio value was subsequently calculated (Figure 6). As for the clinical use of FFRCT-angio, it should be applied to patients for which both CCTA and CAG data exist. CCTA has been recommended by guidelines in patients with stable CAD as the initial screening modality. If an ischemia-causing lesion was found, CAG would be needed to further clarify the severity of the stenosis. For such patients, CCTA and CAG images can be integrated to functionally assess the lesion by FFRCT-angio, thereby avoiding subsequent invasive FFR measurements.
Figure 6.
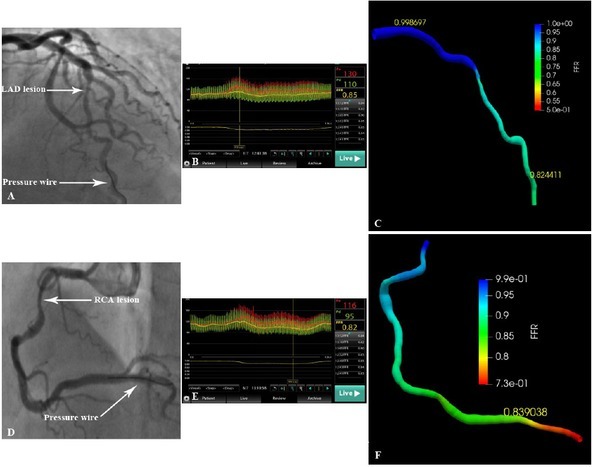
Reconstruction and hemodynamic assessment of coronary arteries with severe overlap or tortuosity by FFRCT-angio. (A) Inability to reconstruct the LAD using angiographic images due to severe vessel overlap. (B) The FFR value measured using the pressure wire was 0.85. (C) Successful reconstruction of the LAD and subsequent FFR calculation using the integration of CCTA and CAG images (FFRCT-angio = 0.82). (D) Inability to reconstruct the RCA using angiographic images due to severe tortuosity. (E) The FFR value measured using the pressure wire was 0.82. (F) Successful reconstruction of the RCA and subsequent FFR calculation using the integration of CCTA and CAG images (FFRCT-angio = 0.84). CAG: coronary angiography; CCTA: coronary CT angiography; FFR: fractional flow reserve; LAD: left anterior descending artery; FFRCT-angio: fractional flow reserve derived from integrated CT angiography and invasive angiography; RCA: right coronary artery.
Study Limitations
Patients with severe comorbidities were not included due to the need for repeat angiography and rewiring of target vessels. This technique may not be applicable in patients with previous stents, ostial stenoses or myocardial bridges in the target vessel, or poor image quality. Additionally, this was a pilot study to assess the feasibility and accuracy of FFRCT-angio as a novel technique, and only a relatively small number of patients were included. Therefore, the statistical power of this study does not allow a head-to-head comparison of FFRCT-angio with FFRCT or QFR. However, such comparisons will be performed in our future study with a larger number of patients.
Conclusions
FFRCT-angio exhibits excellent diagnostic performance of identifying ischemic lesions in patients with stable CAD. By combining CCTA and angiographic imaging with artificial intelligence assistance, FFRCT-angio may represent an effective and practical alternative to invasive FFR measurements in selected patients.
Footnotes
Source of Funding
This study was supported by research grants from the Heart Foundation of the Chinese Society of Cardiology (No. CSCF2020B01) and the Natural Science Foundation of Heilongjiang Province (No. LH2020H033).
Conflict of Interest
None declared.
Ethics Approval and Consent to Participate
The study was approved by the Ethics Committee of the First Affiliated Hospital of Harbin Medical University (No. 2021XS24-02). Informed consent was not required due to the retrospective nature of the study.
References
- 1.Pijls NH, De Bruyne B, Peels K, Van Der Voort PH, Bonnier HJ, Bartunek J. Measurement of fractional flow reserve to assess the functional severity of coronary-artery stenoses. N Engl J Med. 1996;334:1703–8. doi: 10.1056/NEJM199606273342604. et al. [DOI] [PubMed] [Google Scholar]
- 2.van Nunen LX, Zimmermann FM, Tonino PA, Barbato E, Baumbach A, Engstrøm T. Fractional flow reserve versus angiography for guidance of PCI in patients with multivessel coronary artery disease (FAME): 5-year follow-up of a randomised controlled trial. Lancet. 2015;386:1853–60. doi: 10.1016/S0140-6736(15)00057-4. et al. [DOI] [PubMed] [Google Scholar]
- 3.Parikh V, Agnihotri K, Kadavath S, Patel NJ, Abbott JD. Clinical Application of Fractional Flow Reserve-Guided Percutaneous Coronary Intervention for Stable Coronary Artery Disease. Curr Cardiol Rep. 2016;18:32. doi: 10.1007/s11886-016-0711-3. [DOI] [PubMed] [Google Scholar]
- 4.Tonino PA, De Bruyne B, Pijls NH, Siebert U, Ikeno F, van’ t Veer M. Fractional flow reserve versus angiography for guiding percutaneous coronary intervention. N Engl J Med. 2009;360:213–24. doi: 10.1056/NEJMoa0807611. et al. [DOI] [PubMed] [Google Scholar]
- 5.Pijls NH, Fearon WF, Tonino PA, Siebert U, Ikeno F, Bornschein B. Fractional flow reserve versus angiography for guiding percutaneous coronary intervention in patients with multivessel coronary artery disease: 2-year follow-up of the FAME (Fractional Flow Reserve Versus Angiography for Multivessel Evaluation) study. J Am Coll Cardiol. 2010;56:177–84. doi: 10.1016/j.jacc.2010.04.012. et al. [DOI] [PubMed] [Google Scholar]
- 6.De Bruyne B, Pijls NH, Kalesan B, Barbato E, Tonino PA, Piroth Z. Fractional flow reserve-guided PCI versus medical therapy in stable coronary disease. N Engl J Med. 2012;367:991–1001. doi: 10.1056/NEJMoa1205361. et al. [DOI] [PubMed] [Google Scholar]
- 7.Fearon WF, Nishi T, De Bruyne B, Boothroyd DB, Barbato E, Tonino P. Clinical Outcomes and Cost-Effectiveness of Fractional Flow Reserve-Guided Percutaneous Coronary Intervention in Patients With Stable Coronary Artery Disease: Three-Year Follow-Up of the FAME 2 Trial (Fractional Flow Reserve Versus Angiography for Multivessel Evaluation) Circulation. 2018;137:480–7. doi: 10.1161/CIRCULATIONAHA.117.031907. et al. [DOI] [PubMed] [Google Scholar]
- 8.Jeremias A, Kirtane AJ, Stone GW. A Test in Context: Fractional Flow Reserve: Accuracy, Prognostic Implications, and Limitations. J Am Coll Cardiol. 2017;69:2748–58. doi: 10.1016/j.jacc.2017.04.019. [DOI] [PubMed] [Google Scholar]
- 9.Jerabek S, Kovarnik T. Technical aspects and limitations of fractional flow reserve measurement. Acta Cardiol. 2019;74:9–16. doi: 10.1080/00015385.2018.1444951. [DOI] [PubMed] [Google Scholar]
- 10.Safian RD. Invasive fractional flow reserve: Which technology is best. Catheter Cardiovasc Interv. 2020;95:1102–3. doi: 10.1002/ccd.28912. [DOI] [PubMed] [Google Scholar]
- 11.Tu S, Bourantas CV, Nørgaard BL, Kassab GS, Koo BK, Reiber JH. Image-based assessment of fractional flow reserve. EuroIntervention. 2015 doi: 10.4244/EIJV11SVA11. Suppl V: V50-4. [DOI] [PubMed] [Google Scholar]
- 12.Koo BK, Erglis A, Doh JH, Daniels DV, Jegere S, Kim HS. Diagnosis of ischemia-causing coronary stenoses by noninvasive fractional flow reserve computed from coronary computed tomographic angiograms. Results from the prospective multicenter DISCOVER-FLOW (Diagnosis of Ischemia-Causing Stenoses Obtained Via Noninvasive Fractional Flow Reserve) study. J Am Coll Cardiol. 2011;58:1989–97. doi: 10.1016/j.jacc.2011.06.066. et al. [DOI] [PubMed] [Google Scholar]
- 13.Nørgaard BL, Leipsic J, Gaur S, Seneviratne S, Ko BS, Ito H. Diagnostic performance of noninvasive fractional flow reserve derived from coronary computed tomography angiography in suspected coronary artery disease: the NXT trial (Analysis of Coronary Blood Flow Using CT Angiography: Next Steps) J Am Coll Cardiol. 2014;63:1145–55. doi: 10.1016/j.jacc.2013.11.043. et al. [DOI] [PubMed] [Google Scholar]
- 14.Ko BS, Cameron JD, Munnur RK, Wong DTL, Fujisawa Y, Sakaguchi T. Noninvasive CT-Derived FFR Based on Structural and Fluid Analysis: A Comparison With Invasive FFR for Detection of Functionally Significant Stenosis. JACC Cardiovasc Imaging. 2017;10:663–73. doi: 10.1016/j.jcmg.2016.07.005. et al. [DOI] [PubMed] [Google Scholar]
- 15.Nakanishi R, Matsumoto S, Alani A, Li D, Kitslaar PH, Broersen A. Diagnostic performance of transluminal attenuation gradient and fractional flow reserve by coronary computed tomographic angiography (FFR(CT)) compared to invasive FFR: a sub-group analysis from the DISCOVER-FLOW and DeFACTO studies. Int J Cardiovasc Imaging. 2015;31:1251–9. doi: 10.1007/s10554-015-0666-2. et al. [DOI] [PubMed] [Google Scholar]
- 16.Abdulla J, Pedersen KS, Budoff M, Kofoed KF. Influence of coronary calcification on the diagnostic accuracy of 64-slice computed tomography coronary angiography: a systematic review and meta-analysis. Int J Cardiovasc Imaging. 2012;28:943–53. doi: 10.1007/s10554-011-9902-6. [DOI] [PubMed] [Google Scholar]
- 17.Nørgaard BL, Jensen JM, Blanke P, Sand NP, Rabbat M, Leipsic J. Coronary CT Angiography Derived Fractional Flow Reserve: The Game Changer in Noninvasive Testing. Curr Cardiol Rep. 2017;19:112. doi: 10.1007/s11886-017-0923-1. [DOI] [PubMed] [Google Scholar]
- 18.Tu S, Westra J, Yang J, von Birgelen C, Ferrara A, Pellicano M. Diagnostic Accuracy of Fast Computational Approaches to Derive Fractional Flow Reserve From Diagnostic Coronary Angiography: The International Multicenter FAVOR Pilot Study. JACC Cardiovasc Interv. 2016;9:2024–35. doi: 10.1016/j.jcin.2016.07.013. et al. [DOI] [PubMed] [Google Scholar]
- 19.Westra J, Andersen BK, Campo G, Matsuo H, Koltowski L, Eftekhari A. Diagnostic Performance of In-Procedure Angiography-Derived Quantitative Flow Reserve Compared to Pressure-Derived Fractional Flow Reserve: The FAVOR II Europe-Japan Study. J Am Heart Assoc. 2018;7:e009603. doi: 10.1161/JAHA.118.009603. et al. [DOI] [PMC free article] [PubMed] [Google Scholar]
- 20.Xu B, Tu S, Qiao S, Qu X, Chen Y, Yang J. Diagnostic Accuracy of Angiography-Based Quantitative Flow Ratio Measurements for Online Assessment of Coronary Stenosis. J Am Coll Cardiol. 2017;70:3077–87. doi: 10.1016/j.jacc.2017.10.035. et al. [DOI] [PubMed] [Google Scholar]
- 21.Spitaleri G, Tebaldi M, Biscaglia S, Westra J, Brugaletta S, Erriquez A. Quantitative Flow Ratio Identifies Nonculprit Coronary Lesions Requiring Revascularization in Patients With ST-Segment-Elevation Myocardial Infarction and Multivessel Disease. Circ Cardiovasc Interv. 2018;11:e006023. doi: 10.1161/CIRCINTERVENTIONS.117.006023. et al. [DOI] [PubMed] [Google Scholar]
- 22.Westra J, Tu S, Campo G, Qiao S, Matsuo H, Qu X. Diagnostic performance of quantitative flow ratio in prospectively enrolled patients: An individual patient-data meta-analysis. Catheter Cardiovasc Interv. 2019;94:693–701. doi: 10.1002/ccd.28283. et al. [DOI] [PubMed] [Google Scholar]
- 23.Emori H, Kubo T, Kameyama T, Ino Y, Matsuo Y, Kitabata H. Diagnostic Accuracy of Quantitative Flow Ratio for Assessing Myocardial Ischemia in Prior Myocardial Infarction. Circ J. 2018;82:807–14. doi: 10.1253/circj.CJ-17-0949. et al. [DOI] [PubMed] [Google Scholar]
- 24.Knuuti J, Wijns W, Saraste A, Capodanno D, Barbato E, Funck-Brentano C. ESC Guidelines for the diagnosis and management of chronic coronary syndromes. Eur Heart J 2020; 2019;41:407–77. doi: 10.1093/eurheartj/ehz425. et al. [DOI] [PubMed] [Google Scholar]
- 25.Toth GG, Johnson NP, Jeremias A, Pellicano M, Vranckx P, Fearon WF. Standardization of Fractional Flow Reserve Measurements. J Am Coll Cardiol. 2016;68:742–53. doi: 10.1016/j.jacc.2016.05.067. et al. [DOI] [PubMed] [Google Scholar]
- 26.Tang A, Scalzo F. Similarity Metric Learning for 2D to 3D Registration of Brain Vasculature. Adv Vis Comput. 2016;10072:3–12. doi: 10.1007/978-3-319-50835-1_1. [DOI] [PMC free article] [PubMed] [Google Scholar]
- 27.Gibson CM, Cannon CP, Daley WL, Dodge JT Jr, Alexander B Jr, Marble SJ. TIMI frame count: a quantitative method of assessing coronary artery flow. Circulation. 1996;93:879–88. doi: 10.1161/01.cir.93.5.879. et al. [DOI] [PubMed] [Google Scholar]
- 28.Gao Z, Wang X, Sun S, Wu D, Bai J, Yin Y. Learning physical properties in complex visual scenes: An intelligent machine for perceiving blood flow dynamics from static CT angiography imaging. Neural Netw. 2020;123:82–93. doi: 10.1016/j.neunet.2019.11.017. et al. [DOI] [PubMed] [Google Scholar]
- 29.Baratloo A, Hosseini M, Negida A, El Ashal G. Part 1: Simple Definition and Calculation of Accuracy, Sensitivity and Specificity. Emerg (Tehran) 2015;3:48–9. [PMC free article] [PubMed] [Google Scholar]
- 30.Layland J, Oldroyd KG, Curzen N, Sood A, Balachandran K, Das R. Fractional flow reserve vs. angiography in guiding management to optimize outcomes in non-ST-segment elevation myocardial infarction: the British Heart Foundation FAMOUS-NSTEMI randomized trial. Eur Heart J. 2015;36:100–11. doi: 10.1093/eurheartj/ehu338. et al. [DOI] [PMC free article] [PubMed] [Google Scholar]
- 31.Pijls NH, van Schaardenburgh P, Manoharan G, Boersma E, Bech JW, van’t Veer M. Percutaneous coronary intervention of functionally nonsignificant stenosis: 5-year follow-up of the DEFER Study. J Am Coll Cardiol. 2007;49:2105–11. doi: 10.1016/j.jacc.2007.01.087. et al. [DOI] [PubMed] [Google Scholar]
- 32.Xaplanteris P, Fournier S, Pijls N, Fearon WF, Barbato E, Tonino PAL. Five-Year Outcomes with PCI Guided by Fractional Flow Reserve. N Engl J Med. 2018;379:250–9. doi: 10.1056/NEJMoa1803538. et al. [DOI] [PubMed] [Google Scholar]
- 33.Tu S, Westra J, Adjedj J, Ding D, Liang F, Xu B. Fractional flow reserve in clinical practice: from wire-based invasive measurement to image-based computation. Eur Heart J. 2020;41:3271–9. doi: 10.1093/eurheartj/ehz918. et al. [DOI] [PubMed] [Google Scholar]
- 34.De Maria GL, Garcia-Garcia HM, Scarsini R, Hideo-Kajita A, Gonzalo López N, Leone AM. Novel Indices of Coronary Physiology: Do We Need Alternatives to Fractional Flow Reserve. Circ Cardiovasc Interv. 2020;13:e008487. doi: 10.1161/CIRCINTERVENTIONS.119.008487. et al. [DOI] [PubMed] [Google Scholar]
- 35.Nørgaard BL, Mortensen MB, Parner E, Leipsic J, Steffensen FH, Grove EL. Clinical outcomes following real-world computed tomography angiography-derived fractional flow reserve testing in chronic coronary syndrome patients with calcification. Eur Heart J Cardiovasc Imaging. 2021;22:1182–9. doi: 10.1093/ehjci/jeaa173. et al. [DOI] [PubMed] [Google Scholar]
- 36.Cook CM, Petraco R, Shun-Shin MJ, Ahmad Y, Nijjer S, Al-Lamee R. Diagnostic Accuracy of Computed Tomography-Derived Fractional Flow Reserve : A Systematic Review. JAMA Cardiol. 2017;2:803–10. doi: 10.1001/jamacardio.2017.1314. et al. [DOI] [PubMed] [Google Scholar]
- 37.Terentes-Printzios D, Oikonomou D, Gkini KP, Gardikioti V, Aznaouridis K, Dima I. Angiography-based estimation of coronary physiology: A frame is worth a thousand words. Trends Cardiovasc Med. 2021:S1050–738. doi: 10.1016/j.tcm.2021.07.004. et al. [DOI] [PubMed] [Google Scholar]
- 38.Tesche C, Gray HN. Machine Learning and Deep Neural Networks Applications in Coronary Flow Assessment: The Case of Computed Tomography Fractional Flow Reserve. J Thorac Imaging. 2020;35:S66–71. doi: 10.1097/RTI.0000000000000483. [DOI] [PubMed] [Google Scholar]
- 39.Dey D, Slomka PJ, Leeson P, Comaniciu D, Shrestha S, Sengupta PP. Artificial Intelligence in Cardiovascular Imaging: JACC State-of-the-Art Review. J Am Coll Cardiol. 2019;73:1317–35. doi: 10.1016/j.jacc.2018.12.054. et al. [DOI] [PMC free article] [PubMed] [Google Scholar]
- 40.Jang HJ, Cho KO. Applications of deep learning for the analysis of medical data. Arch Pharm Res. 2019;42:492–504. doi: 10.1007/s12272-019-01162-9. [DOI] [PubMed] [Google Scholar]
- 41.Jiang B, Guo N, Ge Y, Zhang L, Oudkerk M, Xie X. Development and application of artificial intelligence in cardiac imaging. Br J Radiol. 2020;93:20190812. doi: 10.1259/bjr.20190812. [DOI] [PMC free article] [PubMed] [Google Scholar]