

Summary
The UCLA ATLAS Community Health Initiative (ATLAS) has an initial target to recruit 150,000 participants from across the UCLA Health system with the goal of creating a genomic database to accelerate precision medicine efforts in California. This initiative includes a biobank embedded within the UCLA Health system that comprises de-identified genomic data linked to electronic health records (EHRs). The first freeze of data from September 2020 contains 27,987 genotyped samples imputed to 7.9 million SNPs across the genome and is linked with de-identified versions of the EHRs from UCLA Health. Here, we describe a centralized repository of the genotype data and provide tools and pipelines to perform genome- and phenome-wide association studies across a wide range of EHR-derived phenotypes and genetic ancestry groups. We demonstrate the utility of this resource through the analysis of 7 well-studied traits and recapitulate many previous genetic and phenotypic associations.
Keywords: electronic health records, biobanks, multi-ancestry, Global-Biobank Meta-analysis Initiative, GWAS, PheWAS
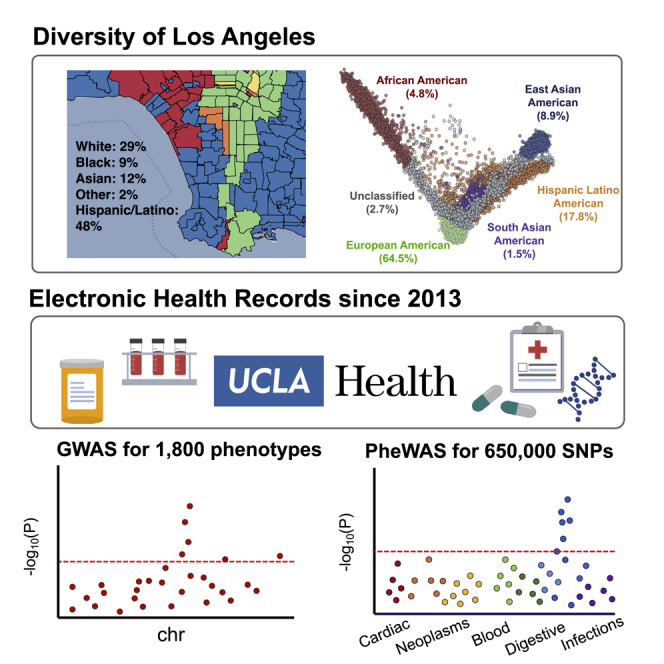
Graphical abstract
Highlights
-
•
UCLA ATLAS Community Health Initiative aims to genotype 150,000 participants
-
•
Electronic health record information is linked to participants’ genotype data
-
•
5 major continental genetic ancestry groups are represented in ATLAS
-
•
GWAS and PheWAS recapitulate known associations and offer insights into disease risk
Johnson et al. describe the UCLA ATLAS Community Health Initiative (ATLAS), which aims to recruit 150,000 participants from across the UCLA Health system and create one of the largest genomic databases linked to electronic health records. They describe the extensive ancestral diversity of the ATLAS cohort and demonstrate its utility as a biomedical resource for understanding the genetic basis of disease.
Introduction
The UCLA ATLAS Community Health Initiative (ATLAS), named for its location “at LA,” aims to recruit 150,000 participants from across the UCLA Health system, with the goal of creating California’s largest genomic resource for translational and precision medicine research. Each biosample is linked with the patient’s electronic health record (EHR) from UCLA Health via the UCLA Data Discovery Repository (DDR), a database containing de-identified versions of EHRs. Participants are recruited from 18 UCLA Health medical centers, laboratories, and clinics located throughout the greater Los Angeles area. Participants watch a short video outlining the goals of the initiative and document their choice of whether they wish to consent to participation.1,2 Biological samples are collected during routine clinical lab work performed at any UCLA Health laboratory and then genotyped using a customized Illumina Global Screening Array (GSA)3 (see STAR Methods).
Both biological samples and EHR information are de-identified to protect patient privacy. As of September 2021, the initiative has enrolled 90,400 participants through the consent process and successfully genotyped 39,300 samples. Comprehensive details on the biobanking and consenting processes are described in prior work.1,2 In this work, we describe quality control pipelines for genotype curation and phenotype extraction from the medical records for the purpose of large-scale genotype and phenotype scans. To establish the genotyping quality control (QC) pipelines, we present the first freeze of the data containing genotypes and phenotypes collected and processed up to September 2020, resulting in a total of N = 27,987 samples.
UCLA Health study population
The UCLA Health system includes 2 hospitals and a total of 210 primary and specialty outpatient locations located primarily in the greater Los Angeles area. In total, the UCLA Health system serves approximately 5% of Los Angeles County population. An electronic form of health records was implemented throughout the UCLA Health system in 2013, where a variety of clinical information is recorded, such as laboratory tests, medications and prescriptions, diagnoses, and hospital admissions. A version of this information has been de-identified and approved for research purposes. The de-identification process removes some clinical data including names, family relationships, geographic information, and exact dates, as well as exact ages for those at the extremes of age (>90 years old).
The average age of participants, defined as a participant’s age recorded in the EHR as of September 2021, is 55.6 (SD: 17.2) years with an average medical record length of 11.6 (SD: 8.5) years. We use phecodes, a coding system that maps diagnosis codes (i.e., ICD-9 and ICD-10 codes) to more clinically meaningful phenotypes4 to construct phenotypes from the EHR. The median number of unique phecodes per participant is 68, whereas the mean is 85.2 (SD: 65). This skewed mean is consistent with the presence of individuals with many more healthcare interactions than the average person in the general population, a pattern that has been well described in the literature.5
Participants’ self-identified race and ethnicity (SIRE) information is also recorded within the DDR, where participants select a single option for their race and a single separate option for their ethnicity from multiple-choice lists. The majority of patients in ATLAS self-identify as White race (61.4%) and Non-Hispanic/Latino ethnicity (75.4%), although a substantial proportion of individuals report being of an Asian race (9.67%) or of Hispanic/Latino, Spanish, or Mexican ethnicity (14.1%). A full list of the provided race/ethnicity fields within the DDR and a summary of the ATLAS demographic information can be found in Table 1.
Table 1.
Summary of UCLA ATLAS demographics
| ATLAS | ASTHMA | COPD | GOUT | HF | IPF | STROKE | VTE | ||
|---|---|---|---|---|---|---|---|---|---|
| Sample size | 27,946 | 4,702 | 2,927 | 1,342 | 2,212 | 1,139 | 1,402 | 2,543 | |
| Age (years) | 55.6 (17.2) | 55.8 (17.5) | 67.1 (14.1) | 66.3 (13.8) | 66.3 (15.8) | 65.2 (13.6) | 66.5 (15) | 60.6 (16.3) | |
| Self-reported sex (%) | male | 45.1 | 37.8 | 52.3 | 77.2 | 59.4 | 46.3 | 52.1 | 53.3 |
| female | 54.9 | 62.2 | 47.7 | 22.8 | 40.6 | 53.7 | 48 | 46.7 | |
| other, unknown, ∗unspecified, X | 0 | 0 | 0 | 0 | 0 | 0 | 0 | 0 | |
| Inferred biological sex (%) | male | 45.5 | 37.7 | 51.7 | 76.2 | 58.4 | 46 | 51.8 | 52.2 |
| female | 53.9 | 60.7 | 46.5 | 22.1 | 39.7 | 51.6 | 46.3 | 45.3 | |
| unknown | 0.6 | 0.5 | 0.3 | 0.5 | 0.5 | 0.6 | 0.9 | 0.6 | |
| Self-reported race (%) | White | 61.4 | 64.6 | 64.2 | 55.5 | 59 | 61.6 | 59.9 | 61.5 |
| Black, African American | 4.8 | 6.3 | 6.5 | 8.5 | 8.3 | 7 | 7.2 | 8 | |
| Asian, Asian Indian, Chinese, Filipino, Indonesian, Japanese, Korean, Pakistani, Thai, Pakistani, Taiwanese, Vietnamese, Asian-Other | 9.7 | 7.7 | 7.7 | 11.8 | 7.6 | 8.6 | 8.2 | 6.5 | |
| American Indian, Alaska Native | 0.3 | 0.4 | 0.3 | 0.3 | 0.3 | 0.6 | 0.6 | 0.3 | |
| Native Hawaiian, Guamian or Chamorro, Samoan, Other Pacific Islander | 0.3 | 0.5 | 0.2 | 0.5 | 0.5 | 0.6 | 0.4 | 0.4 | |
| other race | 12.9 | 10.9 | 9.8 | 10.5 | 13.8 | 12.7 | 12.2 | 14.6 | |
| unknown, declined to specify | 10.6 | 2.3 | 1.1 | 1.4 | 0.8 | 0.9 | 1.6 | 0.9 | |
| Self-reported ethnicity (%) | Non-Hispanic/Latino | 75.4 | 76.7 | 77.7 | 76.7 | 72.6 | 75.5 | 73.9 | 72.3 |
| Hispanic/Latino, Cuban, Hispanic/Spanish origin, Mexican, Mexican American, Chicano/a, Puerto Rican | 14.1 | 13.7 | 10.7 | 10.3 | 17.1 | 15.6 | 14.7 | 18.9 | |
| unknown, declined to specify | 10.5 | 2.3 | 1.2 | 1.5 | 0.6 | 0.8 | 1.6 | 1 | |
| Inferred genetic ancestry (%) | European continental ancestry | 64.5 | 63.4 | 67.4 | 59.6 | 57.7 | 61 | 60.4 | 57.7 |
| African continental ancestry | 4.8 | 6.5 | 6.7 | 8.5 | 8.1 | 7.1 | 7.4 | 8.2 | |
| admixed American continental ancestry | 17.8 | 17.5 | 13.9 | 14.1 | 20.6 | 19 | 19.3 | 23 | |
| East Asian continental ancestry | 8.9 | 7.1 | 7.7 | 12.4 | 7.4 | 8.1 | 7.8 | 6.1 | |
| South Asian continental ancestry | 1.5 | 1.5 | 0.8 | 1.1 | 1.4 | 1.6 | 1.1 | 1 | |
| admixed or other ancestry | 2.7 | 4.1 | 3.6 | 4.5 | 4.9 | 3.2 | 4.1 | 4 | |
| Medical record length (years) | 11.6 (8.5) | 13.12(8.5) | 13.4 (8.4) | 14.34 (8.3) | 13.2 (8.4) | 12.6 (8.1) | 13.3 (8.7) | 12.6 (8.3) | |
| Number of unique ICD codes | 86.7 (66.4) | 114.78 (76.5) | 149.4 (83.2) | 139.7 (84.1) | 164.7 (85.4) | 158.5 (81.2) | 148.1 (86.4) | 154.2 (87.4) | |
| Number of phenotypes (phecodes) | mean (SD) | 85.2 (65) | 114.75 (76.5) | 149.44 (83.2) | 139.7 (84.1) | 164.67(85.4) | 158.5 (81.2) | 148.1 (86.4) | 154.2 (87.4) |
| median | 68 | 97 | 138 | 123 | 157 | 151 | 138 | 141 |
We provide summary statistics describing the UCLA ATLAS population computed from data available in the electronic health records and genotype data. Results are computed over all N = 27,946 individuals from ATLAS as well as separately within each trait.
We regret that the term “White/Caucasian” is a preset multiple-choice option under the race field within the medical records. The scientific and medical communities have since denounced this specific terminology due to its erroneous origins and historically racist implications,6,7,8 but it is still built into the language of many documents and surveys, such as those within EHR systems. In presenting our analyses, we omit the inclusion of the term “Caucasian” when describing race and list the specific “White/Caucasian” field only as “White.” Furthermore, we strongly discourage the connection of the term “Caucasian” with the discussion of race, a social construct separate from biology, and emphasize that the term does not have any biological implications.
Genotype generation and QC
The ATLAS initiative continuously recruits new participants, and batches of genotype samples are being processed on a rolling basis in monthly installments of approximately 1,000 samples per batch. Genotyping was performed at the UCLA Neuroscience Genomics Core using a custom genotyping array constructed from the GSA with the multi-disease drop-in panel3 under the GRCh37 assembly. An additional set of “pathogenic” and “likely pathogenic” variants selected from ClinVar9 were additionally added to the chip design. The first freeze of genotype data presented in this work combines samples from 15 separate batches yielding a total of 697,023 SNPs and 27,987 individuals. Principal-component analysis (PCA)10 was used to visualize the variation across batches and did not show any evidence of batch effects (Figure S1).
We next describe the QC pipeline used to filter out low-quality SNPs and samples while also considering the diverse ancestral backgrounds represented in ATLAS. In this work, we aim to focus on describing only the common genetic variation and leave a further in-depth analysis of rare variation in ATLAS to future work as sample sizes continue to grow. First, we excluded poor-quality SNPs with >5% missingness as well as monomorphic SNPs and strand-ambiguous SNPs, defined as those with A/T or C/G alleles. Samples with >5% missingness were also removed. We estimated kinship coefficients using KING 2.2.211 and found 38 duplicate samples, 357 parent-offspring, 128 first-degree, and 166 second-degree relatives. This level of relatedness is not surprising since members of a family tend to attend the same health center. For the sets of duplicate samples, we removed the sample with the higher missing rate. A summary of the QC pipeline and the number of filtered SNPs and individuals is outlined in Figure 1. Following sample- and variant-level QC, M = 673,130 genotyped SNPs remained across N = 27,946 individuals (N = 27,291 unrelated individuals).
Figure 1.

Summary of genotype quality control pipeline
We outline the quality control pipeline for the genotype samples and list the number of excluded samples (left) and SNPs (right) at each step.
After genotyping QC, we inferred biological sex using the “--sex-check” function with default thresholds implemented in PLINK 1.9,12 which estimates the X chromosome homozygosity or F statistic (female: F < 0.20, male: F > 0.80). We find that 45.5% of genotypes yielded a male call and 53.9% a female call, while 0.6% of samples were estimated to be unknown (Table 1). For the group of individuals with unknown inferred sex, the mean F statistic was 0.27 (SD: 0.10). The sex of these individuals likely could not be inferred because the F statistics were slightly over the threshold. Next, using self-identified information from the EHRs, we find that 45.1% of individuals self-identify as male and 54.9% self-identify as female (Table 1). Within the EHRs, this specific field is labeled as “sex” and has a list of pre-determined multiple-choice fields where participants select one of the following options: “male,” “female,” “other,” “unknown,” “∗unspecified,” and “X.” The mean F statistics for individuals who self-identified as male and female were 0.96 (SD: 0.06) and 0.06 (SD: 0.09), respectively. There were not any individuals in the current data who self-identified as one of the other listed options. We also observe that 0.04% of individuals who were inferred to be biologically male do not self-identify as male as reported from the EHRs. This comparison is a common heuristic used to determine sample mismatch. However, this small deviation does not appear to reflect a systematic sample mismatch and instead could describe transgender and gender-non-conforming13 individuals. We retain these samples with appropriate documentation and encourage researchers utilizing the ATLAS data to perform further sex-based filtering based on their specific analysis criteria.
The final step of genotyping QC involves genotype imputation to the TOPMedFreeze5 reference panel, a multi-ancestry dataset assembled from over 50,000 ancestrally diverse genomes,14 using the Michigan Imputation Server.15 Overall, approximately 300 million SNPs and insertions or deletions (indels) were used as the backbone for genotype imputation. The imputation process yielded a total of 230 million imputed SNPs from the ATLAS data. We found that SNPs with a lower minor allele frequency (MAF) tended to have lower imputation quality (r2) scores. This demonstrates that rare SNPs were more difficult to accurately impute within ATLAS (Figure 2A), which is consistent with prior findings.16,17,18 Due to this observation, SNPs with imputation r2 <0.90 or MAF <1% were pruned from the data, leaving a total of 7.9 million well-imputed SNPs across 27,946 individuals for follow-up analyses (Figure 1).
Figure 2.

Genotyped and imputed data from ATLAS are of high quality
(A) The 230 million imputed SNPs stratified by minor allele frequency. SNPs are binned by the estimated imputation r2 scores, and then we report the percentage of remaining SNPs after applying the r2 threshold.
(B) The projected genetic PCs 1 and 2 of unrelated individuals in ATLAS (N = 27,291) in gray. Samples from 1000 Genomes are shaded by continental genetic ancestry: European (EUR), African (AFR), admixed American (AMR), East Asian (EAS), and South Asian (SAS).
(C) The QQ plots from the GWAS of gout across the AFR, AMR, EAS, and EUR continental ancestry groups within ATLAS.
Inferring genetic ancestry
The ATLAS data present a unique resource to study genomic medicine across an ancestrally diverse set of individuals within a single medical system. Genetic ancestry information is necessary for numerous types of genetic and epidemiological studies, such as genome-wide association studies and polygenic risk score estimation.19 Although the EHR contains self-identified demographic information such as race and ethnicity, these concepts are distinct from genetic ancestry, which describes the biological history of one’s genome with little to no relation to cultural aspects of identity.20,21 Previous studies have shown that self-identified race/ethnicity and genetic ancestry are correlated22,23; however, populations constructed from these two concepts are not analogous and capture distinct information. A more thorough discussion of the role of ancestry within the ATLAS data can be found in previous work.24
Instead, we use PCA to identify population structure in ATLAS solely from genetic information as means to correct for genetic stratification in large-scale genotype and phenotype association studies. PCA produces a visual summary of the observed genetic variation, which can then be used to describe population structure across samples. We performed PCA on a merged dataset consisting of individuals from ATLAS merged with individuals from the 1000 Genomes Project reference panel25 (see STAR Methods). This reference panel consists of genotypes from individuals of known European, African, admixed American, East Asian, and South Asian descent. After projecting the PCs into two-dimensional space, we use the labeled samples from 1000 Genomes to define cluster boundaries for individuals in ATLAS corresponding to each continental ancestry group (Figures 2B and S2). Cluster thresholds were visually determined by comparing the overlap of the 1000 Genomes reference panel samples with ATLAS samples in PC space. The first two PCs capture the variation between European, African, and East Asian ancestries (Figure S3). PCs 2 and 3 can approximately delineate individuals with admixed American ancestry (Figure S4), whereas PCs 4 and 5 can cluster individuals with South Asian ancestry (Figure S5). Individuals who fell into multiple ancestry groups or could not be classified into any of the defined ancestry groups were labeled as “admixed or other ancestry.”
We found that 64.5% (N = 18,023) of individuals were inferred to be of European ancestry; 4.8% (N = 1,340) of African ancestry; 17.8% (N = 4,930) of admixed American ancestry; 8.9% (N = 2,495) of East Asian ancestry; and 1.5% (N = 402) of South Asian ancestry; and 2.7% (N = 756) were characterized as “admixed or other ancestry” (Table 1). As expected, the inferred ancestry clusters were largely concordant with the SIRE information provided in the EHR: 90.5% of individuals within the European ancestry group self-identified as White; 92.1% of the African ancestry group self-identified as Black or African American; 90.4% of the East Asian ancestry group self-identified as an Asian race; and 77.6% of the admixed American ancestry group self-identified as either Hispanic or Latino, Puerto Rican, Mexican, or Cuban ethnicity (Table S1). We also observed that most individuals who self-identified as African American race tended to fall along the cline between the African and European ancestry clusters, demonstrating that genetic ancestry, in particular for admixed populations, often lies on a continuum rather than within discrete categorizations. These analyses demonstrate how the pairing between self-identified information and inferred genetic ancestry is not one to one, further emphasizing the important distinction between these two concepts.
EHR-based phenotyping through the phecode system
In this work, we utilized phenotypes derived from the EHR in the form of phecodes, a mapping of ICD codes to a collapsed set of more clinically descriptive groupings.4 Phecodes allow for systematic phenotyping across a large number of individuals for numerous clinical phenotypes and provide a level of consistency when collaborating across multiple institutions. Additionally, phecode mapping provides a list of control exclusion phecodes which typically excludes phecodes that are very similar to the case phecode but represent a distinct disorder. Using both ICD-9 and ICD-10 codes, we constructed 1,866 unique phecodes using a previously defined ICD-phecode mapping (Phecode Map 1.2),26 resulting in a binary phenotype where a patient is a case if the specific phecode occurs at least once within their medical record. Controls are defined as individuals without the occurrence of the case phecode. An additional, stricter definition of controls also restricts individuals with the occurrence of any phecode from the case phecode’s control exclusion list. This stricter definition was used in subsequent genome-wide association study (GWAS) analyses.
Out of all individuals in ATLAS (N = 27,946), over 99% of individuals had at least one phecode and 30.8% had over 100 distinct phecodes. Individuals without any phecodes could be those who may have gotten laboratory tests through UCLA Health but sought follow-up care at a different institution. The distribution of phecodes varies across different demographic groups in ATLAS. Older patients tended to have more phecodes, individuals ages 18 and under had an average of 57.38 (SD: 49.80) unique phecodes, and individuals over the age of 64 had an average of 109.98 (SD: 70.34) unique phecodes. We limited subsequent genetic analyses to phecodes with >100 cases in ATLAS, resulting in a total of 1,330 phecodes used for downstream association analyses.
To further demonstrate the potential of the phecodes in conjunction with genetic data, we focused on a set of 7 well-studied traits to illustrate the capability of EHR-linked biobanks: asthma, chronic obstructive pulmonary disease (COPD), gout, heart failure (HF), idiopathic pulmonary fibrosis (IPF), cerebral artery occlusion with cerebral infarction (stroke), and venous thromboembolism (VTE). A full list of corresponding phecodes and ICD codes describing these 7 traits is listed in Table S2. As shown in Figure 3, the prevalence of certain phecodes varies across sex, age, and genetic ancestry. For example, gout is observed at a much higher frequency in males compared with females (76.4% cases) and tends to be diagnosed in individuals over the age of 64 (59.8% cases). We also observe a high proportion of HF cases within the African ancestry group (freqAll = 0.044, freqAFR = 0.079; p = 2.4 × 10⁻⁶) and cases of gout within the East Asian ancestry group (freqAll = 0.048, freqEAS = 0.066; p = 8.0 × 10⁻⁴) compared with the prevalence across all individuals in ATLAS.
Figure 3.

Distribution of phenotypes across different demographic groups in ATLAS
We show the distribution of 7 traits across (A) sex, (B) age groups, and (C) inferred genetic ancestry. See Table S2 for the full phenotype descriptions. Sex information is derived from the EHRs.
Results
GWASs across 7 EHR-derived phenotypes and 4 ancestry groups
To demonstrate the utility of ancestrally diverse genetic data linked with EHR-based phenotypes, we performed GWASs for 7 well-studied traits within each of the 4 largest continental genetic ancestry groups in ATLAS, generating a total of 28 analyses (Data S1). Analyses within the South Asian ancestry group were excluded because of the current low sample sizes. We performed association testing using SAIGE,27 a generalized mixed-model approach that accounts for unbalanced case-control ratios as well as sample relatedness. Given that many disease phenotypes suffer from case-control imbalance, such as gout (Ncase = 810, Ncontrol = 15,831) and IPF (Ncase = 700, Ncontrol: 15,941) within the European ancestry group, SAIGE is an advantageous inference method for association testing in ATLAS. Self-identified sex (as reported in the EHRs) and current age (as of September 2021), as well as age∗age and age∗sex interaction terms, were used as covariates. Within each genetic ancestry group, we re-performed PCA and utilized the top 10 PCs as additional covariates as a way to further account for fine-scale population structure. Overall, GWAS associations were well calibrated and did not exhibit strong evidence of test statistic inflation as shown in Figure 2C (average across all 28 analyses: λGC = 0.98, SD(λGC) = 0.01). We found 26 genome-wide significant SNPs (p < 5 × 10⁻⁸) within the European ancestry group (gout, HF, VTE), 1 within the African ancestry group (asthma), and 8 within the admixed American ancestry group (gout, stroke), for a total of 35 significant SNPs across all analyses (Figure 4A; Table S3).
Figure 4.

GWASs across 7 traits and 4 continental ancestry groups recapitulate known associations
(A) We provide Manhattan plots from the GWAS of gout across the EUR, AFR, AMR, and EAS continental ancestry groups in ATLAS. The red dotted line denotes genome-wide significance (p < 5 × 10⁻⁸).
(B) We show the overlap of genome-wide significant regions for gout computed from ATLAS within the EUR ancestry group, previous associations listed in the GWAS Catalog, and associations identified in the GBMI meta-analysis.
(C) A scatterplot of GWAS effect sizes of SNPs associated with each trait in either ATLAS or BioVU at p < 1 × 10⁻⁶. Points are colored by trait. The red line shows the 45 degree line through the origin, and the blue line shows the estimated trend for these points (Pearson correlation = 0.92).
As an example emphasizing the potential of this dataset as a resource for expanding the genetic understanding of diverse ancestries, we highlight an association for gout on chromosome 1 found exclusively within the admixed American (AMR) group (rs1571498). This specific association has not been identified in any previous gout association studies. We replicated this association within the AMR group in a subsequent version of the ATLAS data with an increased sample size (NAMR = 6,073 individuals).24 A phenome-wide association study (PheWAS) within ATLAS at this SNP reveals associations with the “gout” and “gout and other crystal arthropathies” phenotypes exclusively within the AMR population as well, providing evidence of potential differences in genetic architecture between populations for gout risk.
We next compared the associated regions identified in ATLAS with those reported in previous studies, specifically those listed in the GWAS Catalog28 and the meta-analyses performed through the Global Biobank Meta-analysis Initiative (GBMI).29 To construct loci comparable across multiple studies, we created 1 Mb windows around each genome-wide significant association and compared the overlap of the specific loci across studies (see STAR Methods). Using this process, we found a total of 10 significantly associated regions in ATLAS across the 28 GWAS analyses. Out of these 10 regions, 7 were also reported both in the GWAS Catalog as well as in the GBMI meta-analyses (Figures 4B and S6). To avoid biasing our results, we used the GBMI summary statistics that were computed across all other contributing biobanks but omitted ATLAS data from the meta-analysis computation. Finally, when comparing the separate analyses for the 7 traits across the 4 ancestry groups in ATLAS, we did not find any significant associations occurring in multiple populations, though this observation could be due to the current limited sample sizes.
To further assess the congruence of genetic effects estimated in ATLAS to those from more mature EHR-linked biobanks with larger sample sizes, we compared GWAS effect sizes for the 7 traits between ATLAS and BioVU30 across the European ancestry group. Considering nominally significant SNPs associated with each trait with p < 1 × 10⁻⁶ in either study, we find a strong, significant positive correlation (Pearson correlation = 0.92, p < 2.2 × 10⁻¹⁶) between effect sizes in BioVU and ATLAS (Figure 4C). Although association statistics for the BioVU study were computed using PLINK 2.012 and association statistics for ATLAS were computed using SAIGE, it is encouraging that we observe a positive correlation despite the differences in association testing methods. As shown in Figure 4C, we see that the effects in ATLAS are slightly depressed toward the null, though this may reflect smaller sample sizes in ATLAS compared with BioVU.
PheWASs
EHR-linked biobanks also offer the opportunity to contextualize putative associations within the clinical phenome through PheWASs4 as well as provide a valuable step for validating phenotype QC. ATLAS has an extensive and diverse set of clinical phenotypes from non-ascertained cohorts, which is critical for performing unbiased phenome-wide association tests. We limited our analyses to phecodes with >100 cases within ATLAS, resulting in a total of 1,330 phecodes describing the clinical phenome at UCLA.
To demonstrate the utility of this diverse set of clinical phenotypes, we performed a PheWAS at rs6025, a missense variant within the F5 gene. This top variant was identified from the ATLAS GWAS of VTE in the European ancestry group and has been documented in many previous studies.31,32,33 We performed an association between rs6025 and 1,330 phecodes and found phenotypic associations with “iatrogenic pulmonary embolism and infarction” and “other venous embolism and thrombosis” (Figure S7), which are related phenotypes consistent with the current understanding of the pathophysiology of VTE and pulmonary embolisms.34 This demonstrates that despite modest sample sizes across many of the phenotypes, we can recapitulate findings consistent with expected disease biology, making PheWAS a valuable tool in investigating the shared genetic architecture across clinical traits. We also provide a web browser containing the PheWAS associations from ATLAS as a resource to the public (https://atlas-phewas.mednet.ucla.edu/).
Biobank contributions
The ancestral diversity represented in ATLAS plays a key role in cataloging the genetic variation used in precision medicine efforts. Despite its nascency, ATLAS has already contributed to many multi-ancestry disease mapping initiatives, such as the GBMI29 and COVID-19 Host Genetics Initiative35 (data freezes 5 and 7). Although ATLAS constitutes approximately 1% of the total sample size for the GBMI meta-analysis (N = 27,946 samples out of approximately 2.6 million total GBMI samples), we observe a large contribution of samples from diverse ancestral populations within ATLAS to GBMI. For example, ATLAS contributes larger proportions of the African (AFR; range of proportions across 7 traits: 3%–14%) and AMR ancestry (22%–32%) samples when compared with the total sample size in GBMI (Table 2). In addition to GBMI, ATLAS accounted for 73.4% of the AMR samples utilized in the primary analysis from the COVID-19 Host Genetics Initiative.35 This enrichment of AFR and AMR samples from ATLAS can facilitate meta-analytic disease mapping in these historically underrepresented populations and expand the genetic understanding of diverse ancestries.
Table 2.
UCLA ATLAS contributes a substantial proportion of non-European ancestry samples to global meta-analyses
| Trait | Abbreviation | Ancestry | UCLA case | GBMI case | Enrichment ratio |
|---|---|---|---|---|---|
| Asthma | asthma | EUR | 3,051 | 101,311 | 1.04 |
| AFR | 289 | 5,051 | 1.97 | ||
| AMR | 760 | 4,069 | 6.42 | ||
| EAS | 308 | 18,549 | 0.57 | ||
| Chronic obstructive pulmonary disease | COPD | EUR | 2,005 | 51,644 | 1.14 |
| AFR | 187 | 1,978 | 2.77 | ||
| AMR | 384 | 1,503 | 7.49 | ||
| EAS | 208 | 19,044 | 0.32 | ||
| Gout | gout | EUR | 810 | 20,702 | 1.16 |
| AFR | 105 | 1,312 | 2.38 | ||
| AMR | 179 | 557 | 9.55 | ||
| EAS | 155 | 10,425 | 0.44 | ||
| Heart failure | HF | EUR | 1,301 | 28,795 | 1.51 |
| AFR | 174 | 1,367 | 4.26 | ||
| AMR | 423 | 1,170 | 12.11 | ||
| EAS | 144 | 12,665 | 0.38 | ||
| Idiopathic pulmonary fibrosis | IPF | EUR | 700 | 5,229 | 1 |
| AFR | 76 | 169 | 3.37 | ||
| AMR | 204 | 319 | 4.79 | ||
| EAS | 89 | 1,210 | 0.55 | ||
| Cerebral artery occlusion with cerebral infarction | stroke | EUR | 855 | 15,842 | 2.48 |
| AFR | 100 | 1,161 | 3.96 | ||
| AMR | 248 | 903 | 12.64 | ||
| EAS | 105 | 23,345 | 0.21 | ||
| Venous thromboembolism | VTE | EUR | 1,503 | 15,970 | 1.11 |
| AFR | 195 | 1,466 | 1.57 | ||
| AMR | 543 | 1,037 | 6.18 | ||
| EAS | 132 | 193 | 8.07 |
We show the case sample sizes across 7 traits for ATLAS and across the entire GBMI study, stratified by genetic ancestry. The last column reports the ratio of the proportion of ancestry-specific samples in ATLAS compared with the proportion of total samples from the GBMI meta-analyses.
Discussion
The ATLAS biobank provides a valuable resource for the biomedical community with numerous future opportunities. In the future, we aim to perform phenotyping composed of EHR elements in addition to diagnosis codes, such as laboratory values, medications, and clinical notes. We also plan to incorporate additional types of genomic information such as exome sequencing and methylation data. Furthermore, although this analysis focused on describing only common variants, we plan to investigate the rare variants in ATLAS as sample sizes continue to grow. We hope that the inclusion of rare variants in both GWASs and PheWASs can increase our power to detect novel associations as well as explore more ancestry-specific effects. We hope to also leverage the typed ClinVar variants to examine the role of genetic ancestry in pathogenic and likely pathogenic variants. Additionally, we plan to create a catalog of polygenic risk score (PRS) weights for EHR-derived phenotypes across each genetic ancestry group, creating one of the largest and most ancestrally diverse PRS resources.
Limitations of the study
Although the UCLA ATLAS Community Health Initiative is still growing and developing, our presented analyses have inherent limitations. First, we are greatly limited by the current sample sizes, which lead to a lack of power in some association studies, such as those with rare variants. This lack of sample size is most pronounced in non-European ancestry groups in ATLAS. In particular, downstream analyses within the South Asian ancestry group had to be omitted due to a lack of adequate sample size. At the goal sample size of N = 150,000 individuals (across all of ATLAS), we hope to uncover novel associations for both common and rare variants. Second, within the current EHR, we lack information describing individuals’ socioeconomic status. This information is imperative in disentangling true genetic effects versus those induced by the environment. Third, this study derives phenotypes from ICD-9 and ICD-10 codes, which were designed for billing as opposed to representing formal diagnoses. The creation of phecodes aimed to alleviate many shortcomings associated with using ICD codes directly but cannot fully address the impreciseness inherently associated with billing code assignment. For example, different billing practices across departments may cause inconsistencies in phenotyping. In this work, we present broad genetic analyses across a set of well-studied diseases, but for more in-depth disease-specific studies, we recommend the construction of more detailed phenotyping beyond billing codes. Finally, although ATLAS provides an opportunity to explore ancestral diversity, our analyses are also limited by the availability and choice of reference panels used when inferring genetic ancestry. Although the 1000 Genomes reference panel includes 5 major continental ancestry groups, there are notable samples absent from many regions, including the Middle East and indigenous Native American populations. This could inhibit our ability to perform genetic ancestry inference for these individuals in ATLAS, causing them to be excluded from some downstream ancestry-stratified analyses. In future work, we hope to include more reference panel populations to better characterize the genetic diversity in ATLAS.
STAR★Methods
Key resources table
| REAGENT or RESOURCE | SOURCE | IDENTIFIER |
|---|---|---|
| Critical commercial assays | ||
| Infinium Global Screening Array-24 Kit | Infinium Global Screening Array-24 Kit3 | https://www.illumina.com/products/by-type/microarray-kits/infinium-global-screening.html |
| Deposited data | ||
| UCLA ATLAS PheWeb | Johnson et al.24 | https://atlas-phewas.mednet.ucla.edu/ |
| 1000 Genomes Project (phase 3, hg19) | 1000 Genomes Project Consortium et al.25 | http://ftp.1000genomes.ebi.ac.uk/vol1/ftp/phase3/ |
| TOPMed (freeze 5) | Taliun et al.14 | https://imputation.biodatacatalyst.nhlbi.nih.gov/#! |
| Phecode Map 1.2 | Denny et al.26 | https://phewascatalog.org/phecodes |
| Software and algorithms | ||
| Michigan Imputation Server | Das et al.15 | https://imputationserver.sph.umich.edu/index.html#! |
| Eagle v2.4 | Loh et al.36 | https://alkesgroup.broadinstitute.org/Eagle/ |
| minimac4 | Fuchsberger et al.37 | https://genome.sph.umich.edu/wiki/Minimac4 |
| FlashPCA 2.0 | Abraham et al.38 | https://github.com/gabraham/flashpca |
| PLINK 1.9 | Chang et al.12 | https://www.cog-genomics.org/plink/ |
| SAIGE v0.44.6.5 | Zhou et al.27 | https://github.com/weizhouUMICH/SAIGE |
Resource availability
Lead contact
Further information and requests for resources should be directed to and will be fulfilled by the lead contacts, Ruth Johnson (ruthjohnson@g.ucla.edu).
Materials availability
This study did not generate new unique reagents.
Method details
Study population
The UCLA Health System includes 2 hospitals (520 and 281 inpatient beds) and a total of 210 primary and specialty outpatient locations located primarily in the greater Los Angeles area. The UCLA Data Discovery Repository (DDR) contains de-identified patient EHRs collected since March 2, 2013, under the auspices of the UCLA Health Office of Health Informatics Analytics and the UCLA Institute of Precision Health. The DDR contains longitudinal EHRs for basic patient demographic information (e.g. self-identified race/ethnicity, age, sex), vital signs (e.g. blood pressure, body temperature), diagnosis codes (ICD-9, ICD-10), laboratory test orders and results (e.g. LOINC codes), encounters, provider information, medications and prescriptions, and hospital admission information.
Recruitment and consent
UCLA patients are recruited from 18 UCLA Health medical centers and clinics throughout the greater Los Angeles area where any patient ages 18 and older is allowed to participate. Patients have the opportunity to watch a video outlining the goal of the initiative and can choose to complete the Universal Consent on a provided iPad. The universal video consent is also available in the following languages: Spanish, Farsi, Arabic, Mandarin, and Korean. Previous works describing the pilot cohort study assessing electronic video consent and its implementation are described in separate works.1,2 Once consent is completed, samples will be extracted from leftover biological samples (blood, saliva) from a current or future laboratory test or during an IV placement. Patients also have the opportunity to opt-in to receive actionable results from future genetic testing. Participants can revoke their consent at any time and their samples will be removed from future research. Patient Recruitment and Sample Collection for Precision Health Activities at UCLA is an approved study by the UCLA Institutional Review Board (UCLA IRB) IRB#17–001013. This study conforms with the Declaration of Helsinki.39 Additional details on Universal Consent and participation can be found at (https://www.uclahealth.org/precision-health/programs/ucla-atlas-community-health-initiative).
Genotype generation and quality control
Genotyping was performed at the UCLA Neuroscience Genomics Core using a custom genotyping array constructed from the Global Screening Array with the multi-disease drop-in panel3 under the GRCh37 assembly. Future batches will be genotyped according to the GRCh38 assembly and previous batches will be lifted over to the more recent assembly. An additional set of “Pathogenic” and “Likely Pathogenic” variants selected from ClinVar,9 such as the key SNPs found in the ACMG 59 genes,40 were also included in the chip design. Overall, the array measures 700,079 sites for capturing single nucleotide polymorphisms (SNPs) and short insertions and deletions (indels). Additional details regarding the array design are available on the Global Screening Array + Multi Disease SNP UCLA browser (https://coppolalab.ucla.edu/gclabapps/ungc/home).
Currently, quality control is performed over the entire dataset at approximately the intervals of 25K samples, 50K, 75K, etc. First, we remove all individuals that have withdrawn their consent. Additionally, samples with >5% missingness are removed. SNPs are removed based on the following criteria: >5% missingness, monomorphic SNPs, or strand ambiguity (A/T or C/G alleles). Next, we detect duplicate samples through kinship coefficients estimated from KING 2.2.211 (--duplicate). We use the software default kinship coefficient threshold for defining duplicates (>0.354). In the case of duplicate samples, the sample with the highest missing rate is removed.
Biological sex is inferred using the ‘--sex-check’ option implemented in PLINK 1.9. This estimates the X chromosome homozygosity or F statistic. Calls are made according to the default F statistic thresholds where F < 0.20 is inferred as Female, F > 0.80 is inferred as Male, and values in between are reported as unknown. We compare the inferred biological sex with self-identified sex found within the EHR to assess for systematic sample mismatch. Given that only a small proportion (<<1%) of samples are discordant, this is not indicative of widespread error and thus we choose not to remove these samples.
Imputation
Imputation was performed using the Michigan Imputation Server (Das et al., 2016). First, SNPs that were not an A, C, G, or T allele were discarded. Additionally, indels, duplicate SNPs, and alleles that did not match between the reference panel and the target ATLAS data were removed. Haplotype phasing was performed using Eagle v2.436 and imputation was performed using minimac4.37 Both phasing and imputation was performed using the TOPMedFreeze5 reference panel14 which was the most recent panel at the time. As updated reference panels become available, imputation procedures will be performed using the most up-to-date panel. This process produced approximately 230 million imputed SNPs within the ATLAS data. We used the ‘Rsq’ metric produced by minimac4, an empirical estimate of the squared correlation between imputed genotypes and unobserved genotypes, to assess per-SNP imputation quality. We filtered SNPs by Rsq >0.90 and MAF >1%, leaving a total of 7.9 million high-quality SNPs.
Genetic ancestry inference
First, we filtered to only include unrelated (up to 2nd degree) individuals in ATLAS (N = 27,291). Genotypes were filtered by Mendel error rate, founders, MAF <15%, and Hardy-Weinberg equilibrium test (p value <0.001). Genotypes were then merged with the 1000 Genomes dataset and LD pruning was performed on the merged dataset, leaving a total of 253,022 SNPs for the PCA analysis. The top 10 PCs were then computed using the FlashPCA 2.038 software with default parameters. We project the PCs into 2-dimensional space and use the “Superpopulation” labels from the individuals in 1000 Genomes to define cluster boundaries. Cluster thresholds were visually determined by comparing the overlap of the 1000 Genomes reference panel samples to ATLAS samples in PC space (Figures S3, S4 and S5). Individuals who fell into multiple ancestry groups or could not be classified into any of the defined ancestry groups were labeled as ‘Admixed or other ancestry’.
Clinical phenotype data
Phenotypes were derived from the EHR in the form of phecodes(Denny et al., 2013). We utilized the Phecode Map 1.2 to map ICD-9 and ICD-10 codes to a set of 1,866 unique phecodes. For each trait, the phecode map defines a set of phecodes used as exclusion criteria when labeling controls. Phecodes on the exclusion list are typically phenotypes that are similar to the trait of interest but represent distinct disorders. We define dichotomous traits for GWAS by labeling an individual as a case if they have a given phecode at least once within their medical record. Controls were defined as any individual without the given phecode and did not have any one of the phecodes specified on the control exclusion list for that trait. The phecode map used in these analyses can be found at (https://phewascatalog.org/phecodes).26
Genome-wide association studies
First, we stratified individuals by genetic ancestry groups and then performed an additional level of QC separately within each ancestry group. We limited analyses to the subset of 27,291 unrelated individuals (>second degree) and performed ancestry inference (see ‘genetic ancestry inference’), where each individual was assigned to one continental genetic ancestry cluster: European (N = 18,023), African (N = 1,340), Admixed American (N = 4,930), East Asian (N = 2,495), and South Asian ancestry (N = 402). At this time, we omitted GWAS analyses within the South Asian ancestry group due to the limited sample size. Individuals who could not be clustered into a specific genetic ancestry group (N = 756) were also omitted from GWAS analyses.
Within each ancestry group, samples identified as heterozygosity outliers (+/− 3 SDs from the mean) were removed, and SNPs that failed the Hardy-Weinberg equilibrium test (p value < 1 × 10⁻¹²) were also removed. Finally, we limited analyses to only SNPs with MAF >1% within each ancestry group, yielding a total of N = 17,874 individuals and M = 6.9 million SNPs within the European ancestry group, N = 1,337 individuals and M = 6.6 million SNPs within the African group, N = 4,776 and M = 7.2 million SNPs within the Admixed American group, and N = 2,459 individuals and M = 5.4 million SNPs within the East Asian group. We performed association tests using the SAIGE software with default settings. We used self-identified sex, current age, and age∗age and age∗sex interaction terms as covariates. We recomputed PCs within each ancestry group and used PCs 1–10 as covariates in each respective ancestry analysis. Genome-wide significance was determined using a p value <5 × 10⁻⁸ threshold.
Comparison of GWAS associations with prior work
To construct regions comparable across all of the studies for a given trait, we performed the following procedure. First, we aggregated all SNPs that reached genome-wide significance in at least one of the datasets (i.e. ATLAS, GBMI meta-analyses, GWAS Catalog). We then performed a greedy approach by selecting the most significant SNP and created a 1Mb window (500Kb on each side) around this top SNP. All other genome-wide significant SNPs within this window were removed from the list and this procedure was performed until all significant SNPs were accounted for within a region. We defined an individual GWAS for a trait as having a significantly associated region if at least one genome-wide significant SNP fell into one of the constructed regions. Using this process, we found a total of 10 significantly associated regions in ATLAS across the 28 GWAS analyses.
Phenome-wide association studies
We performed association tests between 650,000 typed SNPs and all phecodes with >100 cases within ATLAS, resulting in 1,330 phecodes. Cases were defined as any individual with the presence of the given phecode. Controls were defined as individuals without the given phecode; we did not choose to use the control exclusion list when constructing controls for the PheWAS analysis. Association tests were performed within each genetic ancestry group separately. Age, sex, and ancestry-specific PCs 1–10 were included as covariates in the model. The association tests were performed using the logistic regression option implemented in PLINK (“plink --logistic beta”). We opted to use PLINK over the SAIGE software due to the faster runtime of PLINK given the large number of association tests. We have provided all PheWAS associations with p value >0.50 on the ATLAS PheWeb browser (https://atlas-phewas.mednet.ucla.edu/).
Quantification and statistical analysis
Sample sizes, self-identified and biological sex, self-identified race/ethnicity, inferred genetic ancestry, and medical record length characteristics across the entire ATLAS cohort population and for each of the 8 tested phenotypes are available in Table 1. The list of SNPs meeting genome-wide significance threshold of p value < 5 × 10⁻⁸ in each GWAS is available in Table S3.
To compare the estimated GWAS effect sizes between ATLAS and BioVu, we considered only nominal SNPs that passed a threshold of p value < 1 × 10⁻⁶. We determined the overall relationship between the effect sizes through Pearson correlation and used a threshold of p value < 0.05 to assess significance.
In Table 2, we show the enrichment ratio of ancestry-specific samples in ATLAS compared to GBMI sample sizes. Computing the ratio for the enrichment of African ancestry samples in ATLAS is computed as the following:
Here, NATLAS-AFR is the sample size of African ancestry individuals in ATLAS for a given phenotype and NGBMI-AFR is the same value computed in the GBMI cohort. NATLAS-ALL is the sample size of all ancestries combined in ATLAS for a given phenotype and NGBMI-ALL is the same value computed in the GBMI cohort. This is then repeated for each ancestry group across all 8 phenotypes.
Acknowledgments
We gratefully acknowledge the resources provided by the Institute for Precision Health (IPH) and participating UCLA ATLAS Community Health Initiative patients. The UCLA ATLAS Community Health Initiative in collaboration with UCLA ATLAS Precision Health Biobank is a program of IPH, which directs and supports the biobanking and genotyping of biospecimen samples from participating UCLA patients in collaboration with the David Geffen School of Medicine, UCLA CTSI, and UCLA Health. Additionally, we greatly acknowledge Brett Vanderwerff, Sinéad Chapman, and Benjamin Neale for their insightful feedback as well as all of the members of the GBMI. The ATLAS Community Health Initiative is supported by UCLA Health, the David Geffen School of Medicine, and a grant from the UCLA Clinical and Translational Science Institute (UL1TR001881). A.C. is funded by NIH - T32HG002536 and NSF - DGE-1829071. R.J. is funded by NSF - DGE-1829071.
Author contributions
Conceptualization was performed by B.P., R.J., and A.B. Methodology was performed by R.J., Y.D., A.B., and A.C. Software was constructed by R.J., Y.D., and S.K. The formal analysis was performed by R.J., Y.D., and A.B. Data curation was performed by A.C. and R.J. Writing the original draft was performed by R.J. and A.B. Review and editing of the draft was performed by B.P. and D.H.G. Project administration was performed by B.P., C.L., and D.H.G. All authors read and approved the final manuscript.
Declaration of interests
The authors declare no competing interests.
Inclusion and diversity
We support inclusive, diverse, and equitable conduct of research.
Published: January 11, 2023
Footnotes
Supplemental information can be found online at https://doi.org/10.1016/j.xgen.2022.100243.
Contributor Information
Ruth Johnson, Email: ruthjohnson@g.ucla.edu.
Bogdan Pasaniuc, Email: pasaniuc@g.ucla.edu.
Supplemental information
Document S1. Figures S1–S7 and Data S1
Table S1: Genetic ancestry groups in ATLAS stratified by self-identified race/ethnicity, related to Table 1
We show the sample sizes of each genetic ancestry group in ATLAS stratified by self-identified race/ethnicity. Individuals who could not be assigned a genetic ancestry group are labeled as “Admixed or other ancestry”
Table S2: Phecode and ICD codes for 7 EHR-derived phenotypes, related to STAR Methods
We list the phecodes and corresponding ICD-9 and ICD-10 codes used for defining cases and controls in each GWAS analysis for 7 traits. Phecodes are obtained from phecode mapping v1.2
Table S3: List of genome-wide significant SNPs, related to Figure 4
We list all SNPs that pass the genome-wide significance threshold (p value < 5 ×10⁻⁸) for each trait and ancestry group. There were no significant associations identified for any of the traits within the East Asian ancestry group, and they are therefore not listed in the table. Association studies were not performed within the South Asian ancestry group due to low sample sizes
Document S2. Transparent peer review record for Johnson et al.
Document S3. Article plus supplemental information
Data and code availability
-
•
Individual-level genotype and electronic health record data utilized in this study cannot be deposited in a public repository because of privacy regulations. GWAS summary statistics are made available on the UCLA ATLAS PheWeb browser (https://atlas-phewas.mednet.ucla.edu/).
-
•
This paper does not report original code.
References
- 1.Lajonchere C., Naeim A., Dry S., Wenger N., Elashoff D., Vangala S., Petruse A., Ariannejad M., Magyar C., Johansen L., et al. An integrated, scalable, electronic video consent process to power precision health research: large, population-based, cohort implementation and scalability study. J. Med. Internet Res. 2021;23:e31121. doi: 10.2196/31121. [DOI] [PMC free article] [PubMed] [Google Scholar]
- 2.Naeim A., Dry S., Elashoff D., Xie Z., Petruse A., Magyar C., Johansen L., Werre G., Lajonchere C., Wenger N. Electronic video consent to power precision health research: a pilot cohort study. JMIR Form. Res. 2021;5:e29123. doi: 10.2196/29123. [DOI] [PMC free article] [PubMed] [Google Scholar]
- 3.Infinium Global Screening Array-24 Kit.
- 4.Denny J.C., Ritchie M.D., Basford M.A., Pulley J.M., Bastarache L., Brown-Gentry K., Wang D., Masys D.R., Roden D.M., Crawford D.C. PheWAS: demonstrating the feasibility of a phenome-wide scan to discover gene-disease associations. Bioinformatics. 2010;26:1205–1210. doi: 10.1093/bioinformatics/btq126. [DOI] [PMC free article] [PubMed] [Google Scholar]
- 5.Characterization of high healthcare utilizer groups using administrative data from an electronic medical record database | BMC Health Serv. Res. | Full Text https://bmchealthservres.biomedcentral.com/articles/10.1186/s12913-019-4239-2. [DOI] [PMC free article] [PubMed]
- 6.Flanagin A., Frey T., Christiansen S.L., Bauchner H. The reporting of race and ethnicity in medical and science journals: comments invited. JAMA. 2021;325:1049–1052. doi: 10.1001/jama.2021.2104. [DOI] [PubMed] [Google Scholar]
- 7.Popejoy A.B. Nat. Publ. Group; UK: 2021. Too Many Scientists Still Say Caucasian. [Google Scholar]
- 8.Pollock M., editor. Everyday Antiracism: Getting Real About Race in School. 10757th edition. The New Press; 2008. [Google Scholar]
- 9.Landrum M.J., Lee J.M., Benson M., Brown G.R., Chao C., Chitipiralla S., Gu B., Hart J., Hoffman D., Jang W., et al. ClinVar: improving access to variant interpretations and supporting evidence. Nucleic Acids Res. 2018;46:D1062–D1067. doi: 10.1093/nar/gkx1153. [DOI] [PMC free article] [PubMed] [Google Scholar]
- 10.Jolliffe I.T. In: Principal Component Analysis. Jolliffe I.T., editor. Springer New York; 1986. Principal component analysis and factor analysis; pp. 115–128. [Google Scholar]
- 11.Manichaikul A., Mychaleckyj J.C., Rich S.S., Daly K., Sale M., Chen W.-M. Robust relationship inference in genome-wide association studies. Bioinformatics. 2010;26:2867–2873. doi: 10.1093/bioinformatics/btq559. [DOI] [PMC free article] [PubMed] [Google Scholar]
- 12.Chang C.C., Chow C.C., Tellier L.C., Vattikuti S., Purcell S.M., Lee J.J. Second-generation PLINK: rising to the challenge of larger and richer datasets. Gigascience. 2015;4:7. doi: 10.1186/s13742-015-0047-8. [DOI] [PMC free article] [PubMed] [Google Scholar]
- 13.American Psychological Association Guidelines for psychological practice with transgender and gender nonconforming people. Am. Psychol. 2015;70:832–864. doi: 10.1037/a0039906. [DOI] [PubMed] [Google Scholar]
- 14.Taliun D., Harris D.N., Kessler M.D., Carlson J., Szpiech Z.A., Torres R., Taliun S.A.G., Corvelo A., Gogarten S.M., Kang H.M., et al. Sequencing of 53, 831 diverse genomes from the NHLBI TOPMed Program. Nature. 2021;590:290–299. doi: 10.1038/s41586-021-03205-y. [DOI] [PMC free article] [PubMed] [Google Scholar]
- 15.Das S., Forer L., Schönherr S., Sidore C., Locke A.E., Kwong A., Vrieze S.I., Chew E.Y., Levy S., McGue M., et al. Next-generation genotype imputation service and methods. Nat. Genet. 2016;48:1284–1287. doi: 10.1038/ng.3656. [DOI] [PMC free article] [PubMed] [Google Scholar]
- 16.McCarthy S., Das S., Kretzschmar W., Delaneau O., Wood A.R., Teumer A., Kang H.M., Fuchsberger C., Danecek P., Sharp K., et al. A reference panel of 64, 976 haplotypes for genotype imputation. Nat. Genet. 2016;48:1279–1283. doi: 10.1038/ng.3643. [DOI] [PMC free article] [PubMed] [Google Scholar]
- 17.Zheng H.-F., Ladouceur M., Greenwood C.M.T., Richards J.B. Effect of genome-wide genotyping and reference panels on rare variants imputation. J. Genet. Genomics. 2012;39:545–550. doi: 10.1016/j.jgg.2012.07.002. [DOI] [PubMed] [Google Scholar]
- 18.Pistis G., Porcu E., Vrieze S.I., Sidore C., Steri M., Danjou F., Busonero F., Mulas A., Zoledziewska M., Maschio A., et al. Rare variant genotype imputation with thousands of study-specific whole-genome sequences: implications for cost-effective study designs. Eur. J. Hum. Genet. 2015;23:975–983. doi: 10.1038/ejhg.2014.216. [DOI] [PMC free article] [PubMed] [Google Scholar]
- 19.Peterson R.E., Kuchenbaecker K., Walters R.K., Chen C.-Y., Popejoy A.B., Periyasamy S., et al. Genome-wide Association Studies in Ancestrally Diverse Populations: Opportunities, Methods, Pitfalls, and Recommendations. Cell. 2019;179:589–603. doi: 10.1016/j.cell.2019.08.051. [DOI] [PMC free article] [PubMed] [Google Scholar]
- 20.Borrell L.N. Racial identity among Hispanics: implications for health and well-being. Am. J. Public Health. 2005;95:379–381. doi: 10.2105/AJPH.2004.058172. [DOI] [PMC free article] [PubMed] [Google Scholar]
- 21.Wagner J.K., Yu J.H., Ifekwunigwe J.O., Harrell T.M., Bamshad M.J., Royal C.D. Anthropologists’ views on race, ancestry, and genetics. Am. J. Phys. Anthropol. 2017;162:318–327. doi: 10.1002/ajpa.23120. [DOI] [PMC free article] [PubMed] [Google Scholar]
- 22.Risch N., Burchard E., Ziv E., Tang H. Categorization of humans in biomedical research: genes, race and disease. Genome Biol. 2002;3 doi: 10.1186/gb-2002-3-7-comment2007. comment2007. [DOI] [PMC free article] [PubMed] [Google Scholar]
- 23.Tishkoff S.A., Kidd K.K. Implications of biogeography of human populations for “race” and medicine. Nat. Genet. 2004;36:S21–S27. doi: 10.1038/ng1438. [DOI] [PubMed] [Google Scholar]
- 24.Johnson R., Ding Y., Venkateswaran V., Bhattacharya A., Boulier K., Chiu A., Knyazev S., Schwarz T., Freund M., Zhan L., et al. Leveraging genomic diversity for discovery in an electronic health record linked biobank: the UCLA ATLAS Community Health Initiative. Genome Med. 2022;14:104. doi: 10.1186/s13073-022-01106-x. [DOI] [PMC free article] [PubMed] [Google Scholar]
- 25.1000 Genomes Project Consortium. Auton A., Brooks L.D., Durbin R.M., Garrison E.P., Kang H.M., Korbel J.O., Marchini J.L., McCarthy S., McVean G.A., Abecasis G.R. A global reference for human genetic variation. Nature. 2015;526:68–74. doi: 10.1038/nature15393. [DOI] [PMC free article] [PubMed] [Google Scholar]
- 26.Denny J.C., Bastarache L., Ritchie M.D., Carroll R.J., Zink R., Mosley J.D., Field J.R., Pulley J.M., Ramirez A.H., Bowton E., et al. Systematic comparison of phenome-wide association study of electronic medical record data and genome-wide association study data. Nat. Biotechnol. 2013;31:1102–1110. doi: 10.1038/nbt.2749. [DOI] [PMC free article] [PubMed] [Google Scholar]
- 27.Zhou W., Nielsen J.B., Fritsche L.G., Dey R., Gabrielsen M.E., Wolford B.N., LeFaive J., VandeHaar P., Gagliano S.A., Gifford A., et al. Efficiently controlling for case-control imbalance and sample relatedness in large-scale genetic association studies. Nat. Genet. 2018;50:1335–1341. doi: 10.1038/s41588-018-0184-y. [DOI] [PMC free article] [PubMed] [Google Scholar]
- 28.Buniello A., MacArthur J.A.L., Cerezo M., Harris L.W., Hayhurst J., Malangone C., McMahon A., Morales J., Mountjoy E., Sollis E., et al. The NHGRI-EBI GWAS Catalog of published genome-wide association studies, targeted arrays and summary statistics 2019. Nucleic Acids Res. 2019;47:D1005–D1012. doi: 10.1093/nar/gky1120. [DOI] [PMC free article] [PubMed] [Google Scholar]
- 29.Zhou W., Kanai M., Wu K.-H.H., Rasheed H., Tsuo K., Hirbo J.B., Wang Y., Bhattacharya A., Zhao H., Namba S., et al. Global biobank meta-analysis initiative: powering genetic discovery across human disease. Cell Genomics. 2022;2:100192. doi: 10.1016/j.xgen.2022.100192. [DOI] [PMC free article] [PubMed] [Google Scholar]
- 30.Roden D.M., Pulley J.M., Basford M.A., Bernard G.R., Clayton E.W., Balser J.R., Masys D.R. Development of a large-scale de-identified DNA biobank to enable personalized medicine. Clin. Pharmacol. Ther. 2008;84:362–369. doi: 10.1038/clpt.2008.89. [DOI] [PMC free article] [PubMed] [Google Scholar]
- 31.Heit J.A., Armasu S.M., Asmann Y.W., Cunningham J.M., Matsumoto M.E., Petterson T.M., De Andrade M. A genome-wide association study of venous thromboembolism identifies risk variants in chromosomes 1q24.2 and 9q. J. Thromb. Haemost. 2012;10:1521–1531. doi: 10.1111/j.1538-7836.2012.04810.x. [DOI] [PMC free article] [PubMed] [Google Scholar]
- 32.Lindström S., Wang L., Smith E.N., Gordon W., van Hylckama Vlieg A., de Andrade M., Brody J.A., Pattee J.W., Haessler J., Brumpton B.M., et al. Genomic and transcriptomic association studies identify 16 novel susceptibility loci for venous thromboembolism. Blood. 2019;134:1645–1657. doi: 10.1182/blood.2019000435. [DOI] [PMC free article] [PubMed] [Google Scholar]
- 33.Soria J.M., Morange P.-E., Vila J., Souto J.C., Moyano M., Trégouët D.A., Mateo J., Saut N., Salas E., Elosua R. Multilocus genetic risk scores for venous thromboembolism risk assessment. J. Am. Heart Assoc. 2014;3:e001060. doi: 10.1161/JAHA.114.001060. [DOI] [PMC free article] [PubMed] [Google Scholar]
- 34.Segal J.B., Eng J., Tamariz L.J., Bass E.B. Review of the evidence on diagnosis of deep venous thrombosis and pulmonary embolism. Ann. Fam. Med. 2007;5:63–73. doi: 10.1370/afm.648. [DOI] [PMC free article] [PubMed] [Google Scholar]
- 35.COVID-19 Host Genetics Initiative Mapping the human genetic architecture of COVID-19. Nature. 2021;600:472–477. doi: 10.1038/s41586-021-03767-x. [DOI] [PMC free article] [PubMed] [Google Scholar]
- 36.Loh P.-R., Danecek P., Palamara P.F., Fuchsberger C., A Reshef Y., K Finucane H., Schoenherr S., Forer L., McCarthy S., Abecasis G.R., et al. Reference-based phasing using the haplotype reference consortium panel. Nat. Genet. 2016;48:1443–1448. doi: 10.1038/ng.3679. [DOI] [PMC free article] [PubMed] [Google Scholar]
- 37.Fuchsberger C., Abecasis G.R., Hinds D.A. minimac2: faster genotype imputation. Bioinformatics. 2015;31:782–784. doi: 10.1093/bioinformatics/btu704. [DOI] [PMC free article] [PubMed] [Google Scholar]
- 38.Abraham G., Qiu Y., Inouye M. FlashPCA2: principal component analysis of Biobank-scale genotype datasets. Bioinformatics. 2017;33:2776–2778. doi: 10.1093/bioinformatics/btx299. [DOI] [PubMed] [Google Scholar]
- 39.World Medical Association World Medical Association Declaration of Helsinki: ethical principles for medical research involving human subjects. JAMA. 2013;310:2191–2194. doi: 10.1001/jama.2013.281053. [DOI] [PubMed] [Google Scholar]
- 40.Richards S., Aziz N., Bale S., Bick D., Das S., Gastier-Foster J., Grody W.W., Hegde M., Lyon E., Spector E., et al. Standards and guidelines for the interpretation of sequence variants: a joint consensus recommendation of the American college of medical genetics and genomics and the association for molecular pathology. Genet. Med. 2015;17:405–424. doi: 10.1038/gim.2015.30. [DOI] [PMC free article] [PubMed] [Google Scholar]
Associated Data
This section collects any data citations, data availability statements, or supplementary materials included in this article.
Supplementary Materials
Document S1. Figures S1–S7 and Data S1
Table S1: Genetic ancestry groups in ATLAS stratified by self-identified race/ethnicity, related to Table 1
We show the sample sizes of each genetic ancestry group in ATLAS stratified by self-identified race/ethnicity. Individuals who could not be assigned a genetic ancestry group are labeled as “Admixed or other ancestry”
Table S2: Phecode and ICD codes for 7 EHR-derived phenotypes, related to STAR Methods
We list the phecodes and corresponding ICD-9 and ICD-10 codes used for defining cases and controls in each GWAS analysis for 7 traits. Phecodes are obtained from phecode mapping v1.2
Table S3: List of genome-wide significant SNPs, related to Figure 4
We list all SNPs that pass the genome-wide significance threshold (p value < 5 ×10⁻⁸) for each trait and ancestry group. There were no significant associations identified for any of the traits within the East Asian ancestry group, and they are therefore not listed in the table. Association studies were not performed within the South Asian ancestry group due to low sample sizes
Document S2. Transparent peer review record for Johnson et al.
Document S3. Article plus supplemental information
Data Availability Statement
-
•
Individual-level genotype and electronic health record data utilized in this study cannot be deposited in a public repository because of privacy regulations. GWAS summary statistics are made available on the UCLA ATLAS PheWeb browser (https://atlas-phewas.mednet.ucla.edu/).
-
•
This paper does not report original code.