

Summary
T cell receptors (TCRs) recognize peptide fragments presented by the major histocompatibility complex (MHC) and are critical to T cell-mediated immunity. Recent data have indicated that genetic diversity within TCR-encoding gene regions is underexplored, limiting understanding of the impact of TCR loci polymorphisms on TCR function in disease, even though TCR repertoire signatures (1) are heritable and (2) associate with disease phenotypes. To address this, we developed a targeted long-read sequencing approach to generate highly accurate haplotype resolved assemblies of the TCR beta (TRB) and alpha/delta (TRA/D) loci, facilitating the genotyping of all variant types, including structural variants. We validate our approach using two mother-father-child trios and 5 unrelated donors representing multiple populations. This resulted in improved genotyping accuracy and the discovery of 84 undocumented V, D, J, and C alleles, demonstrating the utility of this framework for improving our understanding of TCR diversity and function in disease.
Keywords: TCR, immunogenomics, long-reads, alpha, beta, long-read sequencing, delta, structural variants, TCR alleles, T cell receptor
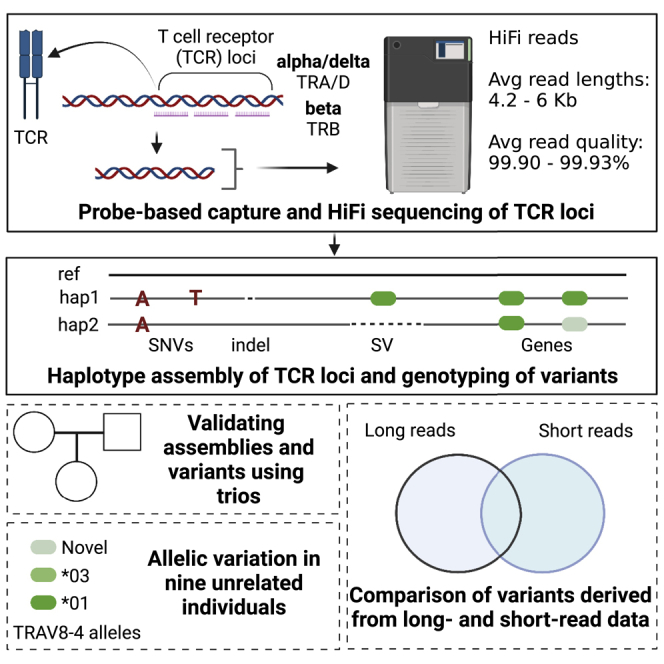
Graphical abstract
Highlights
-
•
Novel framework to characterize genomic diversity in the T cell receptor loci
-
•
Benchmarking revealed accurate assemblies, variant calls, and gene annotation sets
-
•
Variant detection with long-read sequencing framework outperforms short-read methods
-
•
Discovery of large number of previously undocumented T cell receptor gene alleles
Genetic variation within T cell receptor (TCR) genes influences the composition of the TCR repertoire and TCR-peptide-major histocompatibility complex interactions. Yet, diversity within human TCR loci is not well documented. Rodriguez et al. report a novel scalable method for targeted long-read sequencing of the TCR beta, alpha, and delta loci.
Introduction
T cell receptors (TCRs) play a central role in the adaptive immune system and are critical for fighting pathogens.1 TCRs are expressed on the T cell surface and interact with antigens via major histocompatibility complex (MHC) proteins. TCRs exist as a heterodimer protein consisting of either paired alpha and beta chains or paired gamma and delta chains. The total number of genes that encode the human TCR chains ranges from 228 to 234, and they are grouped into four segment types: variable (V), diversity (D), joining (J), and constant (C) genes. In humans, these genes reside in three genomic regions:2 the TCR beta (TRB), alpha and delta (TRA/D), and gamma (TRG) loci. During T cell development, V, D, and J genes are selected during V(D)J recombination (only V and J in the case of TRA and TRG) to form the template for the transcription and translation of a given TCR. The immense diversity observed in the TCR repertoire (i.e., the complete set of TCRs) is seeded by the selection from a large number of V, D, and J genes within the TCR loci, combined with junctional diversity at V-D and D-J junctions, and allows T cells to mount an immune response to diverse antigens.3 It is estimated that 2 × 10⁷ unique TCRs are present in a single individual.4 Development of the overall TCR repertoire is shaped by host genetics and the environment, including foreign and self-peptides.5,6,7,8
Germline diversity within the TRA/D, TRB, and TRG loci has been documented;8,9,10,11 however, the effect of genetic variants in these regions on the TCR repertoire and the downstream impacts on the ability of an individual to mount effective disease-related T cell responses remains underexplored. Several targeted genetic studies have identified germline variants associated with TCR function and TCR repertoire features. For example, TCRs using the allele TRBV9∗02 have been shown to have reduced functional recognition of Epstein-Barr virus compared with TRBV9∗01 under the same human leukocyte antigen (HLA) background.12 Furthermore, single-nucleotide polymorphisms (SNPs) within TCR and HLA have been associated with differences in TCR V gene usage,6,10 and TCR repertoires in monozygotic twins have been shown to be more similar than repertoires of unrelated individuals,5 demonstrating a role for genetics in the development of the TCR repertoire. However, large-scale genome-wide association studies (GWASs) have only implicated the TCR loci twice, specifically in narcolepsy13,14 and renal function after transplantation.15
Several reasons could exist for the disconnect between TCR polymorphisms and phenotypic outcomes, including, but not limited to, small sample sizes, inadequate genotyping, the use of an incomplete reference assembly, and disease/sample heterogeneity. Incomplete genotyping could be due to the complex repetitive nature of the antigen receptor loci. Similar to the immunoglobulin (IG) loci, the TCR loci have been shaped by gene duplication events,16,17 which have resulted in large expansions of the TCR gene family. Due to the duplicated and repetitive structure of immune receptor loci such as TCR and Ig, it has been proposed that short-read next-generation sequencing (NGS) performs suboptimally in these regions.18,19 Specifically in the Ig heavy chain locus (IGH), we have previously demonstrated that the use of NGS results in high rates of false-positive and -negative variants.20 Because of these technical barriers, we have not characterized the full extent of genetic diversity in these immune receptor loci,10 limiting our understanding of the role of germline variation in TCR function.
Here, we describe the application of a newly developed probe-based capture design to conduct long-fragment targeted enrichment of the TRB and TRA/D loci for high-fidelity long-read single molecule real-time (SMRT) sequencing. To provide a proof-of-concept dataset demonstrating the unique value of this approach, we have generated targeted SMRT sequencing data on two trios and five unrelated individuals of American, African, East Asian, and European ancestry. First, we show the efficacy of this capture-based sequencing approach and how it can be used to generate haplotype-resolved assemblies. We then use these assemblies to identify variants of different classes, including SNPs, insertions or deletions (indels), and structural variants (SVs), and resolve and curate full-length genes and alleles. Using variants resolved from short-read NGS from the same individuals, we compare the concordance between sequencing methods. This study demonstrates a robust and accurate methodology to efficiently resolve the TRB and TRA/D loci, validates previously identified variants, and takes a step forward in providing a framework that will be effective at resolving the role of TRB and TRA/D genetics in TCR-related phenotypes.
Design
An ideal genotyping experiment should allow for the comprehensive detection and genotyping of all variant types, including those in complex genomic regions that are highly polymorphic and rich in segmental duplications and repeats. Genotyping approaches for the TCR loci have previously leveraged either targeted short-read genomic approaches or adaptive immune receptor repertoire sequencing (AIRR-seq) methods;9,10,11 however, these efforts have focused only on genic variants. The utility of long-read whole-genome sequencing for more completely resolving genomic variants, even in complex loci, has been demonstrated. However, applying long-read whole-genome sequencing to large cohorts is currently not practical. Previously, we selectively sequenced the IGH locus using long-read sequencing by applying a custom oligonucletide capture panel that allows for the enrichment of long-read sequencing libraries for IGH DNA. The primary benefits of this approach are that it allows for the resolution of complex haplotype variation in one of the most polymorphic regions of the human genome at scale, providing the opportunity to leverage the strengths of long-read sequencing even in large cohorts in a cost-effective manner. Given that the complexity of the TCR loci mirrors that observed within the IG loci, we have adopted our approach for use in the TRA/D and TRB loci. To do this, we have expanded our previously developed computational framework to allow for resolution of TRA/D and TRB haplotype-resolved assemblies, SNPs, indels, SVs, and gene alleles. We validated our design through assessing Mendelian inheritance in mother-father-child trios and tested our approach against matched NGS datasets.
Our design includes both wet lab experimental protocol and end-to-end informatics pipeline with several key data deliverables: (1) BAM files with phased HiFi read alignments, (2) phased assembly alignments, (3) VCF with SNVs, BED files with (4) indels and (5) SVs, and (6) FASTA files with the assemblies and (7) gene alleles. These outputs are provided in standard data formats employed by other commonly used genomic pipelines and tools, allowing for downstream analysis and seamless integration into other analytical workflows.
Results
Targeted long-read sequencing of the TRA/D and TRB loci
We designed a custom oligonucleotide (oligo) capture panel (Roche KAPA Hyper-Choice) based on sequence targets spanning the TRA/D and TRB loci (hg38, chromosome chr22: 22,000,934–22,953,034; chr7: 142,270,924–142,843,399). To demonstrate the utility of this approach, we generated long-fragment capture libraries (4–6 kb) in 11 individuals from the 1000 Genomes Project (1KGP) cohort, including 2 mother-father-child trios (Yoruba, n = 3; Kinh Vietnamese, n = 3) and 5 unrelated individuals of diverse ethnic backgrounds (Table 1; Japanese, n = 1; Yoruba, n = 1; Utah residents [CEPH] with Northern and Western European ancestry, n = 1; Columbian, n = 1; Puerto Rican, n = 1). The goal of the 1KGP was to create a global reference of human genetic variation by sequencing 2,504 individuals and 129 mother-father-child trios using multiple sequencing/genotyping approaches (primarily short-read and array-based methods) from 26 populations. DNA from these samples is commercially available, making them ideal for testing and benchmarking different protocols and sequencing platforms and for detecting novel genetic variation in diverse populations. Libraries were multiplexed and sequenced on the Pacific Biosciences Sequel IIe system, generating mean high-fidelity (HiFi) read lengths and accuracies ranging from 4.2 to 6 kb (Figure 1A) and 99.90% to 99.93% (Figure 1B), respectively. Average per base HiFi read coverage ranged from 71× to 607× across both loci (Table 1). Coverage from sequencing DNA from a capture protocol is not expected to follow a Poisson distribution, as is typical from whole-genome sequencing data. Therefore, we empirically evaluated the coverage of the capture data generated here at each base position across the TRA/D and TRB loci (Figure 1C). Only two regions in two different samples (1,091 bp, HG02060; 374 bp, HG01175) had 0× coverage; in the remaining nine samples, all bases were spanned by at least 1 HiFi read (Figure 1C). Specifically, the two regions with 0× coverage in HG02060 and HG01175 had a range of 38× to 311× coverage in the other nine samples, indicating that the lack of coverage in these two samples was likely due to inherent variation in hybridization or sequencing. In summary, these metrics demonstrate that TRA/D and TRB are effectively captured and sequenced using this targeted custom oligo capture panel and long-read sequencing framework.
Table 1.
Samples used in study
| Sample | Family | Relation to proband | Population (abbreviation) | Superpopulation | Coverage | Read length (mean) | Read quality, % (mean) |
|---|---|---|---|---|---|---|---|
| NA18506 | Y013 | child | Yoruba (YRI) | AFR | 71.1 | 4,177 | 99.93 |
| NA18508 | Y013 | mother | Yoruba (YRI) | AFR | 607 | 6,035 | 99.91 |
| NA18507 | Y013 | father | Yoruba (YRI) | AFR | 379.9 | 5,320 | 99.92 |
| HG02059 | VN061 | child | Kinh Vietnamese (KHV) | EAS | 276 | 5,934 | 99.91 |
| HG02060 | VN061 | mother | Kinh Vietnamese (KHV) | EAS | 227.4 | 5,095 | 99.92 |
| HG02061 | VN061 | father | Kinh Vietnamese (KHV) | EAS | 218.9 | 5,453 | 99.91 |
| NA18956 | NA | NA | Japanese (JPT) | EAS | 337.4 | 4,312 | 99.93 |
| NA18517 | NA | NA | Yoruba (YRI) | AFR | 303.7 | 5,379 | 99.91 |
| NA10831 | NA | NA | CEPH (CEU) | EUR | 306 | 5,201 | 99.92 |
| HG01361 | NA | NA | Colombian (CLM) | AMR | 98.6 | 5,024 | 99.90 |
| HG01175 | NA | NA | Puerto Rican (PUR) | AMR | 106.7 | 5,753 | 99.93 |
Figure 1.

Targeted HiFi sequencing generates highly accurate long reads
(A and B) HiFi read (A) lengths and (B) quality.
(C ) Coverage of (C) TRA/D and TRB. Each color represents a different sample.
Generating haplotype-resolved assemblies of the TRA/D and TRB loci
We next assessed our ability to generate TRA/D and TRB haplotype-specific assemblies. Following methods outlined in Rodriguez et al.,20 heterozygous SNPs were identified and phased using HiFi reads from the capture-based sequencing datasets. Among the unrelated samples (n = 9), a mean of 1,356 (TRA/D) and 1,110 (TRB) heterozygous SNPs were identified. On average, >99% of these SNPs (1,353, TRA/D; 1,105, TRB) were phased with the WhatsHap tool, allowing for 57% to 93% (mean = 78%) and 29% to 95% (mean = 66%) of TRA/D and TRB, respectively, to be completely phased. The variation in assembly phasing was associated with the number of heterozygous positions identified in each sample. For example, NA18956, a Japanese sample, had the fewest bases phased (29% in TRB) and the fewest heterozygous SNPs (n = 463). However, the low number of polymorphisms identified was not due to low read coverage, as this sample had 99× mean base coverage. The longest haplotype blocks resolved represented 71% and 83% of the TRA/D and TRB loci, respectively, revealing that, for at least some samples, the majority of these loci could be phased into a single block. The largest assembled contigs per sample ranged in size from 158 to 653 kb (mean = 295 kb) and from 100 kb to 326 kb (mean = 180 kb) in TRA/D and TRB, respectively.
We next evaluated whether the trio probands HG02059 and NA18507 could be fully phased using SNPs phased with paternal and maternal data. In both probands, both haplotypes in TRA/D and TRB were completely phased and resolved, including 20.2 and 20.4 kb insertions found in both proband haplotypes in TRB. The accuracy of the TRA/D and TRB assemblies were assessed using parental contigs (Figure 2). The HG02059 maternally inherited haplotypes only had 63 bp mismatches with the HG02060 (mother) contigs, collectively across the TRA/D and TRB loci, representing an assembly accuracy greater than 99.996% (1,491,720/1,491,783 bp). Likewise, the paternally inherited haplotypes for TRA/D and TRB only had 55 bp mismatches with HG02061 (father) contigs, representing an assembly accuracy of 99.997% (1,642,320/1,642,375). Results for assemblies generated from NA18507 were similar, with 99.996% accuracy for both loci and maternal/paternal haplotypes. Together, these results indicated that TRA/D and TRB can be completely reconstructed at high quality using our approach.
Figure 2.

Trio assemblies in TRA/D and TRB are highly accurate
(A and B) Examples of high concordance in TRA/D (A) and TRB (B) assemblies are shown between the parents and proband of both trios. The GENCODE (v.24) annotation track is shown.
Accurate detection of SNPs, indels, and SVs from diploid assemblies
Using the haplotype-specific assemblies, genetic variants including SNPs, indels (2–49 bp), and SVs (≥50 bp) were evaluated. First, the accuracy of the genetic variants was assessed using Mendelian inheritance in the two trios. In total, there were 4,087 and 4,611 SNPs identified in HG02059 and NA18506, respectively, 4,065 (99.50%) and 4,571 (99.13%) of which followed proper Mendelian inheritance. For indels, the Mendelian inheritance rate was 97% (382/394) and 94% (448/475) in HG02059 and NA18506, respectively, and for SVs it was 93% (14/15) and 95% (19/20). These data show that variants within TRA/D and TRB are being accurately detected.
Across the unrelated samples (n = 9), the mean numbers of SNPs, indels, and SVs identified per sample in TRA/D and TRB, respectively, were 2,470 and 1,802, 260 and 132, and 4.2 and 6.3 (Figures 3A–3C). As expected, the majority of SNPs and indels resided within intergenic regions, but in each sample, we observed a mean of 36.33 and 61.44 SNPs within TRA/D and TRB genes. The total number of non-redundant SNPs in TRA/D and TRB was 5,072 and 3,385, respectively, only 10 and 16 SNPs of which were absent from dbSNPv154. However, it is critical to note that dbSNPv154 is missing allele frequency data for 818 (16%) and 1,206 (36%) SNPs in TRA/D and TRB, respectively. This indicates that while previous studies using large cohorts have identified these SNPs, they have not resolved them in enough samples to determine their allele frequencies. Further, these SNPs are likely not rare, as 1,443 (71%) were found in 2 or more of the 9 unrelated samples in this study.
Figure 3.

Genetic variants in TRA/D and TRB
(A–C) The per-sample counts of (A) SNPs, (B) indels, and (C) SVs detected from TRA/D and TRB assemblies.
(D and E) Comparison of SNPs detected from long-read sequencing (LRS) capture assemblies and 1KGP3 (left) and 1KG-30× (right) variant call sets for (D) TRA/D and (E) TRB; samples with the highest (left) and lowest (right) concordance rates are shown.
(F) IGV screenshot showing example region of TRB (chr7:142,438,390–142,547,431), demonstrating the presence of false SNPs identified from the 1KG-30× dataset. The panels shown are (1, top) SNPs present only within the 1KG-30× variant call set, (2) 1KG-30× Illumina 30× 2×151 bp short-read data, (3) PacBio HiFi-reads, and (4, bottom) PacBio HiFi assemblies. The ∼20 kb insertion resolved by the PacBio HiFi reads is highlighted in blue.
We also noted that SNP density in TRA/D and TRB was higher than what was observed across the entirety of chromosome 14 and 7 (Figures S1A and S1B). For 6 samples, we used the 1KGP phase 3 (1KGP3) SNPs to calculate the number of SNPs in 10 kB windows across chromosomes 14 and 7, representing a background SNP density for comparisons with the TRA/D and TRB loci, respectively. The mean number of SNPs per 10 kb window across samples for chromosomes 14 and 7 ranged from 15 to 18 for both chromosomes. In TRA/D and TRB, SNP densities ranged from 25 to 30 and 20 to 26, respectively (Figure S1). While the SNP densities observed were elevated in TRA/D and TRB, they were not as high as those found in HLA (Figure S1B). Interestingly, the increased SNP density was not uniformly distributed across the loci. Both TRA/D and TRB contained regions with an elevated number of SNPs (Figure S1). For example, all samples contained 71 to 87 SNPs in the 10 kb window spanning chr14: 21,890,001–21,900,000 (TRA/D), which contains the gene TRAV8-4. Similarly, the 10 kb window spanning chr7:142,380,001–142,390,000 in TRB, including the genes TRBV6-4, TRBV7-3, and TRBV5-3, contained 23 to 83 SNPs across all unrelated samples. Furthermore, although SNP densities in TRA/D and TRB were elevated, runs of homozygosity (ROHs) were also observed empirically in both loci, with the longest ROHs observed in TRB (Figures S2 and S3). This could be related to previously reported differences in recombination rates between TRA/D and TRB21 (2.3 versus 0.3 cM/Mb) as genomic regions with lower than average recombination rates have been shown to have longer tracts of ROHs.22
We identified three SVs >20 kb in the TRB locus, two of which were polymorphic among the 9 unrelated samples. One of these polymorphic SVs involved the deletion of the genes TRBV6-2, TRBV3-2, and TRBV4-3. We also detected a number of intergenic SVs, the largest of which was a 1,044 bp deletion. The largest intergenic insertion was 665 bps, represented by a tandem repeat expansion of a 37 bp motif. Other SVs included insertions and deletions of mobile element (ME) sequences. For example, a 331 bp Alu insertion was found in 6 individuals. Additional SVs in non-repetitive regions were also found in multiple samples. For example, an 800 bp deletion and a 592 bp insertion were found in 5 and 6 individuals, respectively. The positions of these SVs and their genotypes across samples are provided in Table S1.
Comparison between long-read- and short-read-derived variants
We have previously reported a high number of false-positive and -negative SNPs from short-read genomic data in the IGH locus.20 Given that the IGH and TCR loci are evolutionary related, sharing similar structural characteristics with respect to repeat sequences and segmental duplications, we wanted to determine whether SNPs identified with short-read data within the TCR loci might also be impacted by higher false-positive and -negative rates. To assess this, we compared SNP genotype calls derived from our long-read capture data in 6 unrelated individuals with those called from two short-read datasets generated in these same samples: (1) phase 3 variant call sets from the 1KGP (referred to as 1KGP3),23 and (2) variants called from more recently generated 30× WGS Illumina NovaSeq 6000 2 × 151 paired-end, TruSeq PCR-free sequence data (referred to as 1KG-30×; Figures 3D and 3E).24
The percentage of 1KGP3 TRA/D and TRB SNPs present in the long-read SNP dataset ranged from 94% to 96% and 84% to 93%, respectively (Figures 3D and 3E). The number of SNPs identified solely by the long-read capture data when compared with the 1KGP3 call set ranged from 268 to 301 (11%–14%) and 228 to 385 (22%–36%) in TRA/D and TRB, respectively (Figures 3D and 3E). This shows that the 1KGP3 call set suffers from high false-positive and -negative rates in TRB and a high false-negative rate in TRA/D.
For the 1KG-30× call set, the number of SNPs detected solely by long reads decreased substantially for both loci. For TRA/D and TRB, the SNPs identified solely by long reads ranged from 80 to 105 (3.6%–4.3%) and 12 to 39 (1.3%–3.8%), respectively (Figures 3D and 3E). In addition, the number of 1KG-30× SNPs also identified by the long-read SNP datasets ranged from 97% to 99% (Figures 3D and 3E). However, for TRB, the opposite was true; the percentage of 1KG-30× SNPs found in the long-read SNP datasets ranged from 25% to 34% (Figures 3D and 3E). We determined that the significant increase in false-positive SNPs in 1KG-30× was related to the reference genome used. For the 1KGP3 call set, GRCh37/hg19 was used, and for the 1KG-30× call set, GRCh38/hg38 was used. GRCh37/hg19 has three ∼20 kb insertions in TRB relative to GRCh38/hg38. We observed that, in the 1KGP3-30× dataset, reads derived from the ∼20 kb insertions were misaligned to other regions of TRB in the GRCh38/hg38 reference (Figure 3F); this was despite the fact that an alternate TRB haplotype with the insertion sequences was present (chr7_KI270803v1_alt) in the reference file used to generate the 1KG-30× call set.
To further assess the potential validity of SNPs identified either solely from long reads or solely from the 1KG-30× call set, we determined whether these SNPs were in regions with low short-read mappability (Figure S4). Specifically, we used the Umap multi-read mappability probability, which represents the probability that a given k-mer within a specified region maps uniquely to the reference. The Umap multi-read mappability scores (k-mer = 24) for bases with SNPs uniquely identified by long reads (mean = 0.28; n = 255) or solely present in the 1KG-30× call set (mean = 0.79; n = 7,362) were significantly lower than for bases with SNPs overlapping both datasets (mean = 0.82; n = 5,452; one-sided two-sample Kolmogorov-Smirnov test, p < 2.2 × 10⁻¹⁶). This demonstrates that the discrepancies in calls made between datasets is likely in part due to the difficulty of mapping short reads to repetitive loci in the genome.
Large structural differences between three TRB reference haplotypes
Large structural differences between GRCh38/hg38 and GRCh37/hg19 references within the TRB regions have been noted previously.25,26 In the previous section, we demonstrated that a significant number of false-positive SNPs from short-read data localized around large ∼20 kb insertions absent from the primary chromosomes in GRCh38/hg38. We thus conducted a focused analysis of these regions here to more directly assess their support in the capture assemblies and their impacts on short-read mapping and variant detection. Between GRCh38/hg38 and GRCh37/hg19 reference files, there are 3 haplotypes available for TRB. Comparing the GRCh37/hg19 and chr7_KI270803v1_alt alternate contig with GRCh38/hg38 revealed an inversion and gaps in GRCh37/hg19 and three 20 kb insertions in chr7_KI270803v1_alt (Figures 4A and 4B). We assessed whether these events were supported by the HiFi read data generated here by mapping these to the chr7_KI270803v1_alt haplotype (Figure 4C). We found that no inversions were detected, suggesting that this event is either a rare SV or a misassembly. False inversions have also been identified in other previously characterized misassembled regions in the human genome.27,28 The chr7_KI270803v1_alt TRB haplotype additionally appears to be a minor haplotype, as only 2 out 18 haplotypes in our cohort have all three ∼20 kb insertions. However, as additional approaches are developed for genotyping the TRB locus, it will be beneficial to use the chr7_KI270803v1_alt sequence as it represents the longest haplotype and contains 5 functional genes (TRBV6-2, TRBV4-3, TRBV6-9, TRBV7-8, and TRBV5-8) and one pseudogene (TRBV3-2; Figure 4D).
Figure 4.

Comparison of TRB haplotypes in GRCh38/hg38 and GRGRh37/hg19
(A) Dot plots between TRB loci GRCh38/hg38 chromosome 7, GRCh37/hg19 chromosome 7, and GRCh38/hg38 chr7_KI270803v1_alt. Dot plots were generated using Gepard. Each dot represents sequence homology between the compared sequences. Gaps in the diagonal represent insertions/deletions. Dots perpendicular to the diagonal indicate an inversion.
(B) TRB loci from chr7_KI270803v1_alt and GRCh37/hg19 chromosome 7 aligned to the TRB loci from GRCh38/hg38 chromosome 7. Both alignments further demonstrate genetic differences between reference haplotypes. Alignment of chr7_KI270803v1_alt, in particular, identifies three ∼20 kb insertions, indicated by purple marks. The GENCODE (v.24) annotation track is shown.
(C) HiFi read coverage in all samples for the chr7_KI270803v1_alt assembly. Shaded regions indicate the three ∼20 kb insertions in chr7_KI270803v1_alt.
(D) UCSC genome browser screenshots of chr7_KI270803v1_alt showing genes within the insertions. GENCODE (v.36) annotation track is shown.
Detection of TRA/D and TRB alleles
A critical step in analyzing TCR repertoire sequencing data is the alignment of reads to a TCR germline gene database in order to identify the V, D, and J alleles present in a given read. Therefore, it is important to utilize a complete and accurate allele database.10 To determine the extent to which targeted long-read capture sequencing can help complete TCR germline databases, we first genotyped the alleles in both trios to measure the genotyping accuracy and then genotyped the remaining samples (Figure 5; Table S2). All (n = 207) TRA V and J and TRB V, D, and J alleles identified in HG02059 were also identified in the parents. The same was true for NA18506, except for the geneTRAJ18; in this case, an additional allele was incorrectly identified in the assembly. However, direct use of the mapped HiFi reads facilitated characterization of the correct TRAJ18 allele; for example, 58 HiFi reads contained the allele found in both parents, and no reads supported the allele identified in the assembly.
Figure 5.

TRA/D and TRB allelic diversity
Gene alleles resolved from (A) TRA/D and (B) TRB long-read assemblies. Each color represents an allele or a deleted gene allele. Alleles marked by black dots are those not documented in IMGT. Genes with two distinct alleles are indicated by the presence of two filled boxes. Samples are arranged according to the superpopulation labels (EAS, East Asian; AMR, American; AFR, African).
We next genotyped alleles across all nine unrelated samples (Figure 5; Table S3). The average number of alleles observed per TRA V and J genes was 1.24 and 1.06, respectively, 1.19, 1, and 1.06 for TRB V, D, and J genes, and 1.33, 1, and 1.06 for TRD V, D, and J genes. This equated to an average of 26.7 heterozygous genes per sample. Notably, however, patterns of homozygosity and heterozygosity were biased toward particular genes in the TRA/D and TRB loci. For almost half of the genes (88 out 179) among TRA/D and TRB, no allelic variants were observed across all 9 samples. In contrast, for 7 genes (TRAV27, TRAV36DV7, TRBJ1-6, TRBV10-3, TRBV30, TRAV12-2, and TRAV8-4), we observed heterozygous allele calls in at least six individuals.
We next evaluated the occurrence of novel alleles among our samples (i.e., alleles not found in the International ImMunoGeneTics [IMGT] database; Table S4). In TRA, TRB, and TRD, there were 42, 35, and 2 novel alleles, respectively. Among these novel alleles, 4 TRBV alleles were predicted to be non-functional due to a premature stop codon. The gene with the most novel alleles was TRAV8-4 (n = 5). Across all the novel alleles, 13 (16%) were found in the assemblies and were supported by >10 HiFi reads in 2 or more individuals. Thus, 66 of the putative novel alleles here were only found in one of the 9 unrelated samples; nonetheless, in all cases, these alleles were supported by both assemblies and >10 HiFi reads in each sample dataset. Given our estimates of assembly accuracy, and TCR gene/allele genotyping recall in the trio datasets, we suspect that these 66 alleles are likely genuine. Providing additional support, 13 of the 35 TRB alleles were identical to those recently reported in studies using AIRR-seq.10,29 Taken together, the 75 putative novel functional alleles identified here have the potential to increase the alleles available in IMGT by 22%, from a total of 341–416 functional/open reading frame alleles. While all samples contain novel alleles, samples of African ancestry carried the most novel alleles in this dataset (Figure 5). This is likely due to greater genetic variation found within African populations and the underrepresentation of African samples in immunogenomic databases.23,30
Many recent studies have released TCR allele databases with alleles derived from 1KGP VCF files. One such database is the pmTRIG.31 Caution surrounding the use of short-read datasets for curating allelic variation in the immune receptor gene loci has been raised.32,33 We checked to determine how many of our novel alleles were present in pmTRIG. Critically, the pmTRIG database used 2,548 1KG samples, including the 9 samples sequenced in this study. However, we found that only 32 (76%), 16 (46%), and 0 (0%) of the novel TRA, TRB, and TRD alleles, respectively, identified in the current study were present in pmTRIG. Consistent with our comparison of short- and long-read variant call sets (Figures 3D and 3E), this demonstrated that short-read datasets derived with NGS technologies might not be capable of detecting all novel alleles in the TRA/D and TRB regions and can result in erroneous allelic variant calls.
Another critical region of TCRs is the constant domain, which interacts with the CD3 complex for proper T cell signal transduction. In this cohort, we additionally genotyped constant gene alleles for TRA, TRD, and TRB. Interestingly, despite the fact the samples surveyed here come from diverse populations, only a single allele for TRDC (i.e., TRDC∗01) was observed. For TRAC, there were only two alleles present in the cohort, TRAC∗01 and a novel TRAC allele. The TRAC∗01 allele was annotated in 15 (83%) of the 18 haplotypes analyzed (excluding probands; Table S5). There are two constant genes present within TRB, TRBC1 and TRBC2. For TRBC1, the majority of haplotypes (83%) contained TRBC1∗03, 2 carried (11%) TRBC1∗01, and only a single haplotype carried TRBC1∗02. Lastly, for TRBC2, we identified 6 alleles, including 4 novel alleles (Table S5). TCRB2∗01 and TCRB∗02 were present in 53% and 24% of the haplotypes, respectively. Interestingly, 4 out of the 5 novel alleles identified among the TCR constant genes annotated here were found only in African populations. These results demonstrate that allelic variation within the TCR constant genes may be more extensive than previously thought and are undersampled in non-European populations.
Discussion
TCRs are critical to T cell function and the adaptive immune response. Although several studies have uncovered evidence that genetics plays a role in shaping the TCR repertoire, only two GWASs have implicated the TCR loci in disease pathogenesis.13,14,15 In addition, despite the importance of TCR repertoire sequencing and profiling in disease research, genetic diversity in the TCR loci has not been extensively characterized, including understanding coding variation within TCR V, D, J, and C gene segments.9,10,25 We therefore extended our published immunogenomics framework to selectively sequence and assemble the human TCR loci using long-read sequencing in two trios and five unrelated individuals spanning African, East Asian, American, and European populations. Collectively, this dataset significantly expands the diversity and number of available annotated long-read haplotype assemblies for the TRA/D and TRB loci.
First, our analysis showed that the TCR loci can be effectively captured, sequenced, and assembled into phased diploid assemblies using long-read data. Importantly, across all samples, >99.9% of bases across both TRA/D and TRB loci were spanned by HiFi reads, and use of read-based variant phasing allowed us to generate haploid-specific assembly contigs, in some cases extending up to 653 kb in length. Critically, in trio probands, fully phased assemblies were possible, indicating that when phased variants are available, our method allows for complete reconstruction of haplotype assemblies spanning these loci. Consistent with our previous analysis of the human IGH locus using this approach,20 comparison of assemblies from probands and parents of two trios demonstrated assembly per base accuracies >99.9%. This assembly accuracy was reflected in variant call sets between parental and proband samples as well, in which >99% of SNP genotypes followed Mendelian inheritance patterns. Together, these initial analyses in trios highlighted the utility of using our approach for deeper characterization of TRA/D and TRB genetic diversity in an extended sample set.
Focusing on the analysis of 9 unrelated samples of diverse ancestries, we showed that long-read assemblies could be used to comprehensively detect SNPs, indels, and SVs. Similar to observations made in the Ig loci,20,34 although perhaps less extensive, we noted that genetic diversity in the TCR loci was elevated, represented by significantly higher SNP densities relative to the chromosome 7 and 14 averages. Interestingly, densities of SNPs were slightly higher in TRA/D relative to TRB, but in contrast, more SVs were detected in the TRB locus. However, it is notable that the number of polymorphic-gene-containing SVs in the TCR loci collectively is fewer than currently described in the IG loci, particularly IGH. This is in line with previous suggestions that sequence evolution within the TCR loci has been influenced less by SVs.11 Importantly, one of the gene deletions in TRB was very common in the samples studied here; it was present in a homozygous state in all 9 unrelated individuals sequenced. Being able to extend our approach to a greater number of individuals will be useful for assessing SV frequencies across human populations. This will likely be the case with SNPs as well. Our analysis revealed that a large proportion of SNPs identified in our samples lacked allele frequency data in dbSNP. Many of these variants were also difficult to genotype accurately using older short-read datasets from the 1KGP. While the utilization of higher coverage and quality short-read datasets performed better, our analysis indicated that the informed use of the correct genome reference that accounts for particular SVs and alternate haplotypes is critical to ensure read mapping and genotyping accuracy. Indeed, utilizing the proper TRB reference haplotype will likely decrease the number of false-positive SNPs identified by short reads. Future work should include the re-analysis of sequencing data utilizing a proper reference or potentially a reference graph genome capable of integrating different haplotypes.35,36,37 A potential path forward includes a large-scale population long-read sequencing analysis of TCR loci to generate completely phased haplotypes that will serve as a framework for the detection and imputation of variants using previously generated sequencing datasets.36
Our characterization of TCR haplotypes included the annotation of TCR genes across samples. Having complete haplotypes facilitated the discovery of extensive allelic variation, including the presence of many novel TRA/D and TRB alleles. The fact that we identified 85 undocumented (non-IMGT) alleles in only 9 unrelated individuals highlights the severe deficits that currently exist in germline databases. Considering our findings alongside other recent efforts underlines the work that remains to be done to fully catalog TCR gene diversity in the human population.10,30 At present, the impact that these missing germline genes and alleles have on the analysis and interpretation of TCR repertoire sequencing studies is not clear but would be expected to have profound effects on germline gene/allele assignment efforts, similar to what has been noted for expressed B cell receptor repertoires. As observed in the IG loci,38,39,40,41 it will be interesting to understand whether the inter-individual diversity uncovered in the human TCR loci will extend to non-human species as well.
Ultimately, we argue that improving the characterization of genetic diversity in the TCR loci will shed light on the role of these regions in driving key functions of TCRs and T cells in a variety of disease and clinical contexts. This study demonstrates the effectiveness of our approach over other existing methods. As we have shown for the IG loci, our approach is scalable, offering the opportunity to utilize it in a high-throughput fashion to sequence 100s to 1,000s of samples. Furthermore, although we have focused on analysis of TRB and TRA/D here, this approach could easily be extended to include the TRG locus as well. The future application of our approach will allow for the discovery and characterization of diversity in both coding and non-coding (e.g., regulatory) regions of these critical immune loci at an unprecedented scale, with the potential to more fully catalog TCR variants, akin to what has been done for the MHC/HLA genes. Haplotyping and genotyping of the MHC/HLA loci is standard practice in many immune studies, thus our method provides an opportunity to similarly operationalize genotyping of TCR genes, including efforts to do this in conjunction with MHC/HLA typing to better understand genetic impacts on the function of TCR-MHC interactions. Additionally, partnering our method with AIRR-seq can facilitate the identification of TCR variants that impact the composition of the TCR repertoire8,10 as well as crosstalk between B and T cells, e.g., T cell-dependent B cell activation. We expect such studies to become more common as the use of AIRR-seq becomes more prevalent in the research and clinical arenas.
Limitations
There are two main limitations to our study. We extract the TCR alpha, beta, and delta loci using oligo probes designed from resolved TCR haplotypes. Novel sequences (i.e., insertions) with no sequence similarity to sequence from previously resolved haplotypes may not be efficiently captured. However, in such cases, we would expect to observe signatures of novel insertions (i.e., soft-clipped bases), allowing for potential follow-up sequencing using whole-genome sequencing or other orthogonal methods. Once the novel insertion is resolved, probes can then be designed to pull down this sequence. Another theoretical limitation is the read lengths of the HiFi reads. While we were able to resolve a 20 kb insertion, there are potential limits to the SVs that 4.2–6 kb reads can resolve, depending on specific SV sequence features and architecture. However, as in the previous limitations, signatures for SVs should still be observed and therefore can be detected for deeper characterization as needed.
STAR★Methods
Key resources table
| REAGENT or RESOURCE | SOURCE | IDENTIFIER |
|---|---|---|
| Biological samples | ||
| NA18506 DNA | Coriell | NA18506 |
| NA18508 DNA | Coriell | NA18508 |
| NA18507 DNA | Coriell | NA18507 |
| HG02059 DNA | Coriell | HG02059 |
| HG02060 DNA | Coriell | HG02060 |
| HG02061 DNA | Coriell | HG02061 |
| NA18956 DNA | Coriell | NA18956 |
| NA18517 DNA | Coriell | NA18517 |
| NA10831 DNA | Coriell | NA10831 |
| HG01361 DNA | Coriell | HG01361 |
| HG01175 DNA | Coriell | HG01175 |
| Chemicals, peptides, and recombinant proteins | ||
| G-tubes | Covaris | Cat#520104 |
| Buffer EB | Qiagen | Cat#19086 |
| AMPure Beads | Pacific Biosciences | Cat#100-265-900 |
| Barcode_adapters, DNA Plate Duplex Oligo, 50 μM | IDT | IDT Plate #13748866 |
| KAPA Pure Beads, 60 mL | KAPA Roche | Cat#7983298001 |
| PrimeSTAR® GXL DNA Polymerase | Takara Bio | Cat#R050B |
| Universal Oligos, 100 μM | IDT | Ref#288647790 |
| Critical commercial assays | ||
| Qubit 1× dsDNA BR Assay kit | Thermo Fisher | Cat#Q33266 |
| 0.75% Agarose cassettes, Dye Free, Low Range | Sage Science | Cat#BLF7510 |
| KAPA Hyper prep kit, 96 rxn | KAPA Roche | Cat#7962363001 |
| DNF-467 Genomic DNA 50 kb kit | Agilent | Cat#DNF-467-0500 |
| KAPA HyperCap Reagent kit, 24 rxn | KAPA Roche | Cat#9075810001 |
| KAPA HyperCap Bead kit, 24 rxn | KAPA Roche | Cat#9075780001 |
| SMRTBell Express Template Prep Kit 2.0 | Pacific Biosciences | Cat#100-938-900 |
| SMRTBell Enzyme Cleanup 2.0 | Pacific Biosciences | Cat#101-746-400 |
| Deposited data | ||
| Raw data | This paper | SRA: PRJNA555323 |
| IMmunoGeneTics Information System (IMGT) database | IMGT | imgt.org |
| pmIGTR database | Khatri et al.31 | https://pmtrig.lumc.nl/Analytics |
| 1KGP3 SNPs | Auton et al.23 | s3://1000genomes/release/20130502/supporting/GRCh38_positions/ALL.chr7.phase3_shapeit2_mvncall_integrated_v3plus_nounphased.rsID.genotypes.GRCh38_dbSNP_no_SVs.vcf.gz |
| 1KG-30X SNPs | Auton et al.23 | gs://fc-56ac46ea-efc4-4683-b6d5-6d95bed41c5e/CCDG_14151/Project_CCDG_14151_B01_GRM_WGS.gVCF.2020-02-12/Project_CCDG_14151_B01_GRM_WGS.gVCF.2020-02-12 |
| Software and algorithms | ||
| IGenotyper | Rodriguez et al.20 | https://doi.org/10.5281/zenodo.7173321 |
| Supporting code | This paper | https://doi.org/10.5281/zenodo.7173321 |
| BLASR | Chaisson et al.42 | https://github.com/BioinformaticsArchive/blasr |
Resource availability
Lead contact
Further information and requests for resources should be directed to and will be fulfilled by the lead contact, Corey T. Watson (corey.watson@louisville.edu).
Materials availability
This study did not generate new unique reagents.
Method details
Long-read library preparation and sequencing
Genomic DNA was procured from the Coriell Institute for Medical Research (Camden, NJ). Genomic DNA was prepared using the protocol described in our previously published targeted long-read sequencing and IGenotyper framework.20 Briefly, 1-2 μg of high molecular weight DNA was sheared using g-tube (Covaris, Woburn, MA) to 5-9 Kbp at a 7000 RPM and size selected using the 0.75% DF 3-10 kb Marker S1-Improved Recovery cassette definition on the Blue Pippin (Sage Science). Sheared gDNA underwent end repaired and A-tailing using the standard KAPA library protocol. Barcodes were added to samples sequenced on the Sequel IIe platform and universal primers were ligated to all samples. PCR amplification was performed for 8-9 cycles using PrimeSTAR GXL Polymerase (Takara) at an annealing temperature of 60°C. Small fragments and excess reagents were removed using 0.7X vol:vol AMPure beads. Genomic DNA target enrichment was carried out using oligo probes designed directly from the reference sequence for TRA/D (chr14:21591838-22619224; hg38) and TRB (chr7:142270924-142843399; hg38); see Roche design specifications for details. Constructed capture libraries were washed using the KAPA Hyper-Cap protocol, and post-capture PCR amplification was performed for 16-18 cycles using PrimeSTAR GXL Polymerase (Takara) at an annealing temperature of 60°C.
Sequencing SMRTbell libraries were prepared using the SMRTbell Template Preparation Kit 1.0 (Pacific Biosciences, Menlo Park, CA, United States). Each sample was treated with a DNA Damage Repair and End Repair mix to repair nicked DNA, followed by A-tailing and ligation with SMRTbell hairpin adapters. These libraries were treated with an exonuclease cocktail to remove unligated gDNA and cleaned with 0.5X AMPure PB beads (Pacific Biosciences). The resulting SMRTbell libraries were prepared for sequencing according to the manufacturer’s protocol and sequenced on the Sequel IIe system using 2.0 chemistry and 30 h movies. HiFi data, consisting of circular consensus sequences filtered at a quality threshold of QV20 (99%), were generated on instrument and used for all downstream analysis.
Long-read assembly and genetic variation and allele detection
HiFi sequence data was analyzed using IGenotyper (version ad93f5d) using the default parameters.20 IGenotyper uses BLASR, WhatsHap, MsPAC and Canu for alignment, SNP detection and phasing, HiFi phasing and indel/SV detection and assembly, respectively.42,43,44,45 Briefly, the HiFi reads were first aligned to GRCh38 containing the alternate contigs. WhatsHap was then used to detect phased SNPs using the find_snv_candidates, genotype and phase commands. Using the MsPAC phase scripts, the HiFi reads were partitioned by haplotype or were labeled as unphased using the BLASR aligned reads and the WhatsHap phased SNPs. Canu was then used to assemble each haplotype and unphased reads with the `-pacbio-hifi` option. MsPAC was then used again to detect indels and SVs using a multiple sequence alignment generated by Kalign.46 SNPs were detected by IGenotyper from the alignment of haplotype resolved assemblies.
TCR genes and alleles were annotated and genotyped using IGenotyper. Specifically, IGenotyper output included extracted allele sequences for each TCR gene from the assembly and HiFi reads; allele assignments for each gene were made by assessing whether extracted sequences were exact string matches to the IMGT database (imgt.org). The IMGT database used was downloaded on 2022-02-20. Sequences that did not align to IMGT with an exact match were considered novel. Novel alleles were also compared to the pmIGTR database using the fasta sequences found in https://pmtrig.lumc.nl/Analytics accessed on 2022-02, again by requiring exact sequence matches.
Assessing accuracy of assembly and genetic variants
The accuracy of the assemblies and variants was assessed using data from two mother-father-proband trios. In each case, we used BLASR42 to align the inherited parental contigs to the respective maternally or paternally inherited assembly in the proband.42 Differences between the parental and proband sequences were detected using a custom python script utilizing the pysam library. Alignments were evaluated for (1) full alignment without any soft-clipped sequences, (2) deletions, (3) insertions and (4) mismatches.
Comparison of SNP genotypes between long- and short-read datasets
1KGP3 and 1KG-30X SNPs were downloaded from s3://1000genomes/release/20130502/supporting/GRCh38_positions/ALL.chr7.phase3_shapeit2_mvncall_integrated_v3plus_nounphased.rsID.genotypes.GRCh38_dbSNP_no_SVs.vcf.gz and gs://fc-56ac46ea-efc4-4683-b6d5-6d95bed41c5e/CCDG_14151/Project_CCDG_14151_B01_GRM_WGS.gVCF.2020-02-12/Project_CCDG_14151_B01_GRM_WGS.gVCF.2020-02-12, respectively. Comparisons were performed using a custom python script that compared both the presence and genotype of all variants between two datasets.
Acknowledgments
O.L.R., C.A.S., K.S., M.L.S., and C.T.W. were supported in part by grant R24AI138963 from the National Institute of Allergy and Infectious Diseases. O.L.R. is also supported by the Zuckerman postdoctoral fellowship.
Author contributions
C.A.S. and K.S. prepared sequencing libraries, M.L.S. sequenced libraries, O.L.R. ran computational experiments, and O.L.R. and C.T.W. wrote the manuscript.
Declaration of interests
The authors declare no competing interests.
Published: November 30, 2022
Footnotes
Supplemental information can be found online at https://doi.org/10.1016/j.xgen.2022.100228.
Supplemental information
Data and code availability
-
•
All raw sequencing data in BAM format have been deposited in SRA and are publicly available as of the date of publication. Accession numbers are listed in the key resources table.
-
•
All original code has been deposited in Zenodo (https://doi.org/10.5281/zenodo.7173321).
References
- 1.Kumar B.V., Connors T.J., Farber D.L. Human T cell development, localization, and function throughout life. Immunity. 2018;48:202–213. doi: 10.1016/j.immuni.2018.01.007. [DOI] [PMC free article] [PubMed] [Google Scholar]
- 2.Lefranc M.-P., Lefranc G. Academic Press; 2001. The T Cell Receptor FactsBook. [Google Scholar]
- 3.Roth D.B. V(D)J Recombination: Mechanism, Errors, and Fidelity. Microbiol. Spectr. 2014;2 doi: 10.1128/microbiolspec.MDNA3-0041-2014. [DOI] [PMC free article] [PubMed] [Google Scholar]
- 4.Nikolich-Žugich J., Slifka M.K., Messaoudi I. The many important facets of T-cell repertoire diversity. Nat. Rev. Immunol. 2004;4:123–132. doi: 10.1038/nri1292. [DOI] [PubMed] [Google Scholar]
- 5.Zvyagin I.V., Pogorelyy M.V., Ivanova M.E., Komech E.A., Shugay M., Bolotin D.A., Shelenkov A.A., Kurnosov A.A., Staroverov D.B., Chudakov D.M., et al. Distinctive properties of identical twins’ TCR repertoires revealed by high-throughput sequencing. Proc. Natl. Acad. Sci. USA. 2014;111:5980–5985. doi: 10.1073/pnas.1319389111. [DOI] [PMC free article] [PubMed] [Google Scholar]
- 6.Sharon E., Sibener L.V., Battle A., Fraser H.B., Garcia K.C., Pritchard J.K. Genetic variation in MHC proteins is associated with T cell receptor expression biases. Nat. Genet. 2016;48:995–1002. doi: 10.1038/ng.3625. [DOI] [PMC free article] [PubMed] [Google Scholar]
- 7.Klein L., Kyewski B., Allen P.M., Hogquist K.A. Positive and negative selection of the T cell repertoire: what thymocytes see (and don’t see) Nat. Rev. Immunol. 2014;14:377–391. doi: 10.1038/nri3667. [DOI] [PMC free article] [PubMed] [Google Scholar]
- 8.Russell M.L., Souquette A., Levine D.M., Schattgen S.A., Kaitlynn Allen E., Kuan G., Simon N., Balmaseda A., Gordon A., Thomas P.G., et al. Combining genotypes and T cell receptor distributions to infer genetic loci determining V(D)J recombination probabilities. Elife. 2022;11:e73475. doi: 10.7554/eLife.73475. [DOI] [PMC free article] [PubMed] [Google Scholar]
- 9.Mackelprang R., Livingston R.J., Eberle M.A., Carlson C.S., Yi Q., Akey J.M., Nickerson D.A. Sequence diversity, natural selection and linkage disequilibrium in the human T cell receptor alpha/delta locus. Hum. Genet. 2006;119:255–266. doi: 10.1007/s00439-005-0111-z. [DOI] [PubMed] [Google Scholar]
- 10.Omer A., Peres A., Rodriguez O.L., Watson C.T., Lees W., Polak P., Collins A.M., Yaari G. T cell receptor beta germline variability is revealed by inference from repertoire data. Genome Med. 2022;14:2. doi: 10.1186/s13073-021-01008-4. [DOI] [PMC free article] [PubMed] [Google Scholar]
- 11.Luo S., Yu J.A., Li H., Song Y.S. Worldwide genetic variation of the IGHV and TRBV immune receptor gene families in humans. Life Sci. Alliance. 2019;2:e201800221. doi: 10.26508/lsa.201800221. [DOI] [PMC free article] [PubMed] [Google Scholar]
- 12.Gras S., Chen Z., Miles J.J., Liu Y.C., Bell M.J., Sullivan L.C., Kjer-Nielsen L., Brennan R.M., Burrows J.M., Neller M.A., et al. Allelic polymorphism in the T cell receptor and its impact on immune responses. J. Exp. Med. 2010;207:1555–1567. doi: 10.1084/jem.20100603. [DOI] [PMC free article] [PubMed] [Google Scholar]
- 13.Hallmayer J., Faraco J., Lin L., Hesselson S., Winkelmann J., Kawashima M., Mayer G., Plazzi G., Nevsimalova S., Bourgin P., et al. Narcolepsy is strongly associated with the T-cell receptor alpha locus. Nat. Genet. 2009;41:708–711. doi: 10.1038/ng.372. [DOI] [PMC free article] [PubMed] [Google Scholar]
- 14.Han F., Faraco J., Dong X.S., Ollila H.M., Lin L., Li J., An P., Wang S., Jiang K.W., Gao Z.C., et al. Genome wide analysis of narcolepsy in China implicates novel immune loci and reveals changes in association prior to versus after the 2009 H1N1 influenza pandemic. PLoS Genet. 2013;9:e1003880. doi: 10.1371/journal.pgen.1003880. [DOI] [PMC free article] [PubMed] [Google Scholar]
- 15.O’Brien R.P., Phelan P.J., Conroy J., O’Kelly P., Green A., Keogan M., O’Neill D., Jennings S., Traynor C., Casey J., et al. A genome-wide association study of recipient genotype and medium-term kidney allograft function. Clin. Transplant. 2013;27:379–387. doi: 10.1111/ctr.12093. [DOI] [PubMed] [Google Scholar]
- 16.Matsuda F., Ishii K., Bourvagnet P., Kuma K.i., Hayashida H., Miyata T., Honjo T. The complete nucleotide sequence of the human immunoglobulin heavy chain variable region locus. J. Exp. Med. 1998;188:2151–2162. doi: 10.1084/jem.188.11.2151. [DOI] [PMC free article] [PubMed] [Google Scholar]
- 17.Rowen L., Koop B.F., Hood L. The complete 685-kilobase DNA sequence of the human beta T cell receptor locus. Science. 1996;272:1755–1762. doi: 10.1126/science.272.5269.1755. [DOI] [PubMed] [Google Scholar]
- 18.Watson C.T., Breden F. The immunoglobulin heavy chain locus: genetic variation, missing data, and implications for human disease. Gene Immun. 2012;13:363–373. doi: 10.1038/gene.2012.12. [DOI] [PubMed] [Google Scholar]
- 19.Zhao X., Collins R.L., Lee W.-P., Weber A.M., Jun Y., Zhu Q., Weisburd B., Huang Y., Audano P.A., Wang H., et al. Expectations and blind spots for structural variation detection from long-read assemblies and short-read genome sequencing technologies. Am. J. Hum. Genet. 2021;108:919–928. doi: 10.1016/j.ajhg.2021.03.014. [DOI] [PMC free article] [PubMed] [Google Scholar]
- 20.Rodriguez O.L., Gibson W.S., Parks T., Emery M., Powell J., Strahl M., Deikus G., Auckland K., Eichler E.E., Marasco W.A., et al. A novel framework for characterizing genomic haplotype diversity in the human immunoglobulin heavy chain locus. Front. Immunol. 2020;11:2136. doi: 10.3389/fimmu.2020.02136. [DOI] [PMC free article] [PubMed] [Google Scholar]
- 21.Kong A., Gudbjartsson D.F., Sainz J., Jonsdottir G.M., Gudjonsson S.A., Richardsson B., Sigurdardottir S., Barnard J., Hallbeck B., Masson G., et al. A high-resolution recombination map of the human genome. Nat. Genet. 2002;31:241–247. doi: 10.1038/ng917. [DOI] [PubMed] [Google Scholar]
- 22.Gibson J., Morton N.E., Collins A. Extended tracts of homozygosity in outbred human populations. Hum. Mol. Genet. 2006;15:789–795. doi: 10.1093/hmg/ddi493. [DOI] [PubMed] [Google Scholar]
- 23.Auton A., Brooks L.D., Durbin R.M., Garrison E.P., Kang H.M., Korbel J.O., Marchini J.L., McCarthy S., McVean G.A., Abecasis G.R., 1000 Genomes Project Consortium A global reference for human genetic variation. Nature. 2015;526:68–74. doi: 10.1038/nature15393. [DOI] [PMC free article] [PubMed] [Google Scholar]
- 24.Byrska-Bishop M., Evani U.S., Zhao X., Basile A.O., Abel H.J., Regier A.A., Corvelo A., Clarke W.E., Musunuri R., Nagulapalli K., et al. High-coverage whole-genome sequencing of the expanded 1000 Genomes Project cohort including 602 trios. Cell. 2022;185:3426–3440.e19. doi: 10.1016/j.cell.2022.08.004. [DOI] [PMC free article] [PubMed] [Google Scholar]
- 25.Zhang J.-Y., Roberts H., Flores D.S.C., Cutler A.J., Brown A.C., Whalley J.P., Mielczarek O., Buck D., Lockstone H., Xella B., et al. Using de novo assembly to identify structural variation of eight complex immune system gene regions. PLoS Comput. Biol. 2021;17:e1009254. doi: 10.1371/journal.pcbi.1009254. [DOI] [PMC free article] [PubMed] [Google Scholar]
- 26.Lin M.-J., Lin Y.-C., Chen N.-C., Luo A.C., Lai S.-K., Hsu C.-L., Hsu J.S., Chen C.-Y., Yang W.-S., Chen P.-L. Profiling germline adaptive immune receptor repertoire with gAIRR suite. Front. Immunol. 2022;13:922513. doi: 10.3389/fimmu.2022.922513. [DOI] [PMC free article] [PubMed] [Google Scholar]
- 27.Steinberg K.M., Schneider V.A., Graves-Lindsay T.A., Fulton R.S., Agarwala R., Huddleston J., Shiryev S.A., Morgulis A., Surti U., Warren W.C., et al. Single haplotype assembly of the human genome from a hydatidiform mole. Genome Res. 2014;24:2066–2076. doi: 10.1101/gr.180893.114. [DOI] [PMC free article] [PubMed] [Google Scholar]
- 28.Chaisson M.J.P., Huddleston J., Dennis M.Y., Sudmant P.H., Malig M., Hormozdiari F., Antonacci F., Surti U., Sandstrom R., Boitano M., et al. Resolving the complexity of the human genome using single-molecule sequencing. Nature. 2015;517:608–611. doi: 10.1038/nature13907. [DOI] [PMC free article] [PubMed] [Google Scholar]
- 29.Heather J.M., Spindler M.J., Alonso M.H., Shui Y.I., Millar D.G., Johnson D.S., Cobbold M., Hata A.N. Stitchr: stitching coding TCR nucleotide sequences from V/J/CDR3 information. Nucleic Acids Res. 2022;50:e68. doi: 10.1093/nar/gkac190. [DOI] [PMC free article] [PubMed] [Google Scholar]
- 30.Peng K., Safonova Y., Shugay M., Popejoy A.B., Rodriguez O.L., Breden F., Brodin P., Burkhardt A.M., Bustamante C., Cao-Lormeau V.-M., et al. Diversity in immunogenomics: the value and the challenge. Nat. Methods. 2021;18:588–591. doi: 10.1038/s41592-021-01169-5. [DOI] [PMC free article] [PubMed] [Google Scholar]
- 31.Khatri I., Berkowska M.A., van den Akker E.B., Teodosio C., Reinders M.J.T., van Dongen J.J.M. Population matched (pm) germline allelic variants of immunoglobulin (IG) loci: relevance in infectious diseases and vaccination studies in human populations. Gene Immun. 2021;22:172–186. doi: 10.1038/s41435-021-00143-7. [DOI] [PMC free article] [PubMed] [Google Scholar]
- 32.Watson C.T., Matsen F.A., Jackson K.J.L., Bashir A., Smith M.L., Glanville J., Breden F., Kleinstein S.H., Collins A.M., Busse C.E. Comment on “A database of human immune receptor alleles recovered from population sequencing data. J. Immunol. 2017;198:3371–3373. doi: 10.4049/jimmunol.1700306. [DOI] [PubMed] [Google Scholar]
- 33.Collins A.M., Peres A., Corcoran M.M., Watson C.T., Yaari G., Lees W.D., Ohlin M. Commentary on Population matched (pm) germline allelic variants of immunoglobulin (IG) loci: relevance in infectious diseases and vaccination studies in human populations. Gene Immun. 2021;22:335–338. doi: 10.1038/s41435-021-00152-6. [DOI] [PMC free article] [PubMed] [Google Scholar]
- 34.Watson C.T., Steinberg K.M., Huddleston J., Warren R.L., Malig M., Schein J., Willsey A.J., Joy J.B., Scott J.K., Graves T.A., et al. Complete haplotype sequence of the human immunoglobulin heavy-chain variable, diversity, and joining genes and characterization of allelic and copy-number variation. Am. J. Hum. Genet. 2013;92:530–546. doi: 10.1016/j.ajhg.2013.03.004. [DOI] [PMC free article] [PubMed] [Google Scholar]
- 35.Paten B., Novak A.M., Eizenga J.M., Garrison E. Genome graphs and the evolution of genome inference. Genome Res. 2017;27:665–676. doi: 10.1101/gr.214155.116. [DOI] [PMC free article] [PubMed] [Google Scholar]
- 36.Ebler J., Ebert P., Clarke W.E., Rausch T., Audano P.A., Houwaart T., Mao Y., Korbel J.O., Eichler E.E., Zody M.C., et al. Pangenome-based genome inference allows efficient and accurate genotyping across a wide spectrum of variant classes. Nat. Genet. 2022;54:518–525. doi: 10.1038/s41588-022-01043-w. [DOI] [PMC free article] [PubMed] [Google Scholar]
- 37.Rakocevic G., Semenyuk V., Lee W.-P., Spencer J., Browning J., Johnson I.J., Arsenijevic V., Nadj J., Ghose K., Suciu M.C., et al. Fast and accurate genomic analyses using genome graphs. Nat. Genet. 2019;51:354–362. doi: 10.1038/s41588-018-0316-4. [DOI] [PubMed] [Google Scholar]
- 38.Kaduk M., Corcoran M., Karlsson Hedestam G.B. Addressing IGHV gene structural diversity enhances immunoglobulin repertoire analysis: lessons from rhesus macaque. Front. Immunol. 2022;13:818440. doi: 10.3389/fimmu.2022.818440. [DOI] [PMC free article] [PubMed] [Google Scholar]
- 39.Watson C.T., Kos J.T., Gibson W.S., Newman L., Deikus G., Busse C.E., Smith M.L., Jackson K.J., Collins A.M. A comparison of immunoglobulin IGHV, IGHD and IGHJ genes in wild-derived and classical inbred mouse strains. Immunol. Cell Biol. 2019;97:888–901. doi: 10.1111/imcb.12288. [DOI] [PubMed] [Google Scholar]
- 40.Cirelli K.M., Carnathan D.G., Nogal B., Martin J.T., Rodriguez O.L., Upadhyay A.A., Enemuo C.A., Gebru E.H., Choe Y., Viviano F., et al. Slow delivery immunization enhances HIV neutralizing antibody and germinal center responses via modulation of immunodominance. Cell. 2020;180:206. doi: 10.1016/j.cell.2019.12.027. [DOI] [PMC free article] [PubMed] [Google Scholar]
- 41.Kos J.T., Safonova Y., Shields K.M., Silver C.A., Lees W.D., Collins A.M., Watson C.T. Characterization of extensive diversity in immunoglobulin light chain variable germline genes across biomedically important mouse strains. Preprint at bioRxiv. 2022 doi: 10.1101/2022.05.01.489089. [DOI] [Google Scholar]
- 42.Chaisson M.J., Tesler G. Mapping single molecule sequencing reads using basic local alignment with successive refinement (BLASR): application and theory. BMC Bioinf. 2012;13:238. doi: 10.1186/1471-2105-13-238. [DOI] [PMC free article] [PubMed] [Google Scholar]
- 43.Martin M., Patterson M., Garg S., Fischer S.O., Pisanti N., Klau G.W., Schöenhuth A., Marschall T. WhatsHap: fast and accurate read-based phasing. Preprint at bioRxiv. 2016 doi: 10.1101/085050. [DOI] [Google Scholar]
- 44.Rodriguez O.L., Ritz A., Sharp A.J., Bashir A. MsPAC: a tool for haplotype-phased structural variant detection. Bioinformatics. 2020;36:922–924. doi: 10.1093/bioinformatics/btz618. [DOI] [PMC free article] [PubMed] [Google Scholar]
- 45.Nurk S., Walenz B.P., Rhie A., Vollger M.R., Logsdon G.A., Grothe R., Miga K.H., Eichler E.E., Phillippy A.M., Koren S. HiCanu: accurate assembly of segmental duplications, satellites, and allelic variants from high-fidelity long reads. Genome Res. 2020;30:1291–1305. doi: 10.1101/gr.263566.120. [DOI] [PMC free article] [PubMed] [Google Scholar]
- 46.Lassmann T. Kalign 3: multiple sequence alignment of large data sets. Bioinformatics. 2019:btz795. doi: 10.1093/bioinformatics/btz795. [DOI] [PMC free article] [PubMed] [Google Scholar]
Associated Data
This section collects any data citations, data availability statements, or supplementary materials included in this article.
Supplementary Materials
Data Availability Statement
-
•
All raw sequencing data in BAM format have been deposited in SRA and are publicly available as of the date of publication. Accession numbers are listed in the key resources table.
-
•
All original code has been deposited in Zenodo (https://doi.org/10.5281/zenodo.7173321).