

Abstract
Using eye tracking, a rich body of literature has identified atypical attention to dynamic social stimuli in children with autism. What is less clear is what constitutes typical gaze as this is highly dependent on stimulus content. Instead of looking at proportions of looking time to predefined areas of interested, here we calculate mean fixations frame-by-frame in a group of typically developing children. We then determined the distance from that typical fixation point for 155 children with autism frame-by-frame. Distance from the typical scan path was assessed in relation to clinical measures of adaptive skills and autism symptomatology. Findings revealed that less typical scan paths among children with autism were associated with lower communication abilities and greater autism symptomatology.
Keywords: eye-tracking, autism, social attention, communication
For nearly two decades, eye-tracking has been used to distinguish between the gaze patterns of individuals with autism spectrum disorder (ASD) and controls viewing naturalistic social stimuli (Klin, Jones, Schultz, Volkmar, & Cohen, 2002b; Pelphrey et al., 2002). In light of group differences in patterns of social attention, the correspondence between gaze patterns and behavioral measures (Klin, Jones, Schultz, Volkmar, & Cohen, 2002a; Murias et al., 2018), and evidence for genetic influence on scan paths (Constantino et al., 2017; Kennedy et al., 2017), eye gaze is increasingly being considered a biological marker of underlying neurological function (Murias et al., 2018). What is not clear from the extant literature is what constitutes “typical” gaze patterns. Many of the studies exploring group differences have relied on proportion of looking time to predefined areas of interest collapsed across the length of the stimuli presented. While overall looking time is clearly important, this gross measure fails to take advantage of one of the key features of the eye-tracking technology: time course data. Though attention to facial features such as the eyes or mouth may be the normative pattern among typically developing individuals, the content of the video matters a great deal and a “typical fixation” can change moment-to-moment depending on the stimuli (Chawarska, Macari, & Shic, 2012). Here we attempt to make use of this time-locked data (1) to better define typicality in an established set of eye-tracking stimuli (Chawarska et al., 2012), and (2) to assess the relationship between distance from a typical scan path and social functioning in children with ASD.
Typical patterns of attention to dynamic social stimuli
Since the early eye-tracking studies of social attention in ASD (Klin et al., 2002b; Pelphrey et al., 2002) many groups have used eye-tracking to identify group differences in proportion of looks to areas of interest within social stimuli (Chawarska, Macari, & Shic, 2013; Chawarska, Ye, Shic, & Chen, 2015; Cilia, Aubry, Le Driant, Bourdin, & Vandromme, 2019; Kennedy et al., 2017; Klin et al., 2002a; Pelphrey et al., 2002; Sasson, Turner-Brown, Holtzclaw, Lam, & Bodfish, 2008; Shic, Macari, & Chawarska, 2013; Young, Merin, Rogers, & Ozonoff, 2009). These studies have identified important differences in social attention among individuals with ASD, but have also produced a number of seemingly contradictory results. For example, though early studies of attention to faces suggested that attention to the eyes was typical and focus on the mouth was indicative of ASD (Jones, Carr, & Klin, 2008; Klin et al., 2002b), numerous studies since have failed to find these differences (Chawarska et al., 2013; Elsabbagh et al., 2014; Shic et al., 2013) and suggest that attention to the mouth in early development is in fact related to better expressive language abilities in typically developing children and children with ASD (Elsabbagh et al., 2014; Tenenbaum, Amso, Abar, & Sheinkopf, 2014; Tenenbaum, Sobel, Sheinkopf, Malle, & Morgan, 2014; Young et al., 2009).
Multiple factors have now been shown to influence how children attend to social stimuli (Chita-Tegmark, 2016; Falck-Ytter, Bölte, & Gredebäck, 2013; Guillon, Hadjikhani, Baduel, & Rogé, 2014). These include age of the participant (Nakano et al., 2010), IQ of the participant (Sargezeh, Ayatollahi, & Daliri, 2019), motivational factors (Schomaker, Walper, Wittmann, & Einhäuser, 2017), content of the scene (Hanley, McPhillips, Mulhern, & Riby, 2013; Rice, Moriuchi, Jones, & Klin, 2012; Sasson et al., 2008), affective content (Wagner, Hirsch, Vogel-Farley, Redcay, & Nelson, 2013), dynamic nature of the stimuli (Chevallier et al., 2015; Hanley et al., 2013; Speer, Cook, McMahon, & Clark, 2007), and social or dyadic nature of the presentation (Chawarska et al., 2012; Shic, Bradshaw, Klin, Scassellati, & Chawarska, 2011; Shic et al., 2013). Given that these factors can change from moment to moment, focus on overall proportion of looks to a given area over the length of a trial or stimulus set will likely fail to capture valuable information about social attention in ASD.
Use of time-course data in attention to social stimuli in ASD
To date, only a handful of eye-tracking studies in ASD have shifted from proportion of looking time to exploring time-locked scan paths for dynamic stimuli in relation to diagnostic status and level of impairment (Falck-Ytter, von Hofsten, Gillberg, & Fernell, 2013; Lönnqvist et al., 2017; Nakano et al., 2010; Wang, Campbell, Macari, Chawarska, & Shic, 2018). The studies that have made use of this granular information have approached the matter from a number of different angles, each with benefits and limitations.
Nakano et al. (2010) used multi-dimensional scaling (MDS) to quantify the typical scan path of children and adults with and without ASD. To do this, they calculated the absolute distance between every pair of gaze points across 104 participants at each time point in their stimuli of video clips from shows intended for young children. Using MDS, the resulting matrix of 103 dimensions was reduced to a two-dimensional plane and the median of the entire MDS distribution was established as the typical scan path. Distance from this typical path was greater for individuals with ASD than for typically developing (TD) controls. Among individuals with ASD, distance from the median path was correlated with symptoms of ASD as measured on the Japanese version of the autism spectrum quotient (Wakabayashi, Baron-Cohen, Wheelwright, & Tojo, 2006). This novel approach suggests that typical scan path clusters together and the distance from that path is related to ASD symptomology. The limitation of this work is the difficulty in interpreting the MDS plane. There is no intuitive representation for the X or Y-axis in real space.
Improving on interpretability, Falck-Ytter and colleagues (2013) identified a single reference point in their stimuli of two children interacting with a toy and calculated the distance from that reference point to each individual child’s fixation over the course of their semi-naturalistic stimuli. Distance to the reference distinguished between children with ASD and controls and was associated with communication scores on the Vineland Adaptive Behavior Scales (Sparrow, 2011) and verbal IQ on the Wechsler Preschool and Primary Scale of Intelligence (Wechsler, 2002). Though this approach significantly improved upon the interpretability issue of Nakano et al. (2010)’s method, it requires that the areas of interest be at consistently different distances from the reference point, thus limiting the type of stimuli one can use with this approach.
Lönnqqvist and colleagues (2017) expanded on these approaches by calculating the distance from each of a number of targets and identifying moments of group differences in distance from each of those targets across the length of their videos. The stimuli had been designed to assess for comprehension of pragmatically complex scenes in adolescents with ASD and the authors identified correlations between distance from specific targets and scores on the verbal tasks administered to assess comprehension.
In recent work, Wang and colleagues (2018) incorporated the use of high-cohesion time frames (HCTF) as a method for analyzing time course eye-tracking data in ASD. Using stimuli involving a woman engaged in dyadic bids, sandwich-making, joint attention, and moving-toy conditions, the authors identified points in the video at which the 163 typically developing toddlers tended to focus on the same area. They then used the median fixation point among the typically developing controls as a “typical” fixation for that HCTF. Distance of the fixations of 112 toddlers with ASD and 36 developmentally delayed controls from the typical fixations during HCTFs were then calculated to determine “typicality” of the participant’s scan path. As was true of Nakano et al. and Flack-Ytter’s approaches, distance from the typical fixations during HCTFs distinguished between groups and was related to ASD symptom severity as measured by the Autism Diagnostic Observation Schedule, Second Edition (ADOS-2). While this approach has the advantage of interpretability of typical path and generalizability across stimuli, it too has its limitations. Specifically, this approach precludes analysis in contexts in which scan paths might shift back and forth between two points, as in the joint attention condition. Because a typical path in a joint attention bid shifts between the speaker’s face and an object, joint attention bids were excluded from the analysis because no cohesion was observed during these segments. Given the relevance of joint attention for the development of communication and known impairments in joint attention among children with ASD (Charman, 2003; Dawson et al., 2004; Mundy, Sigman, & Kasari, 1990), this is a rather significant limitation.
Drawing on the strengths of each of these efforts to use time-course data in eye-tracking studies of ASD, in the current study, we took a different analytic approach. We first calculated the mean fixation point of a group of typically developing participants frame-by-frame over the course of our 180 second video stimuli. We then measured the distance between the fixation of each participant with ASD and the mean TD fixation over the course of the videos. This approach had a number of advantages. First, mean fixation location is intuitively interpretable. Second, mean location of the typical gaze pattern inherently provides a measure of coherence because only when there is coherent typical fixation in a given location on the screen will the typical path veer from the center of the screen (which in the current stimuli had no meaningful content). In cases where there is coherent typical gaze in a particular region, the mean fixation shifts to that region and fixations that are far from that location are indicative of aberrant scan paths. At times without a coherent fixation, the typical gaze is centralized, thereby limiting the potential distance of any other fixation. A third advantage of this approach is that mean fixation allows for interpretable results even in situations when typical gaze might be expected in one of multiple locations (e.g., the face or object in a joint attention bid).
In the current study, we used this mean distance from a typical scan path approach to better quantify what constitutes a typical path and to determine whether symptoms of ASD may be related to distance from that path. We segmented the video stimuli based on what was happening in the scene, isolating scenes with rich social and sensory content because we anticipated that scene content would dictate gaze patterns. We hypothesized that greater ASD symptomology would be associated with greater distance from the typical scan path, and that associations with symptomatology would differ depending on scene content.
METHODS
All caregivers/legal guardians of participants gave written, informed consent, and the study protocol was approved by the Duke University Health System Institutional Review Board. Methods were carried out in accordance with institutional, state, and federal guidelines and regulations.
Participants
ASD participants.
Data were drawn from 176 participants with ASD who participated in a clinical trial. This was part of a single site, prospective, randomized, double-blind, parallel group study of a single intravenous autologous or allogeneic, unrelated cord blood (CB) infusion in children aged 2–7 years. The trial was conducted under IND #15949. Only data from the baseline visit, which were collected before infusions, were used in this analysis. Clinical diagnosis of ASD was based on the Diagnostic and Statistical Manual of Mental Disorders, Fifth Edition (DSM-5) (American Psychiatric Association, 2013), and established by reliable clinical researchers using the Autism Diagnostic Observation Schedule, Second Edition (ADOS-2) (Lord et al., 2012) and the Autism Diagnostic Interview, Revised (ADI-R) (Le Couteur, Lord, & Rutter, 2003). Additional inclusion criteria included (1) stability on current medications for at least 2 months prior to the infusion, (2) participants and parents/guardians were English speaking, and (3) availability of autologous umbilical cord blood unit or ≥4/6 HLA-matched allogeneic unrelated umbilical cord blood unit from the Carolinas Cord Blood Bank. Exclusion criteria included (1) a history of prior cell therapy, (2) use of intravenous immunoglobulin (IVIG) or other anti-inflammatory medications (with the exception of NSAIDs), (3) known genetic syndrome (e.g., Fragile X), presence of dysmorphic features, pathogenic mutation or copy number variation associated with ASD, and/or other significant medical and/or psychiatric comorbidity, (4) obvious physical dysmorphology, (5) an uncontrolled seizure disorder, (6) significantly impaired renal or liver function, (7) known active CNS infection, evidence of uncontrolled infection, and/or HIV positivity, (8) family unwilling or unable to commit to study-related assessments, and/or (9) clinically significant abnormalities in complete blood count.
Twenty-one subjects with ASD were excluded due to behavioral non-compliance with eye-tracking study procedures, poor calibration, and technical failures. Included participants were 155 children with ASD (122 males, 33 females) between 27 and 95 months of age (mean=65.65, SD=19.73). Because the TD sample described below included children who were younger than the participants with ASD, a reduced sample of 93 participants who fell within the age range of the TD comparison sample of 36 to 72 months (72 males, 21 females) (M = 51.88 months, SD = 11.92) were included in a separate analysis. Demographics for both the full and age-matched samples are shown in Table 1.
Table 1:
Demographic information for participants.
| Full Sample ASD (N=155) | Age-matched ASD (N=93) | Typically Developing (N=40) | |
|---|---|---|---|
|
| |||
| Age (months) | |||
| Mean (SD) | 65.65 (19.73)* | 51.88 (11.92) | 49.95 (10.51) |
| Sex | |||
| Female | 33 | 21 | 17 |
| Male | 122 | 72 | 23 |
| Ethnicity/Race | |||
| Minority | 53 | 28 | 24 |
| Non-Minority | 102 | 65 | 16 |
| NVDQ | |||
| Mean (SD) | 76.47 (21.03)* | 73.25 (19.99)* | 118.47 (16.02) |
| ADOS-2 Severity Score | |||
| Mean (SD) | 7.99 (1.65) | 7.90 (1.57) | |
ASD participants in the full sample were significantly older than TD participants, t(118) = 6.84, p < .01. Ages were not significantly different between age-matched ASD participants and TD participants, t(83) = .93, p = .18. TD participants had significantly higher Nonverbal Developmental Quotient (NVDQ) than both the full ASD group, t(105) = 14.34, p <.01, and the age-matched sample, t(91) =14.39, p <.01.
TD participants.
Forty-five children between the ages of 36 and 72 months who did not have a diagnosis or suspected diagnosis of ASD were recruited from the community and the Duke Center for Autism and Brain Development research registry to participate in a study of preschool age children with and without autism. Children were eligible to be in the TD control group if they had scores on the Strengths and Difficulties Questionnaire (SDQ) that were within the normal range for all scales. The SDQ is a parent-report screening tool for measuring internalizing and externalizing difficulties in children (Goodman, 1997, 2001; Goodman, Ford, Simmons, Gatward, & Meltzer, 2000). Exclusion criteria for this group included having (1) a biological sibling or parent diagnosed with ASD or developmental delay (DD), (2) a genetic disorder (e.g., Fragile X), (3) vision or hearing problems, (4) a significant motor impairment (e.g., cerebral palsy), (5) chronic or acute medical illness, and (5) a seizure in the last year, a seizure disorder, or being on medication for seizures. Five TD participants were excluded due to non-compliance and calibration failures. Included participants were 40 children without ASD (23 males, 17 females) (M age = 49.95 months, SD = 10.51, range = 36 to 70 months).
Clinical Measures (ASD participants only)
Cognitive Assessments.
Depending upon the age and verbal ability of the child, one of two measures was used to estimate IQ: the Mullen Scales of Early Learning (Mullen, 1995) or the Differential Ability Scales, Second Edition (DAS-II) (Elliott, 2007). Given the use of two measures, in lieu of standard scores, a nonverbal developmental quotient (NVDQ) was calculated for each participant as nonverbal age equivalent scores/chronological age.
Vineland Adaptive Behavior Scales-3.
The Vineland Adaptive Behavior Scales-3 (VABS-3; Sparrow, Cicchetti, & Saulnier, 2016) is a well-standardized measure with strong reliability and validity which yields an overall composite score, as well as subscale standard scores in the following domains: Socialization, Communication, Daily Living Skills, and Motor Skills. The VABS-3 was administered as a caregiver interview with the primary caregiver.
Aberrant Behavior Checklist-Community (ABC-C).
This parent-completed rating scale was used to measure aberrant behaviors associated with ASD (Aman, Singh, Stewart, & Field, 1985). This measure yields a composite score as well as subscale scores in the following domains: Irritability, Lethargy, Stereotypy, Hyperactivity, and Inappropriate speech.
Autism Diagnostic Interview-Revised.
The Autism Diagnostic Interview-Revised (ADI-R; Le Couteur et al., 2003) is a standardized, semi-structured, interview administered by trained clinicians to parents or caregivers of individuals referred for a possible autism spectrum disorder (ASD). The ADI-R includes 93 items in three domains of functioning: communication, reciprocal social interactions, and restricted, repetitive, and stereotyped patterns of behavior.
Expressive One Word Picture Vocabulary Test-4.
The Expressive One Word Picture Vocabulary Test 4 (EOW) (EOWPVT-4; Martin & Brownell, 2011) is a clinician-administered assessment which measures an individual’s ability to match a spoken word with an image of an object, action, or concept.
Pervasive Developmental Disorder Behavior Inventory.
The Pervasive Developmental Disorder Behavior Inventory (PDD-BI; Cohen, Schmidt-Lackner, Romanczyk, & Sudhalter, 2003) is a caregiver questionnaire that is designed to measure symptoms within domains affected by ASD. The PDD-BI was standardized with a sample of caregivers and teachers of children with ASD from a range of racial, ethnic, and socioeconomic backgrounds. The PDD-BI was collected from each participant’s primary caregiver.
Eye-tracking Procedures
A Tobii TX300 (Tobii, Danderyd, Sweden) was used to measure corneal reflections and calculate eye-gaze direction using infrared (IR) light-emitting diodes and IR cameras. Data were collected with a sampling rate of 120 Hz in Tobii Studio Version 3.2.2 using standardized room lighting and movie volume for all participants. Participants sat in their parents’ laps and watched a 3-minute video of an actor engaged in child-directed speech while surrounded by four distracter toys (Chawarska et al., 2013). A research assistant stood next to participants and monitored the track status throughout the experiment; when subjects moved out of the trackable range they were re-positioned immediately. Data were analyzed offline. Trials in which at least one eye was tracked and the gaze fell on the media frame were considered valid trials and were included in the analysis. The media region was defined as the entire video frame and did not extend to the edges of the screen.
Stimuli.
The video (Chawarska et al., 2012) displays a woman seated behind a table and flanked by a toy in each of the four corners of the screen. At the start of the video, the speaker greets the child (dyadic bid) and then proceeds to make a sandwich (sandwich). She then shifts between speaking directly into the camera in child directed speech and making gaze shifts to each of the four toys (joint attention). Following the dyadic bid/joint attention phase, she briefly returns to sandwich making. Finally, the speaker shifts her gaze back to each of the four toys in succession, but during these joint attention phases, a distractor toy is activated in a location that differs from where the speaker is looking (moving toys).
Analytic Strategy
Statistical analyses were performed using RStudio version 3.5.1 (2018–07-02) (RStudio, Boston, MA, USA). Our first goal was to establish a typical scan path for individuals watching the 180 second stimuli. This was completed within the TD and ASD groups and plotted as mean fixations by group overlain onto the video stimuli. This video can be viewed in supplemental materials. A qualitative description of these scan paths is provided in results below.
RESULTS
Descriptive Results of Mean Location
For descriptive purposes, sample scene captures from the video with representative fixations by group are shown in Figure 1. Fixations tended to fall on the speaker’s mouth when she was speaking during dyadic bids (Figure 1a) and on her hands and the items she manipulated when she was making a sandwich (Figure 1b). During joint attention segments, mean fixations fell midway between the speaker and the toys she referenced (Figure 1c). When the toys began to move, both groups shifted their attention to the moving toy (Figure 1d). Very shortly after the onset of toy movement, gaze shifted between the speaker and the toy, resulting in mid-point fixations as in the joint attention conditions. These patterns held true for both groups.
Figure 1:
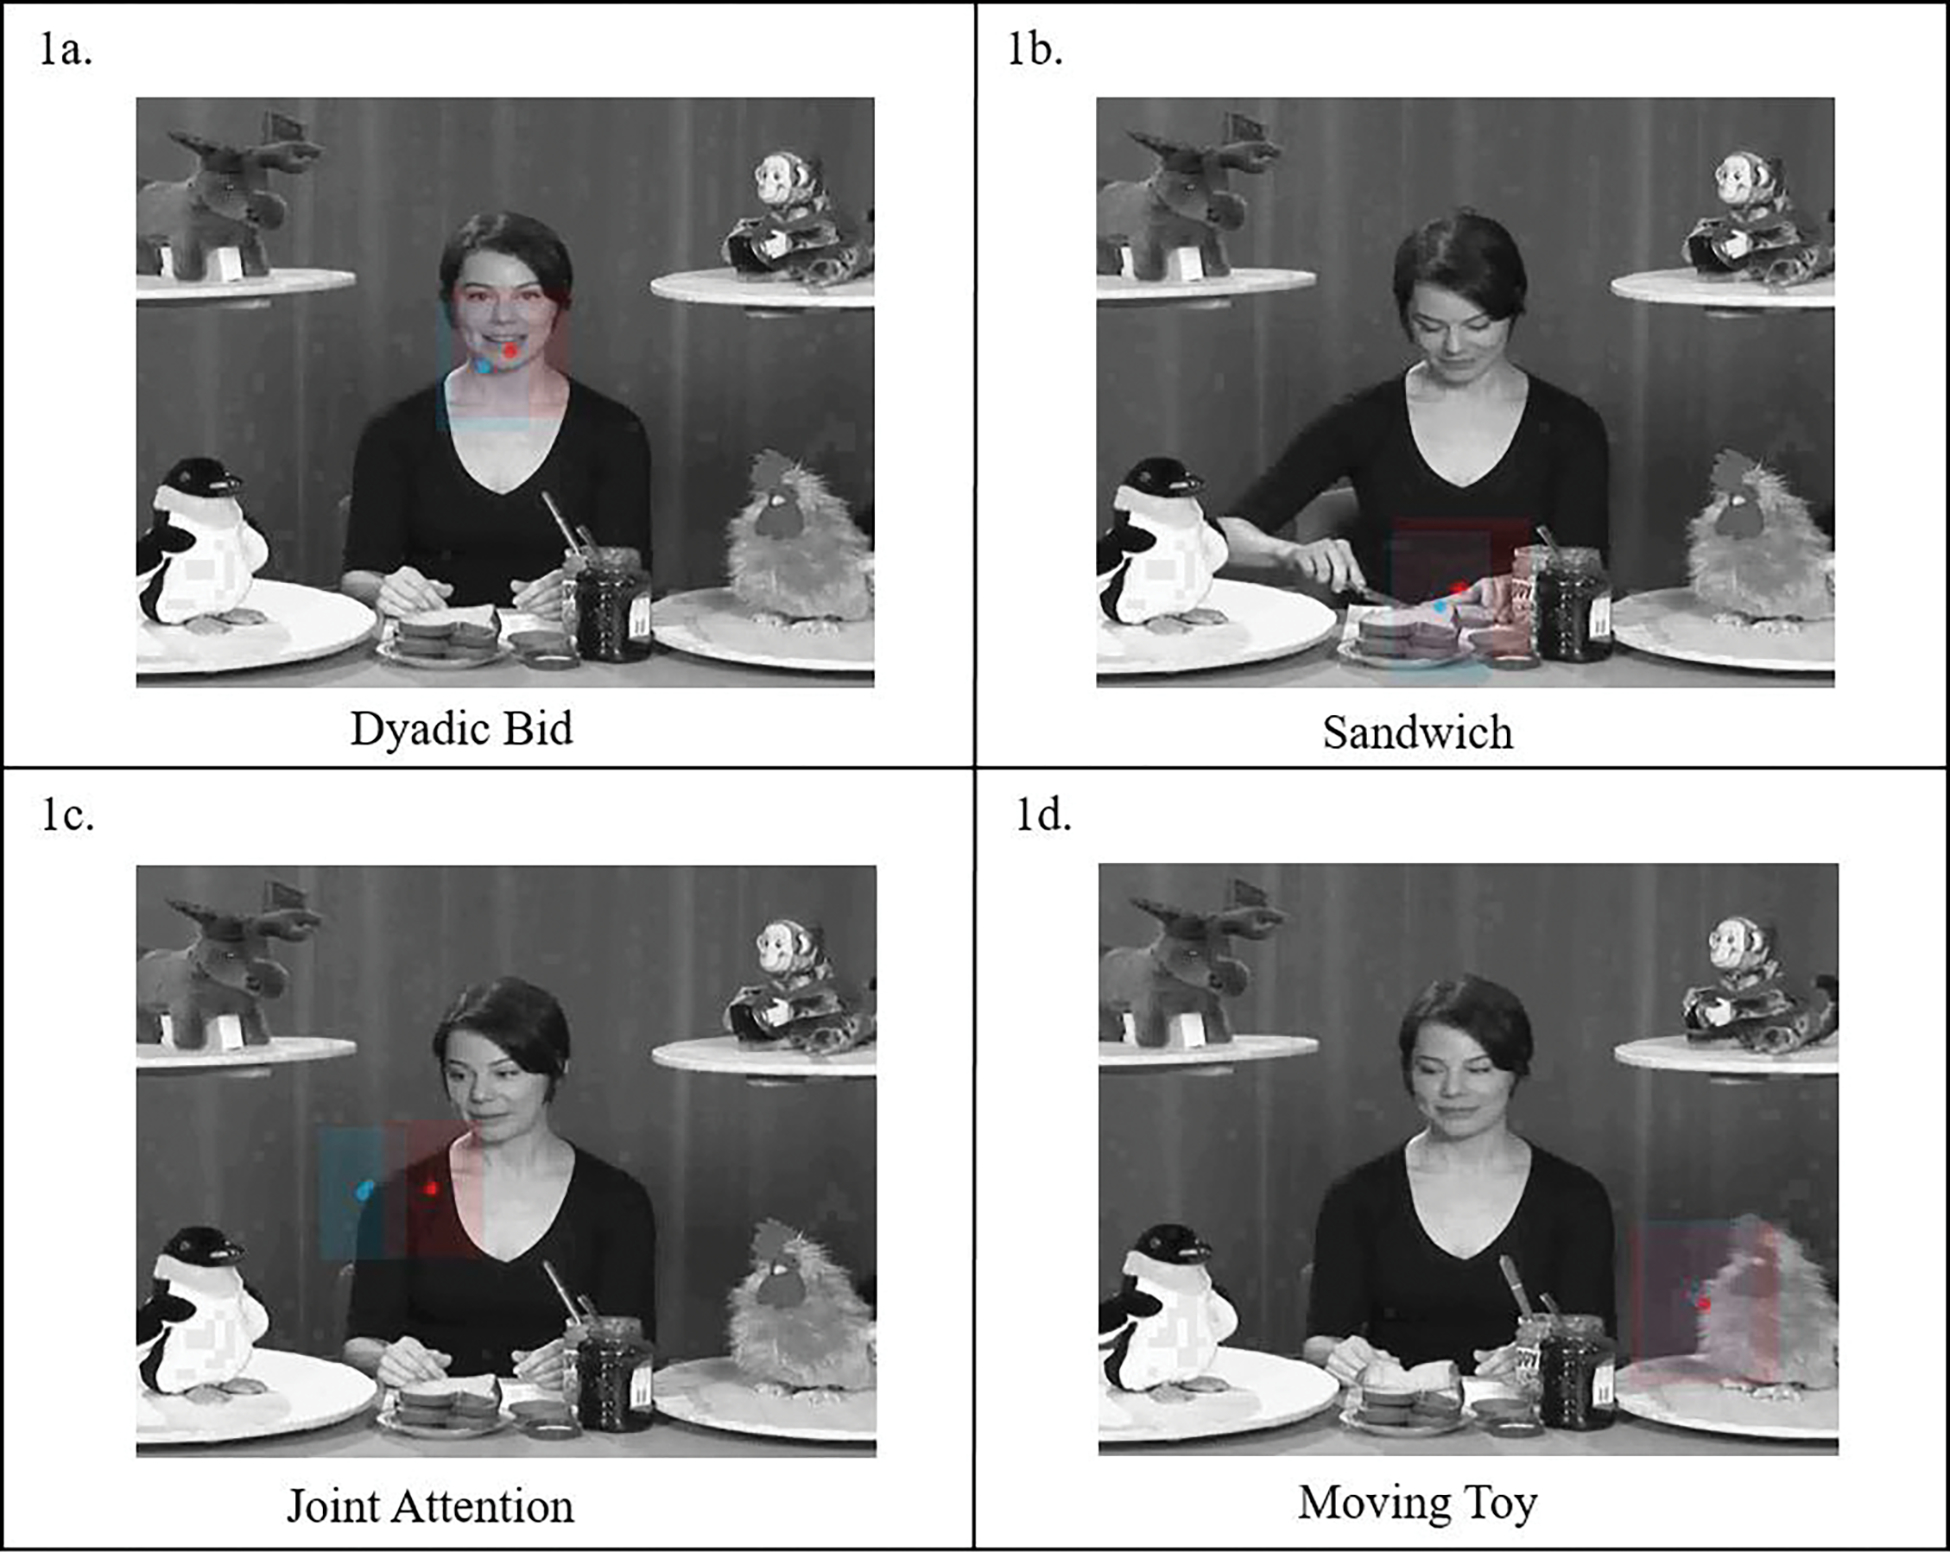
Screen captures from video during each of the four segment types. Mean TD path shown in blue, mean ASD path in red. Shaded red and blue regions show standard deviation.
Distance from Typical Scan Path Among ASD Participants
Our second goal was to determine the distance of each participant with ASD from the typical scan path. To do this, we calculated the mean of the typical scan path for each of the 21,600 frames collected over the 180 second video (120 frames/sec) for the 40 typically developing participants and then determined the distance between that mean typical fixation for each of those 21,600 frames for each of the 155 ASD participants. Using the distance for each ASD participant at each time point, we then calculated the effect of context on distance by averaging each participant’s distance within each of the four segment types: dyadic bids, joint attention, sandwich, and moving toys (see Figure 2). Analysis of variance revealed significant effects of segment type on distance from the typical scan path, F(3,616) = 47.17, p < .01. Post-hoc comparisons revealed no significant differences in distance between the joint attention and dyadic bid conditions (p = 1.0) but significant differences between dyadic bid and sandwich segments (p <.01) and dyadic bid and moving toy segments (p <.01). Joint attention segments were also significantly different from sandwich (p <.01) and moving toy segments (p =.01). Finally, sandwich and moving toy segments were significantly different from each other (p <.01).
Figure 2:
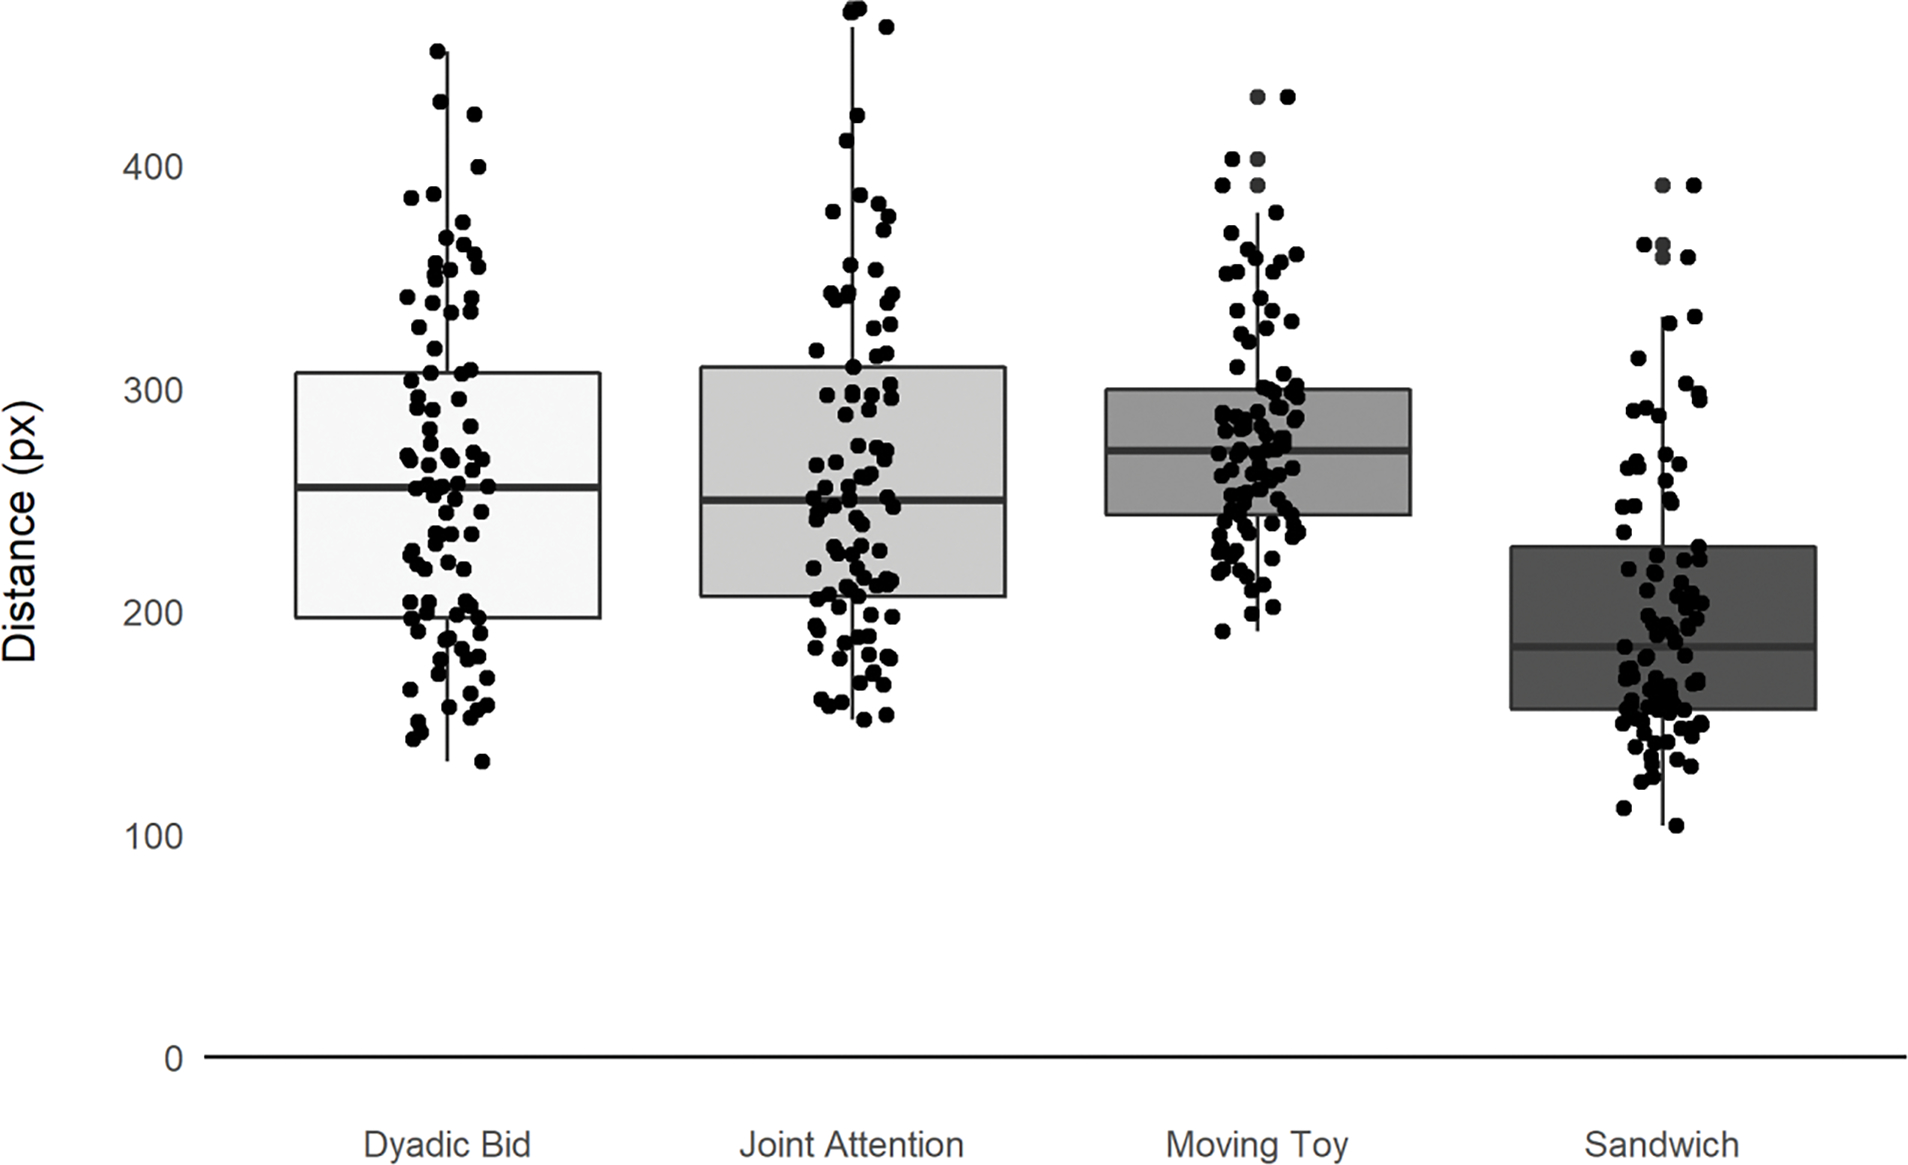
Mean distance for ASD participants from “typical” scan path by video segment.
To explore the distance from the typical path at a more granular time course level, we next plotted the mean distance across the 155 participants with ASD from the typical scan path (see Figure 3). Figure 3 shows that at the start of the four moving toy segments towards the end of the presentation, there are brief periods when the toy is activated when distance from the typical scan path across participants was quite short (valleys) followed by dispersion in fixations resulting in greater average distances for the latter portion of each of these blocks (peaks). These patterns highlight the importance of time course data for understanding how context affects social attention.
Figure 3:
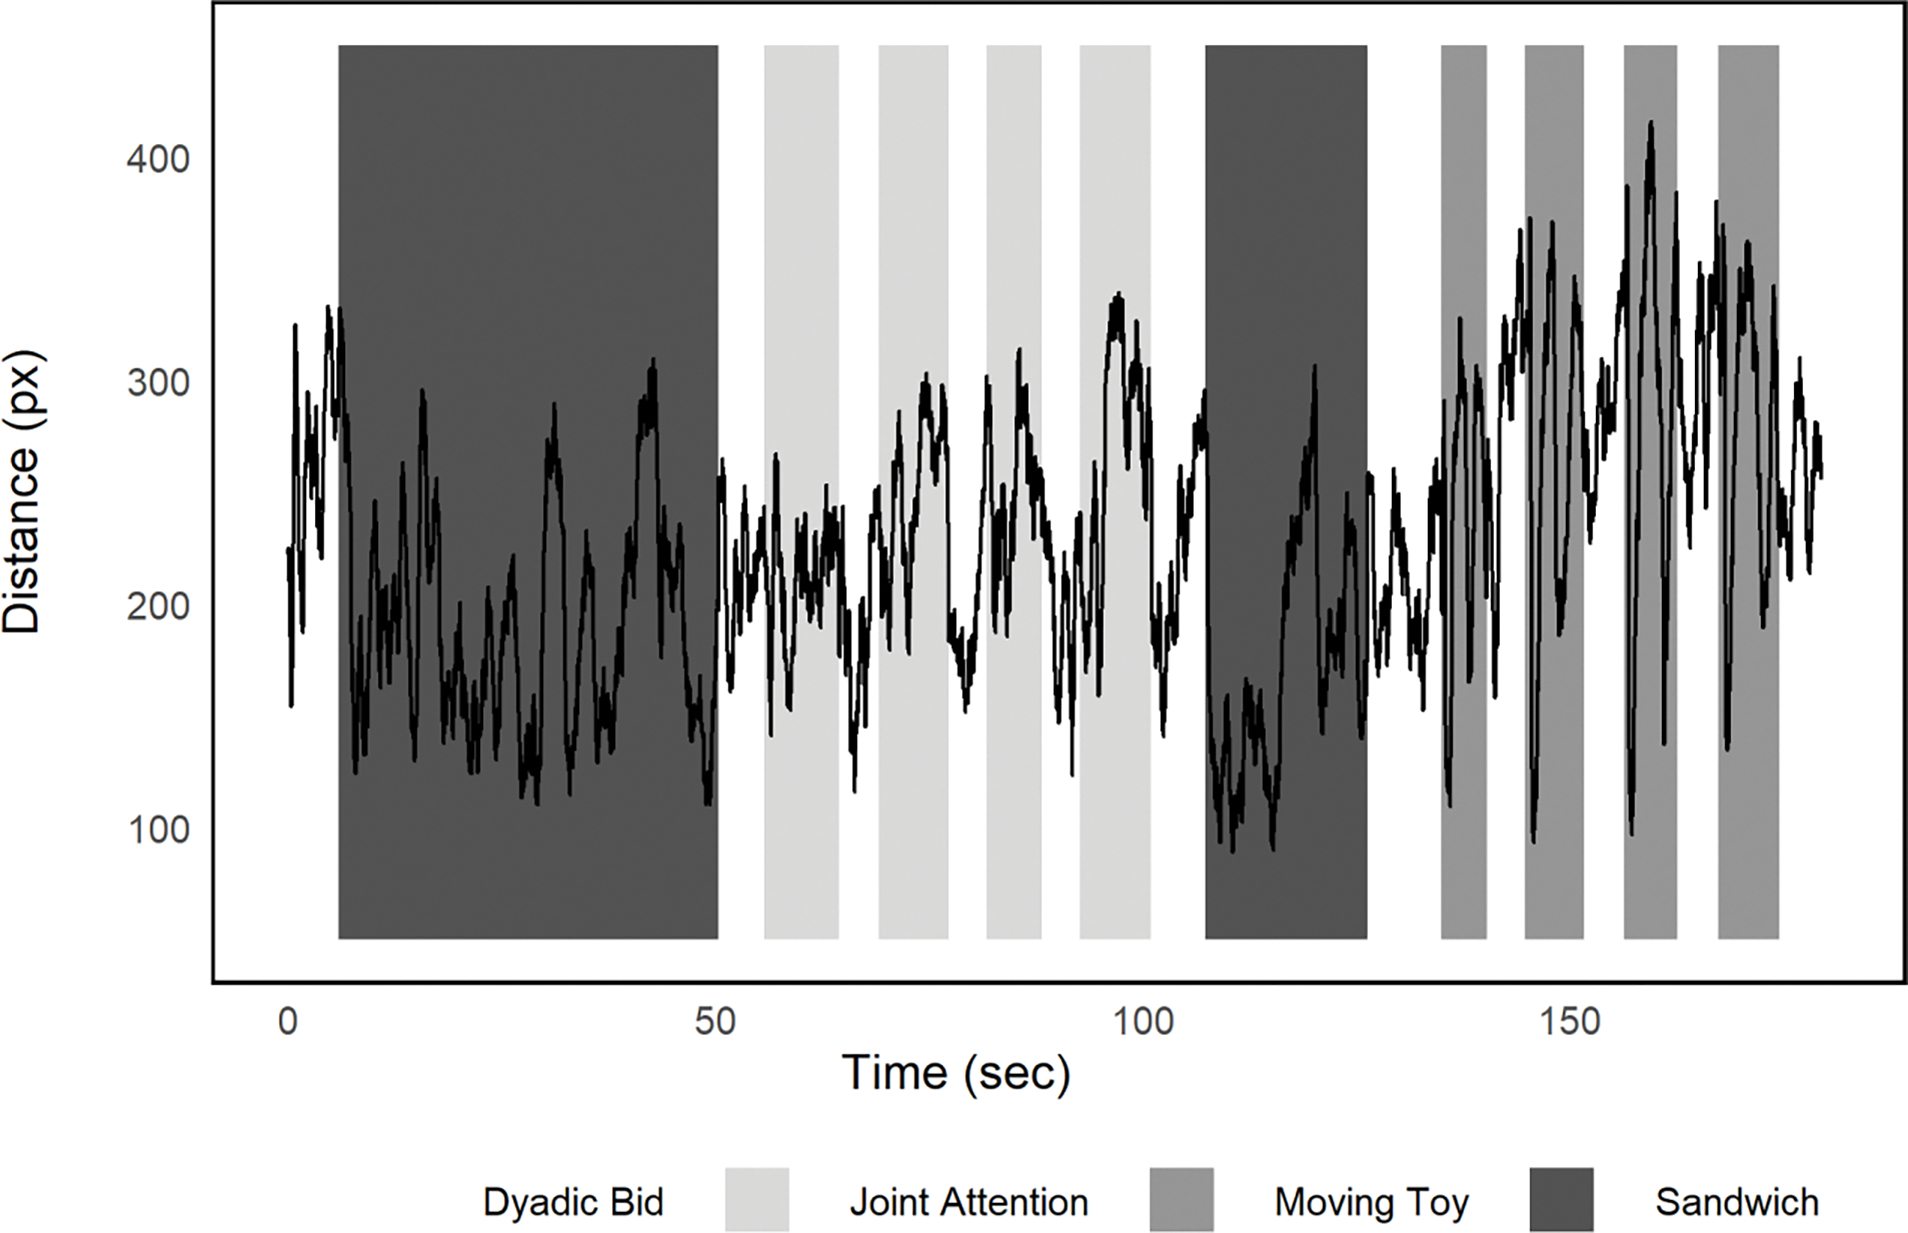
Mean distance from “typical” scan path averaged across ASD participants over the 180 second video.
Correlations with Clinical Measures
To determine whether distance from a typical scan path is related to autism symptomology, we next examined correlations between the mean distance overall and within each of the four segment types (dyadic, joint attention, sandwich, and moving toys) for each of the participants. As described above, adaptive behavioral skills and autism symptomology were assessed with clinical measures including VABS-3, ADOS-2, ABC, PDDBI and ADI-R. Because this approach was exploratory in nature, we did not control for multiple comparisons. As in Murias et al. (2018), we did control for both age of the participant and nonverbal IQ (in this case, NVDQ as described above). Age and NVDQ were both independently negatively correlated with mean distance (age: r(155) = −.35, p <.001; NVDQ: r(155) = −.29, p <.001). Mean distance from the typical scan path decreased as age and NVDQ increased. Results of the partial correlations are shown in Table 2a.
Table 2a:
Partial correlations controlling for age and NVDQ for mean distance overall and mean distance within each segment type for full sample of ASD participants (n = 155).
| Overall Distance | Dyadic | Joint Attention | Sandwich | Moving Toys | ||
|---|---|---|---|---|---|---|
| VABS-3 | Communication | −.19 * | −.16 * | −.10 | −.11 | −.24 ** |
| Socialization | .09 | −.11 | −.12 | .01 | −.05 | |
| Daily Living Skills | −.01 | −.03 | .01 | −.00 | −.01 | |
| Motor | .00 | −.10 | .03 | .05 | .04 | |
| Adaptive Behavior Composite | −.14+ | −.13 | −.10 | −.06 | −.15+ | |
| ADOS-2 | Calibrated Social Affect | .11 | .19 * | .15+ | .01 | −.16 * |
| Calibrated Restricted/Repetitive Behaviors | .03 | .04 | .11 | −.02 | .06 | |
| Calibrated Severity Scores | .14+ | .20 * | .18 * | .01 | −.08 | |
| ABC | Inappropriate Speech | −.02 | −.04 | .08 | −.05 | −.01 |
| Irritability | .08 | .09 | .13 | .01 | −.06 | |
| Hyperactivity | .09 | .05 | .10 | .06 | −.01 | |
| Lethargy | .33 ** | .26 ** | .34 ** | .20 * | .19 * | |
| Stereotypy | .18 * | .11 | .22 ** | .13 | .05 | |
| ABC-Total | .19 * | .14+ | .23 ** | .10 | .04 | |
| ‘ADI-R | Reciprocal Social Interaction | .17 * | .11 | .18 * | .13 | .10 |
| Verbal Communication | −.08 | −.10 | .02 | −.09 | .03 | |
| Nonverbal Communication | −.04 | −.10 | .13 | .03 | −.16 | |
| Restricted-Repetitive Behaviors | −.01 | .00 | −.11 | .03 | .03 | |
| PDDBI | Repetitive, Ritualistic, and Pragmatic Composite | .08 | −.01 | .08 | .12 | −.02 |
| Approach/Withdrawal Composite | .08 | −.04 | .07 | .14+ | .01 | |
| Expressive Social Communication Composite | −.23 ** | −.22 ** | −.15+ | −.14+ | −.10 | |
| Receptive/Expressive Social Communication Composite | −21 ** | −.20 * | −.15+ | −.13+ | −.09 | |
| Autism Composite | .14+ | .07 | .12 | .14+ | .01 | |
| EOW Standard Score | −.03 | .07 | −.07 | .03 | .10 | |
=p <.05
p<.01
With respect to adaptive behavior skills as measured by VABS-3, Communication scores were significantly negatively correlated with distance overall, distance during dyadic segments, and distance during moving toy segments after controlling for age and NVDQ. Socialization, Daily Living, Motor skills, and overall Adaptive Behavior Composite Scores from the VABS-3 were not correlated with distance after controlling for age and NVDQ. This suggests that ASD participants with less typical gaze (greater distance in scan paths from the typical participants) also showed lower levels of communication skills. This relation was specific to the dyadic and moving toy segments.
ASD symptomatology was assessed using ADOS-2, ABC, ADI-R and PDDBI. After controlling for age and NVDQ, mean distance during the dyadic segments was correlated with calibrated social affect scores from ADOS-2 and calibrated severity scores overall but not with restricted/repetitive behaviors. Distance during the joint attention segments was also significantly correlated with overall calibrated severity scores from the ADOS-2 after controlling for age and NVDQ. This suggests that greater distance from the typical scan path during the more social segments of the stimuli specifically (joint attention and dyadic bids) was related to greater social communication impairments as measured by the ADOS-2. In contrast, there was a negative correlation between distance from the typical scan path during moving toy segments and ADOS-2 social affect scores suggesting that greater distance from the scan path during the moving toy segments was associated with lower ASD symptomatology in the social affect domain. This stands in contrast to the finding above that VABS-3 Communication scores were negatively correlated with distance from the scan path (where higher VABS-3 scores indicate better communication and higher ADOS-2 scores indicate greater impairment).
On the ADI-R, reciprocal social interaction was correlated with both overall distance and distance during joint attention segments after controlling for age and NVDQ. Finally, PDD-BI composite scores on both expressive and receptive communication were negatively correlated with distance from the typical scan path overall and during the dyadic bids. This suggests that children who were further from the typical scan path had more symptoms associated with ASD on these communication scales. No significant correlations emerged between distance from the typical scan path and scores on the EOW.
On the ABC, the Lethargy/Social Withdrawal subscale was significantly correlated with overall distance and distance within each of the four segments (dyadic, joint attention, sandwich, and moving toys). Stereotypy and Total scores from the ABC were also correlated with overall distance and distance during joint attention segments after controlling for age and NVDQ. The ABC Lethargy/Social Withdrawal subscale includes the following survey items: listless, sluggish, seeks isolation, preoccupied, withdrawn, fixed facial expression(s), sits and watches others, resists physical contact, isolates self, sits/stands in one position, unresponsive to structured activity, difficult to reach/contact, prefers to be alone, communicates without words/gestures, inactive, responds negatively to affection, and shows few social reactions. This suggests that children with less typical scan paths were also more likely to display these behaviors.
Comparison with Clinical Measures for Age-matched Participants
Because the children with ASD were significantly older than the TD comparison sample and distance was significantly correlated with age, we reran the correlations using a subset of the ASD sample that were age-matched to the TD sample. The following partial correlations between distance and clinical measures remained significant after controlling for NVDQ and age. Communication scores on the VABS-3 remained significantly negatively correlated with distance on the Moving Toys segments, suggesting that greater distance was associated with lower communication abilities. Social affect and calibrated severity scores on the ADOS-2 were again significantly positively correlated with distance from the typical scan path during the dyadic segments suggesting that overall autism severity was associated with greater distance. Lethargy on the ABC also remained significantly positively correlated with distance overall and on the dyadic, joint attention and sandwich segments. Finally, expressive social communication, as measured by the PDD-BI, was significantly negatively correlated with overall distance (see Table 2b) suggesting that lower communication ability is associated with greater distance from the typical scan path.
Table 2b:
Partial correlations controlling for age and NVDQ for mean distance overall and mean distance within each segment type for age-matched sample (n = 93).
| Overall Distance | Dyadic | Joint Attention | Sandwich | Moving Toys | ||
|---|---|---|---|---|---|---|
| VABS-3 | Communication | −.14 | −.11 | −.07 | −.08 | −.23 * |
| Socialization | −.07 | −.09 | −.14 | .00 | −.03 | |
| Daily Living Skills | −.01 | −.09 | .00 | .08 | .01 | |
| Motor | .00 | −.16 | .06 | .09 | .13 | |
| Adaptive Behavior Composite | −.10 | −.10 | −.08 | −.03 | −.13 | |
| ADOS-2 | Calibrated Social Affect | .17 | .23 * | .20+ | .03 | −.16 |
| Calibrated Restricted/Repetitive Behaviors | .11 | .05 | .17 | .07 | .10 | |
| Calibrated Severity Scores | .20+ | .24 * | .20+ | .07 | −.06 | |
| ABC | Inappropriate Speech | .00 | .00 | .09 | −.03 | .03 |
| Irritability | .10 | .17 | .12 | −.01 | −.07 | |
| Hyperactivity | .12 | .10 | .09 | .12 | −.09 | |
| Lethargy | .30 ** | .23 * | .30 ** | .23 * | .08 | |
| Stereotypy | .17+ | .12 | .19+ | .11 | .10 | |
| ABC-Total | .20+ | .18+ | .20+ | .12 | −.01 | |
| ‘ADI-R | Reciprocal Social Interaction | .13 | .10 | .17 | .11 | .04 |
| Verbal Communication | −.16 | −.12 | −.03 | −.20 | .06 | |
| Nonverbal Communication | −.06 | −.14 | .08 | .04 | −.18 | |
| Restricted-Repetitive Behaviors | −.07 | −.08 | −.17+ | .03 | −.02 | |
| PDDBI | Repetitive, Ritualistic, and Pragmatic Composite | −.02 | −.07 | −.02 | .06 | −.11 |
| Approach/Withdrawal Composite | .00 | −.08 | −.02 | .07 | −.07 | |
| Expressive Social Communication Composite | −.21 * | −.19+ | −.14 | −.14 | −.10 | |
| Receptive/Expressive Social Communication Composite | −.18+ | −.17 | −.13 | −.11 | −.06 | |
| Autism Composite | .06 | .00 | .03 | .11 | −.08 | |
| EOW Standard Score | −.06 | .11 | −.08 | .04 | .10 |
=p <.05
p<.01
DISCUSSION
In the current study, we used the mean scan path of a group of typically developing children to determine the time course of typical fixations while watching videos of a woman engaging in social and nonsocial behaviors. We then calculated the distance for each of 155 participants with ASD from that typical scan path over the 180-second-long video. Overall, distance was lowest during the sandwich making segments of the video when participants tended to cluster attention on the speaker’s hands and the objects she was manipulating. Interestingly, though one might expect from watching the video (see supplemental materials) that moving toy segments would show the least distance given the convergence on the salient movement, moving toy segments in fact had the greatest distance from the typical scan path for ASD participants. Examination of the video reveals that while the initial operation of the toys resulted in a highly coherent shift to the moving toys among all participants, gaze behavior after that moment was highly variable. This may be due to the fact that the speaker was engaged in a joint attention bid to a different toy during these periods; some children may have responded to this bid and moved their gaze to the new toy. It is also possible that some children may have become over-stimulated by the activated toys and removed their gaze due to an inability to maintain attention during moments of intense audio-video synchrony. Alternatively, because these events occurred towards the end of the trial, large distances in the latter half of these moving toy conditions may have been caused by drifting attention.
We also examined whether measures of mean distance from typical scan path were correlated with clinical assessments of adaptive behavior and autism symptomology. We found that mean distance from the typical scan path among ASD participants related to several aspects of behavior, including communication abilities as measured by VABS-3, social affect and overall severity scores measured by ADOS-2, lethargy, stereotypies and total scores from the ABC, reciprocal social interaction from ADI-R, and expressive and receptive social composite scores from PDD-BI. These results lend support to previous findings showing relations between eye-tracking data and behavioral measures including autism symptoms as assessed by the Autism Spectrum Quotient (Nakano et al., 2010), social and communication abilities as assessed using VABS-3, BASC, and PDD-BI (Murias et al., 2018), verbal abilities as assessed by WPPSI (Falck-Ytter, von Hofsten, et al., 2013), and social affect as measured by ADOS-2 (Wang et al., 2018).
Our finding that distance from the typical scan path is related to stereotypies as measured by ABC is novel. Unlike the relation between scan path and communication and social affect now demonstrated in a number of studies mentioned above, the associations between stereotypies and distance overall and during joint attention bids is novel and merits further investigation. Of note, this finding did not hold when the sample was more carefully age-matched. Also of interest was the relation between mean distance from the typical scan path and communication scores from VABS-3, which was driven in part by mean distance during the moving toy segments of the video. This may be because, as discussed above, some aspects of the moving toy conditions are akin to joint attention segments. Findings from the moving toys segment were also surprising in the seemingly contradictory findings that greater distance from the typical scan path is related to both lower scores on the VABS communication subscale (suggesting lower communication abilities) and lower autism severity from the ADOS-2 social affect domain (suggesting higher communication abilities). This again may be related to the initial coherence followed by dispersion in gaze paths during these segments. This also speaks to the challenges of collapsing across this segment of the trial in which high cohesion is observed when the toys begin moving (a cue that might be most salient for those with lower social abilities) followed by a more socially ambiguous segment in which most typically developing participants seem to shift gaze between the speaker and the objects.
In addition to replicating previous findings of relations between eye-tracking and behavioral measures and contributing novel results for future exploration in this domain, the current study adds to the extant literature by providing a generalizable and intuitive approach to calculating atypical scan path over dynamic stimuli. This approach takes into account the variation in what constitutes a typical scan path over time. It also provides an inherent measure of coherence by using mean fixations which tend to converge in the center of the screen when there is a lack of coherent gaze among the typical participants. Finally, and crucially, this approach captures variability in scan paths even when there is not one single coherent point of gaze, as in joint attention bids.
There are a number of limitations to the approach used in this study. First, though it is our aim to incorporate time-course data at the frame level, in comparing distance to behavioral measures, we did collapse the distance measure over the course of the trial. Second, the stimuli used in this study did not to contain much relevant information in the center of the screen, thus allowing for default means in a region of little interest and creating a convenient proxy for coherence in gaze patterns. This limits potential use of this approach to stimuli without areas of interest in the center of the screen. Third, the groups with ASD and typical development were not perfectly matched for age and cognitive function. We handled this by controlling for these factors in our analyses. Finally, with respect to the relation between mean distance and clinical outcomes, the lack of correction for multiple comparisons means that replication will be critical to confirm these preliminary findings.
As the field moves towards early screening for ASD using automated measures that can be assessed at a large scale, eye-tracking is likely to gain further appeal. The current approach provides a generalizable analytic method that lends itself well to big data and automated screening that may contribute in the future to the utility of these methods for identifying children at risk for ASD.
Supplementary Material
Video shows the full stimulus overlain with the mean fixations frame-by-frame. Blue indicates the mean for the TD group. Red indicates mean fixation for the ASD participants.
Acknowledgements:
This research was supported by grants from NICHD P50HD093074, the Marcus Foundation, and a NARSAD Young Investigator Grant from the Brain & Behavior Research Foundation (#23807). We thank Fred Shic, PhD for his input on this work.
Footnotes
Conflict of Interest: Dr. Dawson is on the Scientific Advisory Boards of Janssen Research and Development, Akili, Inc, LabCorp, Inc, Roche Pharmaceutical Company, and Tris Pharma, and is a consultant to Apple, Gerson Lehrman Group, Guidepoint, Inc, Axial Ventures, Teva Pharmaceutical, and is CEO of DASIO, LLC. Dr. Dawson has received book royalties from Guilford Press, Oxford University Press, Springer Nature Press. In addition, Dr. Dawson has the following patent applications: 1802952, 1802942, 15141391, and 16493754. Dawson and Carpenter helped develop technology for early screening for ASD. The technology has been licensed and Dawson, Carpenter, and Duke University have benefited financially. Dr. Howard reports personal fees from Roche.
REFERENCES
- Aman MG, Singh NN, Stewart AW, & Field CJ (1985). The aberrant behavior checklist: a behavior rating scale for the assessment of treatment effects. American journal of mental deficiency. [PubMed] [Google Scholar]
- American Psychiatric Association. (2013). Diagnostic and statistical manual of mental disorders (5th ed.). Arlington, VA: American Psychiatric Publishing. [Google Scholar]
- Charman T (2003). Why is joint attention a pivotal skill in autism? Philosophical transactions of the Royal Society of London. Series B, Biological sciences, 358(1430), 315–324. doi: 10.1098/rstb.2002.1199 [DOI] [PMC free article] [PubMed] [Google Scholar]
- Chawarska K, Macari S, & Shic F (2012). Context modulates attention to social scenes in toddlers with autism. Journal of child psychology and psychiatry, 53(8), 903–913. doi: 10.1111/j.1469-7610.2012.02538.x [DOI] [PMC free article] [PubMed] [Google Scholar]
- Chawarska K, Macari S, & Shic F (2013). Decreased Spontaneous Attention to Social Scenes in 6-Month-Old Infants Later Diagnosed with Autism Spectrum Disorders. Biological Psychiatry, 74(3), 195–203. doi: 10.1016/j.biopsych.2012.11.022 [DOI] [PMC free article] [PubMed] [Google Scholar]
- Chawarska K, Ye S, Shic F, & Chen L (2015). Multilevel Differences in Spontaneous Social Attention in Toddlers With Autism Spectrum Disorder. Child development. [DOI] [PMC free article] [PubMed] [Google Scholar]
- Chevallier C, Parish-Morris J, McVey A, Rump KM, Sasson NJ, Herrington JD, & Schultz RT (2015). Measuring social attention and motivation in autism spectrum disorder using eye-tracking: Stimulus type matters. Autism Research, 8(5), 620–628. [DOI] [PMC free article] [PubMed] [Google Scholar]
- Chita-Tegmark M (2016). Social attention in ASD: a review and meta-analysis of eye-tracking studies. Research in developmental disabilities, 48, 79–93. [DOI] [PubMed] [Google Scholar]
- Cilia F, Aubry A, Le Driant B, Bourdin B, & Vandromme L (2019). Visual Exploration of Dynamic or Static Joint Attention Bids in Children With Autism Syndrome Disorder. Frontiers in psychology, 10. [DOI] [PMC free article] [PubMed] [Google Scholar]
- Cohen IL, Schmidt-Lackner S, Romanczyk R, & Sudhalter V (2003). The PDD Behavior Inventory: a rating scale for assessing response to intervention in children with pervasive developmental disorder. Journal of autism and developmental disorders, 33(1), 31–45. [DOI] [PubMed] [Google Scholar]
- Constantino JN, Kennon-McGill S, Weichselbaum C, Marrus N, Haider A, Glowinski AL, . . . Jones W (2017). Infant viewing of social scenes is under genetic control and is atypical in autism. Nature, 547(7663), 340. [DOI] [PMC free article] [PubMed] [Google Scholar]
- Dawson G, Toth K, Abbott R, Osterling J, Munson J, Estes A, & Liaw J (2004). Early social attention impairments in autism: social orienting, joint attention, and attention to distress. Developmental Psychology, 40(2), 271–283. doi: 10.1037/0012-1649.40.2.271 [DOI] [PubMed] [Google Scholar]
- 2004–11032-012 [pii]
- Elliott C (2007). Differential Ability Scales. San Antonio, TX: Harcourt Assessment. Canadian Journal of School Psychology, 22(1), 128–132. [Google Scholar]
- Elsabbagh M, Bedford R, Senju A, Charman T, Pickles A, Johnson MH, & Team B (2014). What you see is what you get: contextual modulation of face scanning in typical and atypical development. Social cognitive and affective neuroscience, 9(4), 538–543. [DOI] [PMC free article] [PubMed] [Google Scholar]
- Falck-Ytter T, Bölte S, & Gredebäck G (2013). Eye tracking in early autism research. Journal of neurodevelopmental disorders, 5(1), 28. [DOI] [PMC free article] [PubMed] [Google Scholar]
- Falck-Ytter T, von Hofsten C, Gillberg C, & Fernell E (2013). Visualization and analysis of eye movement data from children with typical and atypical development. Journal of autism and developmental disorders, 43(10), 2249–2258. [DOI] [PMC free article] [PubMed] [Google Scholar]
- Goodman R (1997). The Strengths and Difficulties Questionnaire: a research note. Journal of child psychology and psychiatry, 38(5), 581–586. [DOI] [PubMed] [Google Scholar]
- Goodman R (2001). Psychometric properties of the strengths and difficulties questionnaire. Journal of the American Academy of Child & Adolescent Psychiatry, 40(11), 1337–1345. [DOI] [PubMed] [Google Scholar]
- Goodman R, Ford T, Simmons H, Gatward R, & Meltzer H (2000). Using the Strengths and Difficulties Questionnaire (SDQ) to screen for child psychiatric disorders in a community sample. The British journal of psychiatry, 177(6), 534–539. [DOI] [PubMed] [Google Scholar]
- Guillon Q, Hadjikhani N, Baduel S, & Rogé B (2014). Visual social attention in autism spectrum disorder: Insights from eye tracking studies. Neuroscience & Biobehavioral Reviews, 42, 279–297. [DOI] [PubMed] [Google Scholar]
- Hanley M, McPhillips M, Mulhern G, & Riby DM (2013). Spontaneous attention to faces in Asperger syndrome using ecologically valid static stimuli. Autism, 17(6), 754–761. [DOI] [PubMed] [Google Scholar]
- Jones W, Carr K, & Klin A (2008). Absence of preferential looking to the eyes of approaching adults predicts level of social disability in 2-year-old toddlers with autism spectrum disorder. Arch Gen Psychiatry, 65(8), 946–954. doi: 10.1001/archpsyc.65.8.946 [DOI] [PubMed] [Google Scholar]
- Kennedy DP, D’Onofrio BM, Quinn PD, Bölte S, Lichtenstein P, & Falck-Ytter T (2017). Genetic influence on eye movements to complex scenes at short timescales. Current Biology, 27(22), 3554–3560. e3553. [DOI] [PMC free article] [PubMed] [Google Scholar]
- Klin A, Jones W, Schultz R, Volkmar F, & Cohen D (2002a). Defining and quantifying the social phenotype in autism. American Journal of Psychiatry, 159(6), 895–908. [DOI] [PubMed] [Google Scholar]
- Klin A, Jones W, Schultz R, Volkmar F, & Cohen D (2002b). Visual fixation patterns during viewing of naturalistic social situations as predictors of social competence in individuals with autism. Archives of general psychiatry, 59(9), 809–816. doi: 10.1001/archpsyc.59.9.809 [DOI] [PubMed] [Google Scholar]
- Le Couteur A, Lord C, & Rutter M (2003). The autism diagnostic interview-revised (ADI-R). Los Angeles, CA: Western Psychological Services, 659–685. [Google Scholar]
- Lönnqvist L, Loukusa S, Hurtig T, Mäkinen L, Siipo A, Väyrynen E, . . . Mattila M-L (2017). How young adults with autism spectrum disorder watch and interpret pragmatically complex scenes. The Quarterly Journal of Experimental Psychology, 70(11), 2331–2346. [DOI] [PubMed] [Google Scholar]
- Lord C, Rutter M, DiLavore P, Risi S, Gotham K, & Bishop S (2012). Autism Diagnostic Observation Schedule–2nd edition (ADOS-2). Los Angeles, CA: Western Psychological Corporation. [Google Scholar]
- Martin NA, & Brownell R (2011). Expressive one-word picture vocabulary test-4 (EOWPVT-4): Academic Therapy Publications. [Google Scholar]
- Mullen EM (1995). Mullen scales of early learning: AGS Circle Pines, MN. [Google Scholar]
- Mundy P, Sigman M, & Kasari C (1990). A longitudinal study of joint attention and language development in autistic children. Journal of autism and developmental disorders, 20(1), 115–128. [DOI] [PubMed] [Google Scholar]
- Murias M, Major S, Davlantis K, Franz L, Harris A, Rardin B, . . . Dawson G (2018). Validation of eye-tracking measures of social attention as a potential biomarker for autism clinical trials. Autism Research, 11(1), 166–174. [DOI] [PubMed] [Google Scholar]
- Nakano T, Tanaka K, Endo Y, Yamane Y, Yamamoto T, Nakano Y, . . . Kitazawa S (2010). Atypical gaze patterns in children and adults with autism spectrum disorders dissociated from developmental changes in gaze behaviour. Proceedings of the Royal Society B, 277(1696), 2935–2943. doi: 10.1098/rspb.2010.0587 [DOI] [PMC free article] [PubMed] [Google Scholar]
- Pelphrey KA, Sasson NJ, Reznick JS, Paul G, Goldman BD, & Piven J (2002). Visual scanning of faces in autism. Journal of Autism & Developmental Disorders, 32(4), 249–261. [DOI] [PubMed] [Google Scholar]
- Rice K, Moriuchi JM, Jones W, & Klin A (2012). Parsing heterogeneity in autism spectrum disorders: visual scanning of dynamic social scenes in school-aged children. Journal of the American Academy of Child & Adolescent Psychiatry, 51(3), 238–248. [DOI] [PMC free article] [PubMed] [Google Scholar]
- Sargezeh BA, Ayatollahi A, & Daliri MR (2019). Investigation of eye movement pattern parameters of individuals with different fluid intelligence. Experimental brain research, 237(1), 15–28. [DOI] [PubMed] [Google Scholar]
- Sasson NJ, Turner-Brown LM, Holtzclaw TN, Lam KSL, & Bodfish JW (2008). Children with autism demonstrate circumscribed attention during passive viewing of complex social and nonsocial picture arrays. Autism Research, 1(1), 31–42. doi: 10.1002/aur.4 [DOI] [PMC free article] [PubMed] [Google Scholar]
- Schomaker J, Walper D, Wittmann BC, & Einhäuser W (2017). Attention in natural scenes: affective-motivational factors guide gaze independently of visual salience. Vision research, 133, 161–175. [DOI] [PubMed] [Google Scholar]
- Shic F, Bradshaw J, Klin A, Scassellati B, & Chawarska K (2011). Limited activity monitoring in toddlers with autism spectrum disorder. Brain Research, 1380(0), 246–254. [DOI] [PMC free article] [PubMed] [Google Scholar]
- Shic F, Macari S, & Chawarska K (2013). Speech Disturbs Face Scanning in 6-Month-Old Infants Who Develop Autism Spectrum Disorder. Biological psychiatry. [DOI] [PMC free article] [PubMed] [Google Scholar]
- Sparrow SS (2011). Vineland Adaptive Behavior Scales. In Kreutzer J, DeLuca J, & Caplan B (Eds.), Encyclopedia of Clinical Neuropsychology (pp. 2618–2621): Springer; New York. [Google Scholar]
- Sparrow SS, Cicchetti DV, & Saulnier CA (2016). Vineland-3: Vineland Adaptive Behavior Scales: PsychCorp. [Google Scholar]
- Speer LL, Cook AE, McMahon WM, & Clark E (2007). Face processing in children with autism: Effects of stimulus contents and type. Autism, 11(3), 265–277. doi: 10.1177/1362361307076925 [DOI] [PubMed] [Google Scholar]
- Tenenbaum EJ, Amso D, Abar B, & Sheinkopf SJ (2014). Attention and word learning in autistic, language delayed and typically developing children. Frontiers in psychology, 5. [DOI] [PMC free article] [PubMed] [Google Scholar]
- Tenenbaum EJ, Sobel DM, Sheinkopf SJ, Malle BF, & Morgan JL (2014). Attention to the mouth and gaze following in infancy predict language development. Journal of Child Language, 1–18. [DOI] [PMC free article] [PubMed] [Google Scholar]
- Wagner JB, Hirsch SB, Vogel-Farley VK, Redcay E, & Nelson CA (2013). Eye-tracking, autonomic, and electrophysiological correlates of emotional face processing in adolescents with autism spectrum disorder. Journal of autism and developmental disorders, 43(1), 188–199. [DOI] [PMC free article] [PubMed] [Google Scholar]
- Wakabayashi A, Baron-Cohen S, Wheelwright S, & Tojo Y (2006). The Autism-Spectrum Quotient (AQ) in Japan: a cross-cultural comparison. Journal of autism and developmental disorders, 36(2), 263–270. [DOI] [PubMed] [Google Scholar]
- Wang Q, Campbell DJ, Macari SL, Chawarska K, & Shic F (2018). Operationalizing atypical gaze in toddlers with autism spectrum disorders: a cohesion-based approach. Molecular autism, 9(1), 25. [DOI] [PMC free article] [PubMed] [Google Scholar]
- Wechsler D (2002). Wechsler Preschool and Primary Scale of Intelligence Third Edition (WPPSI-III) San Antonio: Pearson. [Google Scholar]
- Young G, S., Merin N, Rogers SJ, & Ozonoff S (2009). Gaze behavior and affect at 6 months: predicting clinical outcomes and language development in typically developing infants and infants at risk for autism. Developmental Science, 12(5), 798–814. [DOI] [PMC free article] [PubMed] [Google Scholar]
Associated Data
This section collects any data citations, data availability statements, or supplementary materials included in this article.
Supplementary Materials
Video shows the full stimulus overlain with the mean fixations frame-by-frame. Blue indicates the mean for the TD group. Red indicates mean fixation for the ASD participants.