Abstract
Metal-ceramics (MC) are one of the oldest dental restorative systems, which are considered to be the gold standard for full crown restoration. Porcelain-veneered lithium disilicate (PVLD), on the other hand, are newer material systems that have shown high survival rate in clinical follow-ups but needs to be studied more. This study compares the stresses developed in the single crowns made from newer PVLD system against those with MC configuration. For this comparison, influence of the layer thickness and cooling rates is also taken into consideration. An experimentally validated viscoelastic finite element model (VFEM) has been developed to predict the stress profile in these systems. Three-dimensional rotationally symmetric crowns were analyzed using this validated model for both material systems, three veneer to core thickness ratios (2:1, 1:1, 1:2), and two cooling rates: slow cooling at 1.74E-5 W/mm2K (~30 K/min) and fast cooling at 1.74E-4 W/mm2K (~300 K/min). PVLD showed lower values of transient and residual stresses than MC. The maximum tensile residual stresses in MC systems were observed in the cusp area, whereas those in PVLD were located in the central fossa. With the reduction in veneer layer, there was reduction in residual stress in MC; however, the veneer thickness had little to no effect in PVLD. The effect of cooling rate was also evident as slow cooling resulted in lower residual and tensile stresses for both material systems.
Keywords: Viscoelastic finite element, metal-ceramic, porcelain-veneered lithium disilicate, residual stresses, transient stresses
1. Introduction
Metal-ceramics (MC) have been successfully used as a restorative option since its conception in the 1960s (Weinstein et al. 1962). Long-term clinical studies have shown survival rates of ~79% for single crowns in over 20-year follow-ups (Näpänkangas and Raustia 2008; Reitemeier et al. 2019), which makes them a ‘gold-standard’ for performance of full coverage fixed dental prostheses (FDPs).
The most frequently reported reason for failure of MC restorations is biological issues (Näpänkangas and Raustia 2008; Reitemeier et al. 2019), whereas veneer chipping is one of the most common technical complication (Pjetursson et al. 2015; Sailer et al. 2015). Other than that, MC restorations may be also replaced due to esthetic issues. The gray metal framework makes it difficult to imitate the appearance of the natural tooth in situations where space is limited or where lighter shades are needed (Pjetursson et al. 2007). In addition, the gingival tissues may recede over time; if a metal collar is used, the gray margins can become visible (Zhang and Kim 2010).
In the last 30 years, the development of the pressing technique for glass-ceramics and the Computer Aided Design/Computer Aided Machining (CAD/CAM) technology have allowed the fabrication of strong ceramic frameworks that is combined with a porcelain overlay to achieve the most esthetic results (Zhang and Kelly 2017). Also with the advent of finite element method (FEM), simplified models have been developed that has eased this fabrication process (Martorelli and Ausiello 2013). Among the available ceramic frameworks, lithia- and zirconia-based ceramics are the popular choices for metal-free systems (Zarone et al. 2019). Porcelain-veneered zirconia (PVZ) has been the most popular and widely studied alternative for MC. However, concerns of the high rates of porcelain fracture and chipping and crown debonding have cast a shadow over their widespread applications (Pang et al. 2015; Pjetursson et al. 2015; Sailer et al. 2015; Nicolaisen et al. 2016).
On the other hand, porcelain-veneered lithium disilicate (PVLD) has also been considered as an all-ceramic alternative for the traditional MC systems. Clinical studies have shown high survival rates of 100% at 7.9 years (Malament et al. 2019) and 98% at 11 years (Simeone and Gracis 2015) for PVLD single crowns in both anterior and posterior areas. Clinically, PVLD restorations also show porcelain chipping as a common technical complication, together with catastrophic bulk fracture of the LD framework (Valenti and Valenti 2009; Gehrt et al. 2013; Yang et al. 2016). Nevertheless, the incidence of veneer chipping for PVLD is much lower than that for PVZ, and potentially, even lower than that for MC crowns. In addition, all-ceramic systems seem to perform biologically better than the MC systems (Sailer et al. 2015).
Porcelain chipping and delamination in bilayer restorations are associated with residual stresses induced from the cooling phase of the veneer firing cycle (Özcan 2003; Hermann et al. 2006; Christensen 2009; Zhang et al. 2012; 2013; Pang et al. 2015; Nicolaisen et al. 2016). In addition, transient stresses developed during cooling might form micro-cracks inside the porcelain material, ultimately resulting in fracture (Lenz et al. 1998; Benetti et al. 2014). The factors that contribute to these stresses are temperature-dependent material properties, layer thickness, thermal contraction mismatch and cooling rates (Zhang et al. 2010; Meira et al. 2013; Benetti et al. 2014; Dhital et al. 2020). Even though residual stresses have been widely studied with various experimental techniques (Mainjot et al. 2011; Tholey et al. 2011; Baldassarri et al. 2012), the finite element method (FEM) can capture the entire stress history for the simulated firing. Owing to the viscoelastic behavior of glassy materials, the viscoelastic finite element method (VFEM) is more accurate than the linear elastic FEM for evaluations of stress profile in porcelain-veneered structures (Kim et al. 2018).
MC restorations have been in use with great success for over 50 years where as PVLD has been in use more recently. However, there is a lack of information about the stresses developed in PVLD restorative systems. Despite the need for longer follow-ups, clinical survival rates of PVLD crowns seem to be comparable to MC. Therefore, knowing the residual stress distribution and defining the best design to decrease the deleterious tensile stresses in these crowns is paramount to avoid bulk and porcelain fractures. Moreover, comparing PVLD with the gold standard MC would give us a better understanding of the properties that govern the structural stability of these restorations.
Accordingly, this study was undertaken with the aim to understand the behavior of PVLD and MC crowns by conducting a comparative analysis of the two restoration systems, with the veneer core thickness ratio and cooling rate as key evaluation parameters. An experimentally validated VFEM was used to analyze the rotationally symmetric crowns to elucidate the effect of these parameters on the amount of transient and residual stresses obtained and their locations.
2. Materials and methods
2.1. Materials selected for the study
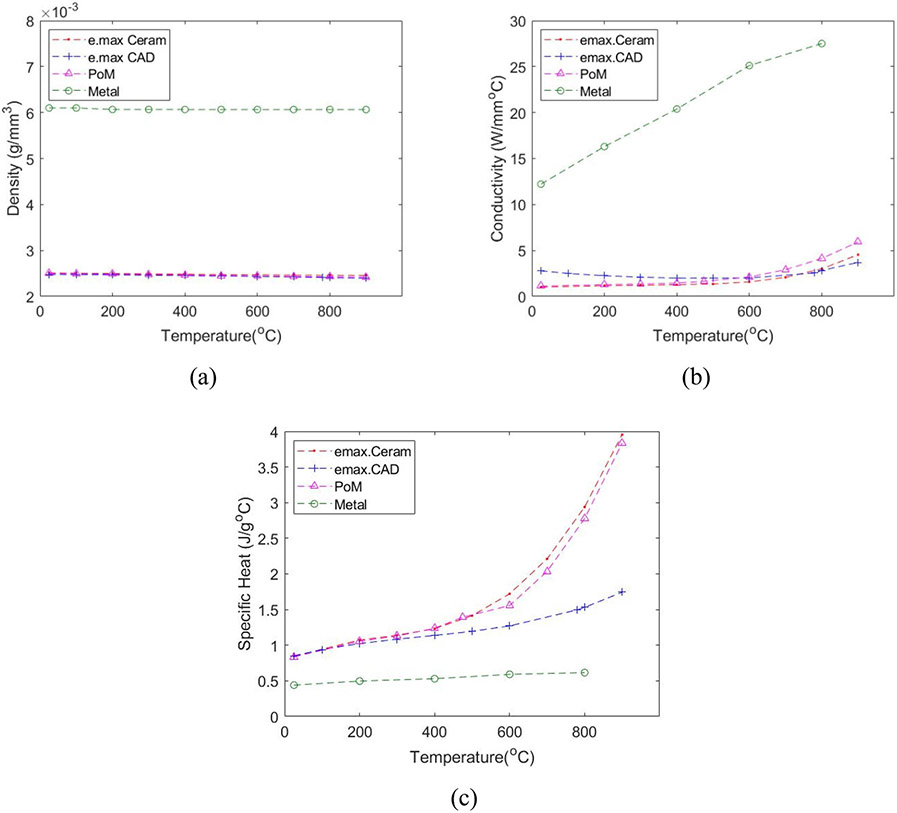
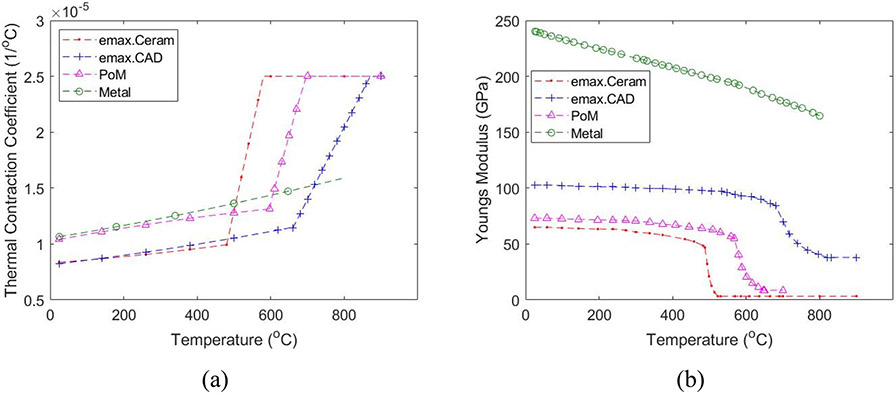
The two bilayer systems chosen for this study were a porcelain-veneered lithium disilicate crown [e.max CAD MO (Ivoclar Vivavent, Schaan, Liechtenstein) veneered with a nanofluorapatite ceramic (e.max Ceram, Ivoclar Vivavent, Schaan, Liechtenstein)] and a metal-ceramic crown [metal alloy (Colado CAD CoCr4, Ivoclar Vivavent, Schaan, Liechtenstein) veneered with a press-on-metal ceramic (IPS InLine PoM, Ivoclar Vivavent, Schaan, Liechtenstein)]. The properties of each of these materials were experimentally (at room and high temperatures) measured and are described in Table 1 and Figures 2 and 3.
Table 1.
Material properties at the room temperature (25 °C).
| Material | Young’s Modulus, E (MPa) |
Poisson’s Ratio, ν |
Density, ρ (kg/mm3) |
Thermal Conductivity (W/mm °C) |
Specific Heat, c (J/kg°C) |
Tg (°C) |
Ts (°C) |
|---|---|---|---|---|---|---|---|
| e.max Ceram | 65,000 | 0.21 | 2.51E-06 | 1.01E-03 | 846 | 483 | 530 |
| e.max CAD | 102,700 | 0.21 | 2.48E-06 | 2.78E-03 | 852 | 665 | 820 |
| PoM | 73,200 | 0.3 | 2.49E-06 | 1.114E-03 | 835 | 559 | 647 |
| Metal | 240,000 | 0.29 | 8.4E-06 | 12.211E-03 | 440 |
Figure 2.
Temperature-dependent (a) Density; (b) Conductivity; and (c) Specific Heat.
Figure 3.
Temperature-dependent (a) Thermal Contraction Coefficient (CTC); (b) Elastic Modulus.
2.2. Axisymmetric crown model
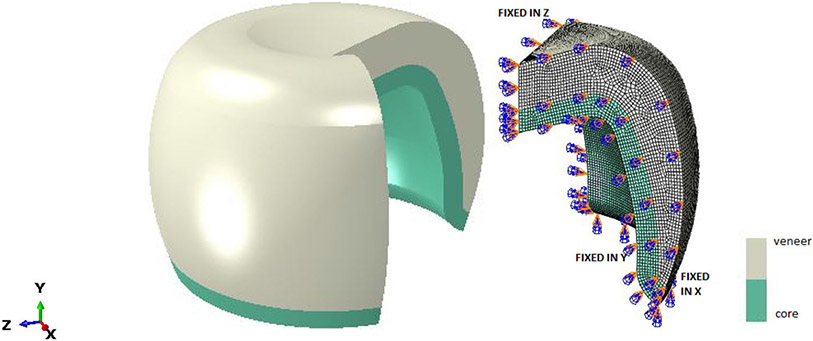
Three dimensional rotationally symmetric FEM models (Figure 1) were developed in ABAQUS, similar to Meira et al. 2013. Owing to geometrical symmetry, only 1/4th of the entire section (axisymmetric) was analyzed with suitable boundary conditions. Each of these models (Table 2) consists of 131,586 nodes, and 124,196 8 node linear brick, solid elements. The veneer material was considered to be homogeneous, isotropic and viscoelastic whereas the core was assumed linearly elastic in MC and viscoelastic in PVLD models. These axisymmetric crowns were analyzed in two steps, heat analysis followed by thermal stress analysis. For thermal stress analysis, validated subroutines (UEXPAN and UTRS) with experimental results from bilayer ceramic samples (Kim et al. 2018; Rodrigues et al. 2020) were used.
Figure 1.
Finite element model of full dental crown and 1/4th of its simulated model, along with the appropriate boundary conditions.
Table 2.
Material combination and veneer core ratio.
| Model | Veneer to Core Ratio | Ceramic system | Cooling rate |
|---|---|---|---|
| Model 1 | 2:1 | MC | Slow Fast |
| Model 2 | 1:1 | MC | Slow Fast |
| Model 3 | 1:2 | MC | Slow Fast |
| Model 4 | 2:1 | PVLD | Slow Fast |
| Model 5 | 1:1 | PVLD | Slow Fast |
| Model 6 | 1:2 | PVLD | Slow Fast |
2.2.1. Heat transfer analysis
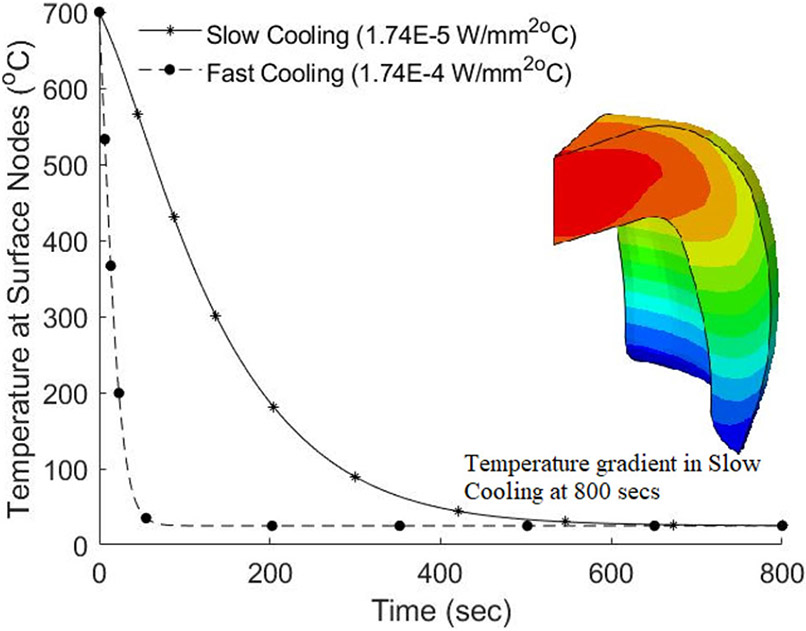
In this step, a transient heat transfer analysis was carried out to determine the input nodal temperature. The axisymmetric models were cooled from an initial temperature of 700 °C for PVLD and 717 °C for MC combinations to the room temperature (25 °C). These initial cooling temperatures were set at least 70 °C above the softening temperature (Ts) of the porcelain overlay, above which the eutectic characteristic of porcelain would be able to accommodate any dimensional discrepancy between the layers. For PVLD, the softening temperature of e.max Ceram was 530 °C, thereby resulting an initial temperature of 600 °C. However, in dental laboratory procedures, the firing temperature of e.max Ceram is above the glass transition temperature (Tg) of the e.max CAD framework (665 °C). Therefore, to accurately capture the viscoelastic behavior of e.max CAD core, we adopted an initial temperature of 700 °C. The heat transfer analysis was carried out under two different cooling protocols; slow (controlled) and fast (bench) cooling with convective heat transfer coefficients of 1.74E-05W/mm2K and 1.74E-04W/mm2K respectively.
Heat transfer was simulated using the temperature dependent values of density (ρ), thermal conductivity (k), and specific heat (c), as shown in Figure 2. Thermal conductivity and specific heat were measured by laser flash technique (LFA 457 MicroFlash, Netzsch, Selb, Germany) on discs of ϕ12 mm × 1 mm and density was measured using water displacement method on four different bars.
2.2.2. Thermal stress analysis
The nodal temperatures obtained in the heat transfer analysis were used as input in this step and viscoelastic analysis was carried out using the temperature dependent coefficient of thermal contraction (CTC) and Elastic Modulus (E), as shown in Figure 3.
CTC were measured with bar shaped specimens (3.5 × 3.5 × 15) mm3 placed in the dilatometer (L75 Platinum Series, Linseis USA, Princeton, NJ) which recorded the dimension change when subjected to a cooling process. As shown in Figure 3a, the CTCs for PoM, e.max Ceram and e.max CAD are divided into solid and liquid CTCs, αg(T) and αl(T), given by:
| (1) |
Where T is in Celsius and the coefficients are given in Table 3.
Table 3.
Constants for thermal contraction of dental ceramics (αg =a + bT + cT2, αl = d + eT).
| Materials |
αe (mm/mm°C) |
αL (mm/mm°C) |
||||
|---|---|---|---|---|---|---|
| a(1/°C) 10−6 |
b(1/°C)2 10−9 |
c(1/°C)3 10−12 |
R2 | d(1/°C) 10−4 |
e(1/°C)2 10−7 |
|
| PoM | 10.26 | 6.315 | −2.49 | 0.997 | −0.5765 | 1.19 |
| Metal | 10.525 | 5.382 | 1.67 | 0.978 | NA | NA |
| e.max Ceram | 8.3111 | 2.373 | 2.1 | 0.983 | −0.6238 | 1.507 |
| e.max CAD | 8.153 | 3.822 | 1.9 | 0.995 | −0.3113 | 0.645 |
For CTCs of Metal, thermal contraction strain versus temperature data were fit to a third-degree polynomial relation and αg(T) was determined, using eqn (1). For other materials, αl(T) was determined by fitting the contraction data with a quadratic equation from the temperature at which creep first occurs on the heating curve to the glass transition temperature, Tg. These nonlinear CTCs were addressed in ABAQUS through user defined subroutine UEXPAN.
The temperature dependent Elastic modulus (Figure 3b) were assumed based on the trend of modulus data published on data sources (Kim et al. 2018) as it was difficult to measure these values at high temperature.
2.3. Viscoelasticity
For a linear isotropic viscoelastic material, the three-dimensional stress-strain relationship is given by (DeHoff et al. 2008):
| (2) |
where i, j = 1, 2, 3 and σij is the Cauchy stress tensor, eij the deviatoric strain tensor, δij the Kronecker delta, G(t) the shear relaxation function, K(t) the bulk relaxation function, θ(t) the volumetric strain, t the present time and τ is the past time.
The shear relaxation function, G(t), can be normalized to obtain normalized shear relaxation modulus as:
| (3) |
where G0 is the instantaneous shear modulus.
g(t) can then be introduced in ABAQUS by a four term prony series, characterized by DeHoff and Anusavice (2004), in the form:
| (4) |
where N is the number of terms (N = 4 in this study), are coefficients, and is shear relaxation time (Table 4) given at the reference temperature of 700 °C (DeHoff et al. 2006). The reference temperature are the initial cooling temperature and the materials are assumed to have same relaxation coefficients and times at their respective cooling temperature as those given by DeHoff at 700 °C.
Table 4.
Viscoelastic coefficients for Prony series used for veneer.
| Temp (°C) | g1 | g2 | g3 | g4 | τ 1 | τ 2 | τ 3 | τ 4 |
|---|---|---|---|---|---|---|---|---|
| 700 | 0.9960 | 0.0030 | 0.0006 | 0.0004 | 0.01316 | 0.10000 | 0.0050 | 0.0030 |
For bulk relaxation function, K(t), we assume that the dilatational behavior of dental ceramics are purely elastic so that:
| (5) |
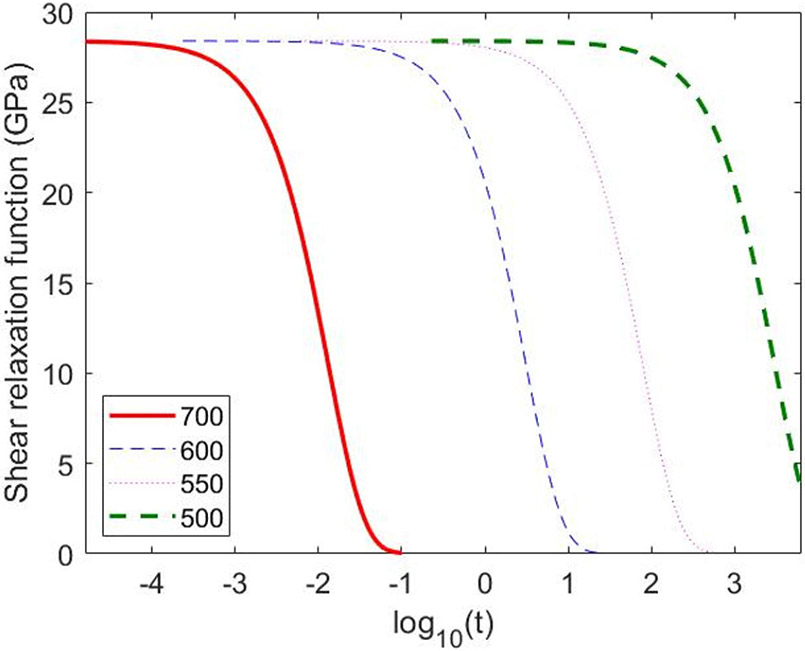
The temperature dependency of the viscoelastic properties can be addressed by utilizing the thermorheologically simple behavior of viscoelastic materials. In these materials, the plot of relaxation function versus log10t is a simple curve that has same shape at each temperature and can be shifted along the horizontal axis to obtain a master curve at any desired temperature (Figure 4). The shift along the x-axis is known as shift function and can be defined using UTRS subroutine in ABAQUS. Tool-Narayanaswamy approximation is used to define this shift, which takes the form (Tool 1946; Narayanaswamy 1971).
| (6) |
where, lnA is the shift, Tref = 973.15 in Kelvin, H is the activation energy, R is the ideal gas constant (H/R = 46400 is used), T(t) is the temperature at time t and Tf(t) is the fictive temperature at time t, and x is a material constant between 0 and 1 (x = 0.3 used, e.g., (Fragassa 2016).
Figure 4.
Normalized shear relaxation function at various high temperatures.
The fictive temperature, Tf(t) can be calculated by following the algorithm proposed by Markovsky et al. (1984). This proposed method requires a Prony series input for volume decay; however, such data are not available for dental ceramics. For glasses, it has been found that the volume relaxation time is 1/4 to 1/20 of shear relaxation time; taking this as reference, we assumed the volume relaxation time in the ceramics to be 1/10 of the shear relaxation time (DeHoff et al. 2006). Utilizing this and Markovsky and Soules algorithm, fictive temperature Tf(t) has been coded in UEXPAN. Based on this temperature, thermal strain is then calculated for the core and veneer layer using the following equation:
| (7) |
where αg(T) and αl (T) are plotted in Figure 3a.
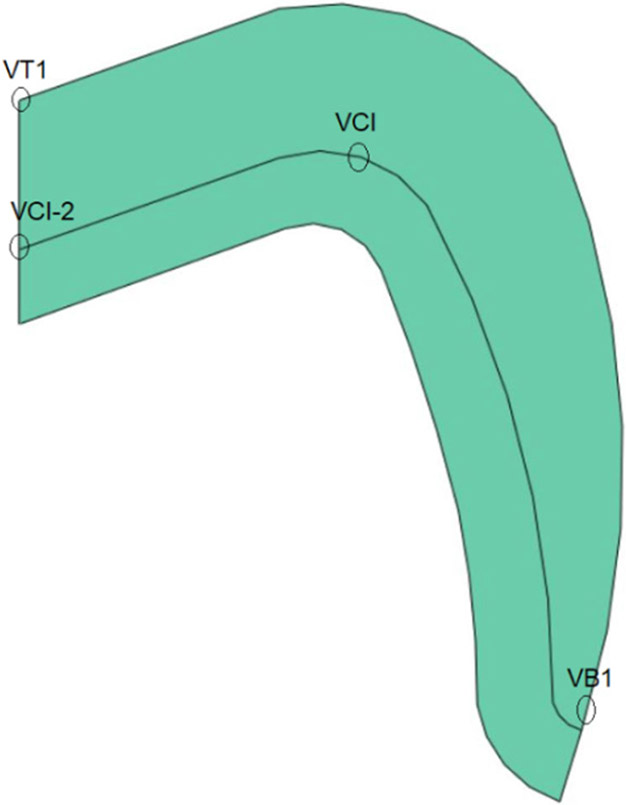
Besides residual stresses, to understand the transient stress profile of the material systems, four prominent points were selected (Figure 5) in this study.
Figure 5.
Labelled points for transient stress plot.
3. Results
Figure 6 shows the contour of nodal temperature when subjected to slow cooling as well as the corresponding graph for slow and fast cooling. As temperature analysis is not the focus of our study detail results are not provided.
Figure 6.
Model 4 (PVLD): Temperature profile and the cooling rates applied.
The obtained temperature profiles, for each of the 12 models, are used as load for corresponding viscoelastic stress analysis.
Figure 7 shows the contour for maximum principal residual stress in MC and PVLD models under slow cooling. In the veneer layer of MC, for Model 1, the maximum tensile stress was 17.56 MPa, located at the interface between veneer and core in the cusp area. For Model 2 and Model 3, the maximum tensile stress was 13.62 MPa and 10.06 MPa, respectively, at the same location. These results show that with the decrease in the thickness of veneer layer there is decrease for stress produced in MC (Figures 7a-c). For PVLD, the maximum tensile residual stress in the veneer layer was found to be 10.38 MPa, 10.17 MPa and 8.99 MPa for Model 4, Model 5 and Model 6, respectively and was located near the inner central fossa of the crown. In contrast to MC system, thickness ratio did not bring about much change in residual stresses in PVLD veneer layer (Figures 7d-f). Comparing the two material systems, we can clearly observe that PVLD resulted in lesser stresses as compared to MC.
Figure 7.
Stress contour for slow cooling in MC system: (a) Model 1 (V: 17.56/C: 82.36); (b) Model 2 (V: 13.62/C: 68.18); (c) Model 3 (V: 10.06/C: 56.69), and PVLD system: (d) Model 4 (V: 10.38/C: 16.06); (e) Model 5 (V: 10.17/C: 14.24); (f) Model 6 (V: 8.99/C: 12.70). V and C are residual stresses (in MPa) in veneer and core layer, respectively.
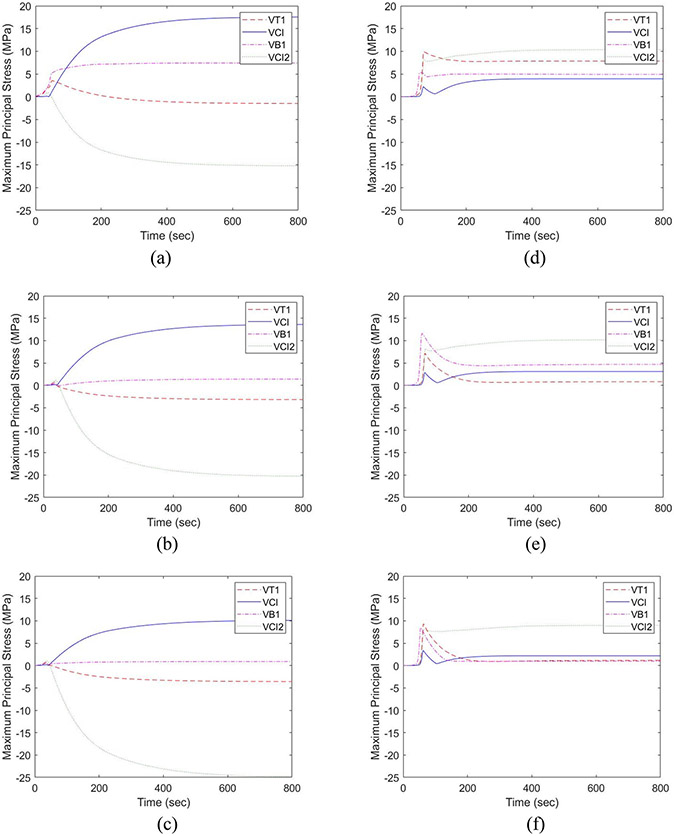
Figure 8 shows the stress development in the selected points of MC (Figures 8a-c) and PVLD systems (Figures 8d-f) under slow cooling. The stress profile for VT1 node is elaborated. For MC Model 1, we can see a spike of 3.56 MPa at 50 secs that decreases to −1.50 MPa at 800 secs. Similarly, for Model 2 and Model 3, the stress peaked at around 35 secs for 0.71 MPa and 0.77 MPa and dropped to −3.19 MPa and −3.69 MPa at 800 secs respectively. For PVLD system, the principal stress spiked at 71.50 secs to 9.95 MPa and then gradually dropped to 7.85 MPa at 800 secs in Model 4. For Model 5 and 6, peak occurred at 67 secs for 7.13 MPa and 64 secs for 9.31 MPa respectively, which then dropped to 0.82 MPa and 1.16 MPa at 800 secs. In all the models, thickness ratio had little influence in transient stress produced.
Figure 8.
Transient stress for slow cooling in MC system: (a) Model 1; (b) Model 2; (c) Model 3 and PVLD system: (d) Model 4; (e) Model 5; (f) Model 6.
Figure 9 shows the contours of the maximum principal residual stress for MC and PVLD models under fast cooling. For MC system, maximum residual stress of 27.18 MPa, 23.52 MPa and 17.55 MPa were obtained for Model 1, Model 2 and Model 3 in the veneer layer, respectively. Similarly, for PVLD system maximum residual stress of 23.76 MPa, 26.13 MPa and 26.53 MPa in the veneer layer were obtained for Model 4, Model 5 and Model 6, respectively. The maximum residual stress appeared at the same location as that in slow cooling for both material systems. However, fast cooling increased the maximum tensile stress values for all the models. There was an increase of about 10 MPa for MC models, whereas PVLD system showed an increase of about 11 MPa, 16 MPa, and 17.54 MPa for Model 4, 5 and 6 respectively. The effect of thickness of veneer layer is more evident in the MC system, but not in PVLD system.
Figure 9.
Stress Contour for fast cooling in MC system: (a) Model 1 (V: 27.18/C: 85.73); (b) Model 2 (V: 23.52/C: 75.02); (c) Model 3 (V: 17.55/C: 62.85), and PVLD system: (d) Model 4 (V: 23.76/C: 27.59); (e) Model 5 (V: 26.13/C: 18.43); (f) Model 6 (V: 26.53/C: 14.07). V and C are residual stresses (in MPa) in veneer and core layer, respectively.
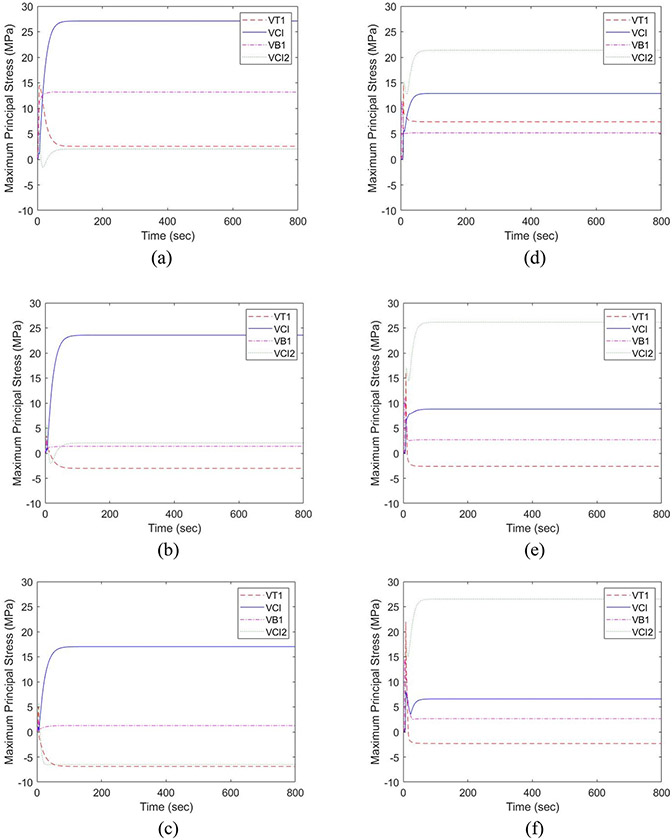
Figure 10 shows the stress profile of MC and PVLD crowns when subjected to fast cooling. Similar to slow cooling, focus is on node VT1. For MC, the sudden peak of 14.51 MPa for Model 1 occurred at 7.5 secs that stabilized to 2.55 MPa at 135 secs. Model 2 reached a peak of 3.80 MPa at 4 secs and dropped to −7.02 MPa at 140 secs; Model 3 peaked to 4.97 MPa at 4.5 secs and then dropped to −6.88 MPa at 140 secs. For the PVLD system, Model 4 had a peak stress of 14.68 MPa at 8.5 secs, which stabilized to 7.36 MPa at 160 secs. Model 5 peaked at 8 secs to 16.21 MPa and stabilized to −2.62 MPa at 141 secs and Model 6 peaked at 7.5 secs to a value of 22 MPa and dropped to a stable value of −2.30 MPa at 121 secs. All the curves show transient stress peaks that drops to a stable stress value in a short time (~140 seconds) and ultimately result in greater stored residual stresses compared to slow cooling. These results validate the effect of cooling rate on the amount of stresses produced.
Figure 10.
Transient stress for fast cooling in MC system: (a) Model 1; (b) Model 2; (c) Model 3 and PVLD system: (d) Model 4; (e) Model 5; (f) Model 6.
4. Discussion
PVLD and MC are two different material systems that led to different stress profiles. MC showed slightly higher maximum principal stresses in the veneer layer than PVLD in most simulated conditions. However, the main difference between the two bilayer systems was their stress distribution. The maximum tensile stress in MC was observed in the inner cusp area and at the central fossa for PVLD. This difference in location affects the clinical fracture modes of the veneer layer. Despite the high success rates, clinical studies have reported minor veneer chipping (reparable fractures) as a frequent technical complication in MC restorations (Heintze et al. 2011; Pang et al. 2015; Rinke et al. 2016). On the other hand, PVLD seems to show extensive (non-reparable) veneer fractures more frequently (Simeone and Gracis 2015; Yang et al. 2016). These clinical findings are in agreement with our results. Once a crack forms close to the cusp area and finds a tensile area there, it can easily propagate causing chipping fracture (minor chipping in MCs). However, when a crack forms in the central area of the crown and finds a tensile stress area, there is a longer path to propagate to a chip off fracture. This might cause extensive fracture, leading to the need of crown replacement (major chipping in PVLDs).
Another difference between the MC and PVLD results was the residual stress intensity in the core layers. The maximum principal stresses in metal cores were higher than that in lithium disilicate cores. Since stress is directly proportional to the elastic modulus and the modulus of studied metal alloy (240 GPa) is significantly higher than that of lithium disilicate (102 GPa), this difference was expected. As metal is a ductile and stronger material than the friable glassceramic core, this higher intensity stress is not deleterious to the metal framework.
Cooling rate affects the magnitude of stress developed in bilayer restoration. In both PVLD and MC, slow cooling resulted in lower residual as well as transient stresses. Fast cooling increased the maximum tensile stresses in veneer layer for 52%-66% in PVLD and 35%-43% in MC. Increased residual stress make crack propagation easier and diminishes the mechanical properties of bilayer crowns (Belli et al. 2013; Paula et al. 2015). Further, with high cooling rate, temperature drops quickly, resulting in larger temperature difference and hence steeper stress gradients that generates micro cracks around inner pores or impurities of the porcelain and ultimately affect its clinical performance.
The effect of thickness ratio seems to be more prominent in MC as compared to PVLD. In the MC system, with reduction in veneer layer thickness there is reduction in amount of stress produced. When subjected to slow cooling, in MC system, the residual stress decreased from 17.56 MPa to 13.62 MPa and 10.06 MPa for 2:1, 1:1, and 1:2 thickness ratios, respectively. For fast cooling, similar behavior could be observed (reduction of about 19%). For PVLD, the aforementioned decrease in stress with the decrease of veneer layer thickness was only true during slow cooling. During fast cooling, thickness ratio did not play an important role in the stress development. This contrasting behavior of the two material systems can be attributed to their specific heat capacity. Figure 2c shows that the specific heat capacity of metal is low compared to ceramic and hence it cools down quicker than the veneer layer. When a thick porcelain layer is used, heat gets entrapped between outer cooled porcelain surface and inner cooled metal layer. With reduction in porcelain layer thickness, the thermal heat gradient within the porcelain layer reduces which reduces the residual stress stored. However, in the PVLD system, the difference in the specific heat capacity of the two material layers is not that high and hence both layers cool down at a similar rate. Thus, the thickness of the veneer layer does not significantly affect the amount of residual stress obtained.
Even though using a thinner veneer layer over metal decreases residual stresses throughout the crown, implementing these conditions clinically might be challenging due to the need to mask the grayish color of metals. This makes it even more necessary to apply a slow cooling protocol after firing. Using a low cooling rate decreases the deleterious tensile stresses in both PVLD and MC. The overall results showed that PVLD crowns produce transient and residual stresses comparable, if not lower, to their traditional MC counterparts. This similarity, together with the previously mentioned clinical findings, suggests that PVLD is a very suitable alternative to MCs. Moreover, the differences in stress distribution may also benefit the survival rates of PVLD. However, longer clinical follow-ups of PVLD crowns are needed to validate such conclusions, as well as in vitro tests to confirm the relationship between stress profiles and failure modes.
Some limitations of the current study are discussed herein. Rotationally symmetric crowns are used for simulation as this reduced our computational times. Although anatomically correct crowns can be evaluated similarly (Kim et al. 2018), they would increase computational effort but the extent of effect of parameters on the amount of residual stresses would be similar. Nevertheless, this study can be extended to actual crowns. Further studies can also include damage analysis in order to understand the effect of crack formation and propagation in a crown system.
5. Conclusions
PVLD and MC restorations show different behavior when subjected to similar cooling rates and thickness ratios. The PVLD system showed lower stress than MC in both veneer and core layers in most conditions simulated. In both material systems, slow cooling resulted in lower residual as well as transient stresses. The decrease in veneer thickness led to lower residual stresses in MC but this effect was not significant in PVLD systems. In addition, the location of maximum residual stress was observed in the central fossa for PVLD and in the cusp area for MC, which might ultimately affect the failure modes of both bilayer systems.
Funding
This study was sponsored by the United States National Institute of Dental & Craniofacial Research, National Institutes of Health (Grants Nos. 1R01 DE026279 and R01DE026772). The authors are also thankful to the Brazilian Federal Agency for Support and Evaluation of Graduate Education (CAPES) (finance code001).
Footnotes
Disclosure statement
All authors declare no conflict of interest.
References
- Baldassarri M, Stappert CFJ, Wolff MS, Thompson VP, Zhang Y. 2012. Residual stresses in porcelain-veneered zirconia prostheses. Dent Mater. 28(8):873–879. [DOI] [PMC free article] [PubMed] [Google Scholar]
- Belli R, Frankenberger R, Appelt A, Schmitt J, Baratieri LN, Greil P, Lohbauer U. 2013. Thermal-induced residual stresses affect the lifetime of zirconia-veneer crowns. Dent Mater. 29(2):181–190. [DOI] [PubMed] [Google Scholar]
- Benetti P, Kelly JR, Sanchez M, Della Bona A. 2014. Influence of thermal gradients on stress state of veneered restorations. Dent Mater. 30(5):554–563. [DOI] [PubMed] [Google Scholar]
- Christensen GJ. 2009. Porcelain-fused-to-metal versus zirconia-based ceramic restorations, 2009. J Am Dent Assoc. 140(8):1036–1039. [DOI] [PubMed] [Google Scholar]
- DeHoff PH, Anusavice KJ. 2004. Shear stress relaxation of dental ceramics determined from creep behavior. Dent Mater. 20(8):717–725. [DOI] [PubMed] [Google Scholar]
- DeHoff PH, Anusavice KJ, Götzen N. 2006. Viscoelastic finite element analysis of an all-ceramic fixed partial denture. J Biomech. 39(1):40–48. [DOI] [PubMed] [Google Scholar]
- DeHoff PH, Barrett AA, Lee RB, Anusavice KJ. 2008. Thermal compatibility of dental ceramic systems using cylindrical and spherical geometries. Dent Mater. 24(6):744–752. [DOI] [PMC free article] [PubMed] [Google Scholar]
- Dhital S, Rodrigues C, Zhang Y, Kim J. 2020. Viscoelastic finite element evaluation of transient and residual stresses in dental crowns: Design parametric study. J Mech Behav Biomed Mater. 103:103545. [DOI] [PMC free article] [PubMed] [Google Scholar]
- Fragassa C 2016. Modelling the viscoelastic response of ceramic materials by commercial finite elements codes. FME Trans. 44(1):58–64. [Google Scholar]
- Gehrt M, Wolfart S, Rafai N, Reich S, Edelhoff D. 2013. Clinical results of lithium-disilicate crowns after up to 9 years of service. Clin Oral Investig. 17(1):275–284. [DOI] [PubMed] [Google Scholar]
- Heintze S, Vivadent I, Rousson V. 2011. Survival of zirconia- and metal-supported fixed dental prostheses: a systematic review. Br Dent J. 210:311–311. [PubMed] [Google Scholar]
- Hermann I, Bhowmick S, Zhang Y, Lawn BR. 2006. Competing fracture modes in brittle materials subject to concetrated cyclic loading in liquid environments: Trilayer structures. J Mater Res. 21(2):512–521. [Google Scholar]
- Kim J, Dhital S, Zhivago P, Kaizer MR, Zhang Y. 2018. Viscoelastic finite element analysis of residual stresses in porcelain-veneered zirconia dental crowns. J Mech Behav Biomed Mater 82:202–209. [DOI] [PMC free article] [PubMed] [Google Scholar]
- Lenz J, Thies M, Schweizerhof K. 1998. Transient and residual thermal stress in porcelain-fused-to-metal dental crowns. WIT Trans Eng Sci 21:255–264. [Google Scholar]
- Mainjot AK, Schajer GS, Vanheusden AJ, Sadoun MJ. 2011. Residual stress measurement in veneering ceramic by hole-drilling. Dent Mater. 27(5):439–444. [DOI] [PubMed] [Google Scholar]
- Malament KA, Natto ZS, Thompson V, Rekow D, Eckert S, Weber HP. 2019. Ten-year survival of pressed, acidetched e.max lithium disilicate monolithic and bilayered complete-coverage restorations: Performance and outcomes as a function of tooth position and age. J Prosthet Dent. 121(5):782–790. [DOI] [PubMed] [Google Scholar]
- Markovsky A Soules TF, Boyd DC. 1984. An efficient and stable algorithm for calculating fictive temperatures effect of variation in flame velocity profile on particle deposition rate. Mater. Sci 67:56–57. [Google Scholar]
- Martorelli M, Ausiello P, 2013. A novel approach for a complete 3D tooth reconstruction using only 3D crown data. Int J Interact Des Manuf. 7(2):125–133. [Google Scholar]
- Meira JBC, Reis BR, Tanaka CB, Ballester RY, Cesar PF, Versluis A, Swain MV. 2013. Residual stresses in Y-TZP crowns due to changes in the thermal contraction coefficient of veneers. Dent Mater. 29(5):594–601. [DOI] [PubMed] [Google Scholar]
- Näpänkangas R, Raustia A. 2008. Twenty-year follow-up of metal-ceramic single crowns: a retrospective study. Int J Prosthodont. 21(4):307–311. [PubMed] [Google Scholar]
- Narayanaswamy OS. 1971. A model of structural relaxation in glass. J Am Ceram Soc. 54(10):491–498. [Google Scholar]
- Nicolaisen M, Bahrami G, Schropp L, Isidor F. 2016. Comparison of metal-ceramic and all-ceramic three-unit posterior fixed dental prostheses: A 3-year randomized clinical trial. Int J Prosthodont. 29(3):259–264. [DOI] [PubMed] [Google Scholar]
- Özcan M 2003. Fracture reasons in ceramic-fused-to-metal restorations. J. Oral Rehabil 30(3):265–269. [DOI] [PubMed] [Google Scholar]
- Pang Z, Chughtai A, Sailer I, Zhang Y. 2015. A fracto-graphic study of clinically retrieved zirconia-ceramic and metal-ceramic fixed dental prostheses. Dent Mater. 31(10):1198–1206. [DOI] [PMC free article] [PubMed] [Google Scholar]
- Paula VG, Lorenzoni FC, Bonfante EA, Silva NRFA, Thompson VP, Bonfante G. 2015. Slow cooling protocol improves fatigue life of zirconia crowns. Dent Mater. 31(2):77–87. [DOI] [PubMed] [Google Scholar]
- Pjetursson BE, Sailer I, Makarov NA, Zwahlen M, Thoma DS. 2015. All-ceramic or metal-ceramic tooth-supported fixed dental prostheses (FDPs)? A systematic review of the survival and complication rates. Part II: Multiple-unit FDPs. Dent Mater. 31(6):624–639. [DOI] [PubMed] [Google Scholar]
- Pjetursson BE, Sailer I, Zwahlen M, Hämmerle CHF. 2007. A systematic review of the survival and complication rates of all-ceramic and metal-ceramic reconstructions after an observation period of at least 3 years. Part I: Single crowns. Clin Oral Implants Res. 18:73–85. [DOI] [PubMed] [Google Scholar]
- Reitemeier B, Hänsel K, Range U, Walter MH. 2019. Prospective study on metal ceramic crowns in private practice settings: 20-year results. Clin Oral Investig. 23(4):1823–1828. [DOI] [PubMed] [Google Scholar]
- Rinke S, Kramer K, Bürgers R, Roediger M. 2016. A practice-based clinical evaluation of the survival and success of metal-ceramic and zirconia molar crowns: 5-year results. J Oral Rehabil. 43(2):136–144. [DOI] [PubMed] [Google Scholar]
- Rodrigues C, Dhital S, Kim J, May LG, Wolff MS, Zhang Y. 2020. Residual stresses explaining clinical fractures of bilayer zirconia and lithium disilicate crowns: A VFEM study. Manuscript submitted for publication. [DOI] [PMC free article] [PubMed] [Google Scholar]
- Sailer I, Makarov NA, Thoma DS, Zwahlen M, Pjetursson BE. 2015. All-ceramic or metal-ceramic tooth-supported fixed dental prostheses (FDPs)? A systematic review of the survival and complication rates. Part I: Single crowns (SCs). Dent. Mater 31(6):603–623. [DOI] [PubMed] [Google Scholar]
- Simeone P, Gracis S. 2015. Eleven-year retrospective survival study of 275 veneered lithium disilicate single crowns. Int J Periodontics Restorative Dent. 35(5):685–694. [DOI] [PubMed] [Google Scholar]
- Tholey MJ, Swain MV, Thiel N. 2011. Thermal gradients and residual stresses in veneered Y-TZP frameworks. Dent Mater. 27(11):1102–1110. [DOI] [PubMed] [Google Scholar]
- Tool AQ. 1946. Relation between inelastic deformability and thermal expansion of glass in its annealing range. J Am Ceram Soc. 29(9):240–253. [Google Scholar]
- Valenti M, Valenti A. 2009. Retrospective survival analysis of 261 lithium disilicate crowns in a private general practice. Quintessence Int. 40:573–579. [PubMed] [Google Scholar]
- Weinstein M, Katz S, Weinstein AB. 1962. Sept. 11. Fused porcelain-to-metal teeth. United States patent. US 3,052,982.
- Yang Y, Yu J, Gao J, Guo J, Li L, Zhao Y, Zhang S. 2016. Clinical outcomes of different types of tooth-supported bilayer lithium disilicate all-ceramic restorations after functioning up to 5 years: A retrospective study. J Dent. 51:56–61. [DOI] [PubMed] [Google Scholar]
- Zarone F, Di Mauro MI, Ausiello P, Ruggiero G, Sorrentino R. 2019. Current status on lithium disilicate and zirconia: A narrative review. BMC Oral Health. 19(1):14. [DOI] [PMC free article] [PubMed] [Google Scholar]
- Zhang Y, Chai H, Lee JJW, Lawn BR. 2012. Chipping resistance of graded zirconia ceramics for dental crowns. J Dent Res. 91(3):311–315. [DOI] [PMC free article] [PubMed] [Google Scholar]
- Zhang Y, Kelly JR. 2017. Dental ceramics for restoration and metal veneering. Dent Clin North Am. 61(4): 797–819. [DOI] [PMC free article] [PubMed] [Google Scholar]
- Zhang Y, Kim JW. 2010. Graded zirconia glass for resistance to veneer fracture. J Dent Res. 89(10):1057–1062. [DOI] [PMC free article] [PubMed] [Google Scholar]
- Zhang Y, Sailer I, Lawn BR. 2013. Fatigue of dental ceramics. J Dent. 41(12):1135–1147. [DOI] [PMC free article] [PubMed] [Google Scholar]
- Zhang Z, Zhou S, Li Q, Li W, Swain M. 2010. Residual stresses in fabrication of core-veneered ceramic prostheses. Adv Mat Res 97–101:2241–2244. [Google Scholar]


