

Abstract
The pregnane X receptor (PXR) is a nuclear receptor found mainly in the liver and intestine, whose main function is to regulate the expression of drug metabolizing enzymes and transporters. Recently, it has been noted that PXR plays critical roles in energy homeostasis, immune response, and cancer. Therefore, identifying chemicals or compounds that can modulate PXR is of great interest, as these can result in downstream toxicity or, alternatively, may have therapeutic potential. Testing one compound at a time for PXR activity would be inefficient and take thousands of hours for large compound libraries. Here, we describe a high-throughput screening method which encompasses plating and treating HepG2-CYP3A4-hPXR cells in a 1536-well plate, as well as reading and interpreting assay (e.g., luciferase reporter gene activity) endpoints. These cells are stably transfected with a hPXR expression vector and CYP3A4 promoter-driven luciferase reporter vector, allowing for the identification of compounds which activate PXR through CYP3A4. We also describe how to analyze the data from each assay and explain follow-up steps, namely pharmacological characterization and quantitative polymerase chain reaction (qPCR) assays, which can be performed to confirm results from the original screen. These methods can be used to identify and confirm hPXR activators after completion of a compound screening.
Basic Protocol 1:
Establishment of a high-throughput assay to identify hPXR activators
Basic Protocol 2:
Quantitative high-throughput screening of a compound library to classify hPXR activators
Basic Protocol 3:
Performing pharmacological characterization and qPCR assays to confirm hPXR activators
Keywords: Pregnane X Receptor, PXR reporter gene assay, quantitative high-throughput screening
INTRODUCTION:
Nuclear Receptors belong to an important family of proteins that act as transcription factors regulating the expression of genes involved in metabolism, cell growth, and human development (Schulman, 2010). In particular, the pregnane X receptor (PXR) controls drug metabolizing enzymes (DMEs) and plays a role in energy homeostasis, inflammation, and cell proliferation (Kliewer et al., 1998; Kumar & Surapaneni, 2001; Sueyoshi & Negishi, 2001). Given that there is an increasing amount of chemicals being released into the atmosphere each year, alongside novel drugs being produced, the development of quick and easy approaches for discovering toxic and organism-interacting compounds is becoming increasingly relevant. As such, it has become of great interest to identify compounds that can modulate the induction or activity of PXR.
Low-throughput assays which only test a few compounds at a time are currently being used. It is relatively easy and accurate to transfect PXR expression and CYP3A4 promoter-luciferase vectors into each well of a 6-well, 12-well, or 24-well plate. However, with no high-throughput screening method, it would take years to test every chemical for PXR activation. Recently, a quantitative high-throughput method to identify chemicals that can act as human PXR activators has been reported (Lynch et al., 2021). This assay utilizes a double-stable cell line including the previously mentioned vectors for PXR and CYP3A4. The HepG2-CYP3A4-hPXR cell line (Lin et al., 2008) generates an easy-to-work with and ideal model for screening compounds in a high-throughput manner, producing the results in days, not years.
In this article, we describe how to set up a high-throughput screen, using the previously reported method (Lynch et al., 2021), so that a quick and accurate classification of PXR activators can be made. We also provide the steps to perform follow-up studies to ascertain the validity of the high-throughput data. By identifying PXR activators, therapeutic applications, potential drug-drug interactions, or other toxic implications can be identified.
To identify and confirm a compound as a PXR activator, the following protocol (Figure 1) should be followed. Basic Protocol 1 explains how to optimize a high-throughput cell-based luciferase reporter gene assay to identify PXR activators from a large library of compounds. The next logical step displayed below is the description of how to execute the high-throughput screen itself (Basic Protocol 2). This can be done using 96-, 384-, or 1536-well plates so that many compounds can be thoroughly examined in one efficient assay. Finally, Basic Protocol 3 portrays two different follow-up studies, including a pharmacological assay which can be used to measure the shift in potency of the studied compound [*Authors please clarify what you mean by “shift in potency] and a quantitative real-time polymerase chain reaction (RT-qPCR) to measure the induction of PXR’s most important drug metabolizing enzyme, CYP3A4. These two assays are performed in order to confirm the compounds identified in Basic Protocol 2 are true PXR activators.
Figure 1.

Overview of the protocol steps described throughout this article for the identification of hPXR activators. The blue words are action steps, while the words to the right of each down arrow display endpoints used for narrowing down the number of compounds in each step. NR = nuclear receptor. This image was partially created with BioRender.com.
BASIC PROTOCOL 1: Establishment of a high-throughput assay to identify hPXR activators
Optimization of a new assay can be time-consuming and sometimes challenging; to overcome these issues, the following protocol describes a step-by-step methodology for generating an in vitro high-throughput assay, employing luciferase reporter gene technology, to identify PXR activators. The first steps describe thawing and culturing a double-stable cell line which includes a human PXR expression vector and CYP3A4-luciferase plasmid (Lin et al., 2008). A double-stable cell line is preferred so that transient transfection does not need to be performed. Eliminating this transfection step decreases the experiment time and generates more consistent data due to a uniform population of cells containing both vectors in each well of the assay plate. These steps must be completed in a biological safety cabinet, to keep contamination to a minimum. Every laboratory needs to optimize the assay by testing a different number of cells/well, positive control concentration, and/or equipment settings. Therefore, an optimization step to address each of these items is necessary. Here, we show how to test multiple concentrations of cells/well and explain how to determine the optimal conditions for the assay. Once the optimization is complete, the assay will be ready for use in a high-throughput manner and ready to screen hundreds or thousands of compounds in one experiment.
Materials
Eagle’s Minimum Essential Medium [EMEM] (ATCC, cat. No. 30-2003)
HyClone Characterized Fetal Bovine Serum [FBS] (Cytiva, cat. No. SH30071.03)
Penicillin-Streptomycin [Penn-Strep] 10,000 U/mL (ThermoFisher Scientific, cat. No. 15140122)
HepG2-CYP3A4-hPXR stable cell line (Dr. Taosheng Chen, Department of Chemical Biology and Therapeutics, St. Jude Children’s Research Hospital) (Lin et al., 2008)
PXR Culture Media (see Reagents and Solutions)
Trypsin-EDTA [0.25%], phenol red (ThermoFisher Scientific, cat. No. 25200056)
Phosphate Buffered Saline [PBS], pH 7.4, [-] Calcium Chloride, [-] Magnesium Chloride (ThermoFisher Scientific, cat. No. 10010072)
70% (v/v) ethanol
PXR Assay Media (see Reagents and Solutions)
Dimethyl Sulfoxide [DMSO] (Millipore Sigma, cat. No. 472301, CAS Number 67-68-5)
Rifampicin (MilliporeSigma, cat. No. R3501, CAS Number 13292-46-1)
Tetraoctylammonium bromide (Millipore Sigma, cat. No. 294136, CAS Number 14866-33-2)
ONE-Glo Luciferase Assay System (Promega, cat. No. E6130)
Biological Safety Cabinet (Labconco, cat. No. 302610101 or equivalent)
Vacuum filter system, 500 mL (Corning Life Sciences, cat. No. 431205)
Water Bath, Isotemp (Fisher Scientific, cat. No. FSGPD20 or equivalent)
15-mL tubes (ThermoFisher Scientific, cat. No. 339651 or equivalent)
200-μL Pipette (Rainin, cat. No. 17008652 or equivalent)
200-μL Pipette Tips (Rainin, cat. No. 30389268)
Centrifuge (ThermoFisher Scientific, cat. No. 75004521 or equivalent)
10-mL pipettes (Corning Life Sciences, cat. No. 357551 or equivalent)
Pipetter (Integra Biosciences, cat. No. 155019 or equivalent)
225 cm2 (T-225) cell culture flasks (Corning Life Sciences, cat. No. 431082), Millicell HY 5-layer T-1000 cell culture flasks (Millipore Sigma, cat. No. PFHYS1008), or 175 cm2 collagen I coated flasks (ThermoFisher Scientific, cat. No. 132708)
CO2 Incubator (ThermoFisher Scientific, cat. No. 3310 or equivalent)
Tissue culture microscope (Carl Zeiss Microscopy, LLC, cat. No. 491237-0013-000 or equivalent)
Cell counter (Nexcelom Biosciences, cat. No. Cellometer Auto T4-IQOQ or equivalent)
White/Solid 1536-well flat bottom cell culture-treated plate (Greiner Bio-One, cat. no. 789173-F)
BioRAPTR2 Flying Reagent Liquid Dispenser (Let’s Go Robotics, Inc., Model No. BR2 or equivalent)
Microplate lids (Wako Automation, cat. No. 08-3241-0005)
Clear 1536-well compound plates (Greiner Bio-One, cat. No. 789270-C)
Pintool Station (Wako Automation, cat. No. Pintool1144-3100 PLUS VELOCITY or equivalent)
ViewLux uHTS Microplate Imager 1430-0010A (Perkin Elmer, cat. No. 26149 or equivalent)
Graphpad Prism Software (or equivalent)
Protocol Steps:
Thawing HepG2-CYP3A4-hPXR cells
-
In the biological safety cabinet, prepare a 500 mL vacuum filter system. Make thaw media by combining 500 mL of EMEM, 50 mL of FBS, and 5 mL of Penn-strep and filter the liquid. Store up to 1 month at 4°C.
Every item going in and out of the biological safety cabinet should be wiped down with 70% Ethanol solution to minimize contamination.
Warm thaw media up to 37°C using a water bath.
-
In the biological safety cabinet, put 9 mL of warmed thaw media into a 15-mL tube.
A different amount of media can be used as long as you later balance that amount in the centrifuge.
-
Take a single vial of frozen HepG2-CYP3A4-hPXR cells and place in a 37°C water bath for about 3 minutes or until the mix starts to thaw.
The abrupt temperature shift from −150°C to 37°C can be damaging to some of the cells. Limiting the thaw time in the water bath can help alleviate this effect. If using a 175 cm2 flask or larger, ensure that at least 10 million cells are being thawed.
-
Wipe the vial with 70% ethanol and then, in the safety cabinet, pour the cell solution into the 9 mL of warmed thaw media. Any remaining liquid in the vial should be taken out and put into the 15 mL tube, using a 200-μL pipette.
Any small pipette will suffice as long as the tip is small enough to get into the bottom of the vial.
Pipette up and down 5-10 times with a 10 mL pipette, to break up clumps of cells.
-
Centrifuge cells at 900 rpm, for 4 minutes, at room temperature.
Since high speeds are being used, remember to balance the centrifuge properly.
-
Pour off supernatant from cell pellet into a waste bin and add 10 mL of fresh warmed thaw media. Pipette cells up and down at least 10 times using a 10 mL pipette. Pour this cell suspension into a 175 cm2 collagen I coated flask and swirl around slightly.
A collagen coated flask is used for more optimal attachment of cells and can even improve end results.
Incubate at 37°C and 5% CO2 for a few days, or until cells are at least 80% confluent.
Culturing HepG2-CYP3A4-hPXR cells
-
10.
Warm up culture media in a 37°C water bath. Let trypsin solution warm up to room temperature.
-
11.
Pour off used media from the HepG2-CYP3A4-hPXR cells flask into a waste bin.
-
12.
Add 10 mL of PBS to the flask and swirl around. Pour off PBS into waste bin. Repeat 2 times.
This is a very important step. All the debris needs to be washed away with PBS that does not contain calcium chloride (CaCl2) or magnesium chloride (MgCl2) before the trypsin is added. If no PBS is used, or PBS with CaCl2 and MgCl2, the cells will not detach from the flask properly.
-
13.
Add 6 mL of trypsin to the flask and swirl around to cover the entire flask. Place the flask in the incubator for 3-5 minutes until cells start to detach from flask.
-
14.
Add 4 mL of warmed culture media to the flask. Swirl or pipette liquid around to release and gather as many cells as possible. Suck up cells and media and put into a 50-mL tube.
-
15.
Centrifuge at 900 rpm for 4 minutes at room temperature.
-
16.
Pour off supernatant and resuspend cells in 10 mL of fresh culture media. Pipette up and down at least 10 times to break up clumps.
-
17.
Acquire a new 175 cm2 collagen I coated flask and pour 40 mL of fresh culture media into the flask.
-
18.
Count the cells and transfer about 20 million cells into the flask. Put this flask back in the incubator at 37°C and 5% CO2 until the cells become about 80% confluent.
There may be cell debris over the next few days as the selection antibiotic starts to work and kill the cells which do not contain the correct plasmid. If there appears to be a lot of floating cells, it may be prudent to pour off the media and add fresh culture media to the flask.
-
19.
Culture cells for at least another passage, repeating steps 11 - 19. This is to ensure the highest number of correct cells are present.
Usually, these cells need to be subcultured every 3-4 days. Once they are 80% confluent, they should be used for the assay or passaged again.
Performing optimization assay
-
20.
Warm assay media to 37°C using a water bath.
-
21.
Repeat steps 12 – 17 using assay media instead of culture media. Count the newly made cell suspension.
-
22.
Generate 5.0 x 10⁵ cells/mL and 9.0 x 10⁵ cells/mL solutions using assay media.
-
23.
Plate 5 μL of each suspension into the first four columns of white 1536-well plates using a liquid dispenser.
In this example, the number of cells in plate 1 should be around 2500 cells/well, while plate 2 should have 4500 cells/well. This cell number is one of the parameters which will be optimized to fit the needs of the experiment. These assays can also be adapted for plates with fewer wells; an optimization and scale-up will need to be performed.
-
24.
Place a microplate lid on top of each assay plate and place the plates in an incubator set to 37°C and 5% CO2 for about 4 – 5 hours.
This is done so that the cells have adequate time to attach to the bottom of each well.
-
25.
Create a positive control compound plate for the assay using DMSO, rifampicin, and tetraoctylammonium bromide in the first four columns of a new clear compound plate. Store at −20°C when not in use.
An example of this can be seen in Figure 2 (top, left plate) and would contain a duplicate 1:2 dilution of rifampicin starting at 20 mM (final concentration of 92 μM) in column 1, the upper half of column 2 contains a single dose of rifampicin at 10 mM (final concentration of 46 μM), the lower half of column 2 contains a single dose of rifampicin at 5 mM (final concentration of 23 μM), the upper half of column 3 and all of column 4 contains DMSO, and the lower half of column 3 contains tetraoctylammonium bromide at 20 mM (final concentration of 92 μM). The tetraocylammonium bromide only needs to be added to the control plate if a cytotoxicity assay is being performed in tandem. If this control plate will not be used for another assay, the tetraocylammonium bromide does not need to be added. Either of the single dose concentrations of rifampicin can be used as the positive control; whichever concentration gives the highest signal. These two concentrations can be optimized for each laboratory’s own use.
-
26.
Transfer 23 nL of the positive control plate to the cell plate using a Wako Pintool station. Incubate at 37°C, 5% CO2 for 24 hours.
Figure 3 shows the proper confluency and healthiness of this cell line, plated in a 1536-well plate after a 23-hour treatment with DMSO.
-
27.
Add 4 μL of ONE-glo reagent to each well including cells (first four columns of plates 1 and 2). Incubate at room temperature for 30 minutes.
ONE-glo and reagent 2 were both studied to determine which luminescent reagent exhibited optimal performance in our conditions (Figure 4). Different luciferase reagents can be studied to establish which works best in each laboratory.
-
28.
Acquire the luminescence signal from the plate using a plate reader.
If using a ViewLux, example settings are as follow: 60 s readout, low speed, high gain, 2x binning. These numbers will have to be optimized depending on the specific assay and instrument of use.
-
29.
Analyze the data, using the equation below, and generate the % activity curve using GraphPad (Figure 5).
Use the following equation to analyze the concentration response curves: % Activity = [(Vcompound-VDMSO)/(Vrifampicin-VDMSO)]*100, where Vcompound equals the well values, Vrifampicin denotes the median value of the 16 wells of rifampicin at one concentration, and VDMSO represents the median values of the DMSO-only wells. Remember to transform the concentrations (x-axis) into Log(x) values to have correct graphical representation. To do this in GraphPad, press the analyze button, once the molar concentrations are typed in with their respective % activity data, and click transform. When the new window pops up, click the box marked “Transform X values using”. Toggle down to X=Log(X) and click ok.
-
30.
Acquire an EC50 for all compounds.
Once % activity values are put into GraphPad and your concentrations are transformed into log values, click analyze again. Under the XY analyses topic, click “Nonlinear regression (curve fit)”. When the new window pops up, use the “log(agonist) vs. response – Variable slope (four parameters)” and click ok. Once the analysis comes up, copy the EC50 values onto your graph. Data should be in a sigmoidal shape with an actual number as an EC50, not an ambiguous one (~). When analyzing the curve for the positive control, the top of the curve should have a value of around 100% because the positive control dose response numbers are being compared to a single concentration of the same compound (rifampicin).
-
31.
Choose the optimum cell number, based on the % activity curve and EC50.
Figure 2.

Compound plate map for treating cells with controls. When combining a positive control and cells into one assay plate, the pintool is used to automatically add 23 nL of positive control liquid into each well already containing cells. The light pink wells in the assay plate (top right) depict plated cells which have already attached to the bottom. The dark red wells in column one of the control compound plate (top left) depict the dose response (DR) of rifampicin, the positive control. The dark pink and medium pink wells in column 2 display the single concentrations of rifampicin used in the assay, 10 mM and 5 mM, respectively. The black wells in the bottom of column 3 represent tetraoctylammonium bromide at 20 mM, while the green wells in columns 3 and 4 portray the DMSO containing wells. A picture of the pintool station is also displayed in the middle of the figure. This image was created with BioRender.com.
Figure 3.

Morphology of healthy HepG2-hPXR-CYP3A4 cells. HepG2 cells were plated in assay media at 2500 cells/well in a 1536-well plate and allowed to attach overnight. The microscope picture was taken at 10x.
Figure 4.

Luminescent reagent comparison. HepG2-hPXR-CYP3A4 cells were treated with multiple concentrations of rifampicin and luminescence values were identified after the addition of either ONE-Glo or Reagent 2. Each curve represents the mean ± SD of duplicate wells.
Figure 5.

Optimization of cell number per well in 1536 well plates. HepG2-hPXR-CYP3A4 cells were plated with 2500 cells/ well or 4500 cells/well. Luminescent values were identified after the treatment with rifampicin. The % activity was calculated by comparing each data point to that of the positive control, RIF (100% = RIF activity). Each curve represents the mean ± SD of triplicate wells.
Based on Figure 5, 2500 cells/well gives an EC50 of 2.437 μM while 4500 cells/well gives an ambiguous ~190.4 M EC50. The curvature is also sigmoidal for the 2500 cells/well but not for the 4500 cells/well. Therefore, the cell number that should be used for Basic Protocol 2 is 2500 cells/well.
BASIC PROTOCOL 2: Quantitative high-throughput screening a compound library to classify hPXR activators
Once the assay is optimized according to Basic Protocol 1, a high-throughput screen can be conducted. Profiling thousands of compounds at one time will reduce total experiment time and reagent supplies. In essence, Basic Protocol 2 is the same assay as that completed in Basic Protocol 1, just on a larger scale. This protocol describes the steps in performing a high-throughput luciferase reporter gene assay to identify hPXR activators from a large library of compounds. After the screening is complete, the potency and efficacy of each compound tested can be calculated. The potential PXR agonists identified from the screen can be further examined in the confirmation assays (covered in Basic Protocol 3). This protocol will also explain how to identify the most potent and efficacious compounds by calculating the maximum response and EC50 values; however, there is a need to account for the shape of the concentration curve as well, previously explained in a methods chapter (Huang, 2016).
Materials:
HepG2-CYP3A4-hPXR stable cell line (Dr. Taosheng Chen, Department of Chemical Biology and Therapeutics, St. Jude Children’s Research Hospital) (Lin et al., 2008)
PXR Assay Media (see Reagents and Solutions)
Phenol red-free Dulbecco’s Modified Eagle’s Medium [DMEM] (ThermoFisher Scientific, cat. No. 31053028)
FBS, charcoal stripped (ThermoFisher Scientific, cat. No. 12676029)
Sodium pyruvate 100 mM (ThermoFisher Scientific, cat. No. 11360070)
L-Glutamine 200 mM (ThermoFisher Scientific, cat. No. 25030081)
Positive control plate (Basic Protocol 1, step 26)
Compound library plates: e.g., Tox21 10K Compound Library plates (Attene-Ramos et al., 2013)
ONE-Glo Luciferase Assay System (Promega, cat. No. E6130)
Biological Safety Cabinet (Labconco, cat. No. 302610101 or equivalent)
Water Bath, Isotemp (Fisher Scientific, cat. No. FSGPD20 or equivalent)
50 mL tubes (Corning Life Sciences, cat. No. 352070 or equivalent)
Centrifuge (ThermoFisher Scientific, cat. No. 75004521 or equivalent)
225-cm2 (T-225) cell culture flasks (Corning Life Sciences, cat. no. 431082), Millicell HY 5-layer T-1000 cell culture flasks (Millipore Sigma, cat. no. PFHYS1008), or 175-cm2 collagen-I-coated flasks (ThermoFisher Scientific, cat. no. 132708)
10 mL pipettes (Corning Life Sciences, cat. No. 357551 or equivalent)
Pipetter (Integra Biosciences, cat. No. 155019 or equivalent)
CO2 Incubator (ThermoFisher Scientific, cat. No. 3310 or equivalent)
Tissue culture microscope (Carl Zeiss Microscopy, LLC, cat. No. 491237-0013-000 or equivalent)
Cell counter (Nexcelom Biosciences, cat. No. Cellometer Auto T4-IQOQ or equivalent)
White/Solid 1536-well flat bottom cell culture-treated plate (Greiner Bio-One, cat. no. 789173-F)
Multidrop™ Combi Reagent Dispenser (ThermoFisher Scientific, cat. No. 5840300 or equivalent)
Microplate lids (Wako Automation, cat. No. 08-3241-0005)
Pintool Station (Wako Automation, cat. No. Pintool1144-3100 PLUS VELOCITY or equivalent)
ViewLux Plate Reader (Perkin Elmer, cat. No. 1430-0010A or equivalent)
GraphPad Prism Software (or equivalent)
Protocol steps:
Warm assay media to 37°C using a water bath. Let trypsin warm up to room temperature.
Repeat steps 12 – 17 from Basic Protocol 1, using assay media instead of culture media. Count the newly made cell suspension.
-
Generate a 5.0 x 10⁵ cells/mL solution. Plate 5 μL of cell suspension into every well of white solid 1536-well plates using a multidrop liquid dispenser. Place a microplate lid on top of each plate and place the plates in an incubator set to 37°C and 5% CO2 for about 4 – 5 hours.
Plate as many plates as the library chosen requires. Perform triplicate experiments for each compound plate when possible so that proper statistics and more robust data can be attained.
-
Transfer 23 nL of the previously generated positive control plate from Basic Protocol 1 step 26, as well as 23 nL from the compound library plates, to the cell plate using a Wako Pintool station (Figure 6).
Library plates should have compounds in columns 5 – 48 only. The assay plates should contain compounds from the control plates in columns 1 – 4 and compounds from the library plates in columns 5 – 48. If performing concentration response curves, the first library plate should have the lowest concentration of each compound, followed by the second plate having the next highest concentration, and so forth. When triplicate experiments are performed, a plate with only DMSO-treated cells (23 nL, equaling a final value of 0.46% DMSO in the well) should be put in between replicates to ensure there is no crossover of compound before the next batch is started; this will produce more accurate data.
Incubate at 37°C, 5% CO2 for 24 hours.
-
Follow steps 28 – 31 from Basic Protocol 1.
Hundreds and thousands of compounds can be assayed in one experiment if a robot is available. Not having access to a robot will be a rate limiting step in many laboratories. The data should generate curves, as in Figure 5, for each compound screened.
-
Select positive compounds as well as a few negative compounds. Repeat assay with newly formed library plates comprising those selected compounds.
Identify compounds with high efficacy (maximum response) and low potency (EC50) values (Huang, 2016). In GraphPad, the maximum response value is listed as “Top”. An example of this narrowing down is to use an efficacy value of >80% of rifampicin’s value (positive control) with a potency value of < 10 μM. However, these values can be adjusted based on the results of each assay. It is important to include some negative test compounds as well to confirm the validity of the assay.
-
Proceed to Basic Protocol 3 to complete follow-up studies on a small number of the most promising compounds.
The number of selected compounds should relate to the ability of the laboratory to complete each follow-up assay. The selection of compounds should be based on highest efficacy, lowest potency, pricing, commercial availability, and practical or clinical importance of compounds.
Figure 6.

Flow chart for compound treatment. A pintool station combines 23 nL of liquid from the first four columns of the positive control plate (top left) and columns 5-48 (top right) of the compound plate and put it into the assay plate (middle), which already has attached cells inside, to generate a combined assay/compound plate (bottom). This image was created with BioRender.com.
BASIC PROTOCOL 3: Performing pharmacological characterization and qPCR assays to confirm hPXR activators
Once a manageable group of compounds is chosen after a primary screening, such as in Basic Protocol 2, additional studies can be conducted to further confirm compound modulation of PXR. Here we first discuss how to perform a pharmacological study, which will display a shift in EC50 values and concentration response curves if the compound’s activity is due to PXR activation. If, after adding increasing amounts of PXR antagonist (SPA70) (Lin et al., 2008), a compound’s EC50 value becomes higher while obtaining a right shifting concentration response curve, the compound is further confirmed as a PXR activator. The second section demonstrates how to perform an RT-qPCR assay. This assay is used to identify the induction or inhibition of the mRNA expression of a particular gene. In this case, we are looking at the main DME which PXR regulates, CYP3A4. If a compound activates PXR, it should also increase the expression level of CYP3A4. The combination of these assays should corroborate the previous data, from Basic Protocol 2, and a safe conclusion can be made to identify a compound as a true PXR activator.
Materials:
HepG2-CYP3A4-hPXR stable cell line (Dr. Taosheng Chen, Department of Chemical Biology and Therapeutics, St. Jude Children’s Research Hospital) (Lin et al., 2008)
PXR Assay Media (see Reagents and Solutions)
Candidate compounds from Basic Protocol 2, Step 7
Dimethyl Sulfoxide [DMSO] (Millipore Sigma, cat. No. 472301, CAS Number 67-68-5)
SPA70 (MilliporeSigma, cat. No. SML2662, CAS Number 931314-31-7)
ONE-Glo Luciferase Assay System (Promega, cat. No. E6130)
NoSpin™ HepaRG™ (Lonza Bioscience, cat. No. NSHPRG)
William’s E Medium, no phenol red (ThermoFisher Scientific, cat. No. A1217601)
HepaRG™ Thawing and Plating Medium Supplement (Lonza Bioscience, cat. No. MHTAP)
Penicillin-Streptomycin [Penn-Strep] 10,000 U/mL (ThermoFisher Scientific, cat. No. 15140122)
70% (v/v) ethanol
PBS, pH 7.4, [-] Calcium Chloride, [-] Magnesium Chloride (ThermoFisher Scientific, cat. No. 10010072)
UltraPure™ DNase/RNase-Free Distilled Water (ThermoFisher Scientific, 10977023)
Human GAPDH Endogenous Control (FAM™/MGB probe, non-primer limited) (ThermoFisher Scientific, cat. No. 4352934E, Assay ID: Hs99999905_m1)
Human CYP3A4 (FAM™/MGB probe) (ThermoFisher Scientific, cat. No. 4331182, Assay ID: Hs00604506_m1)
Clear 1536-well compound plates (Greiner Bio-One, cat. No. 789270-C)
Biological Safety Cabinet (Labconco, cat. No. 302610101 or equivalent)
Water Bath, Isotemp (Fisher Scientific, cat. No. FSGPD20 or equivalent)
50 mL tubes (Corning Life Sciences, cat. No. 352070 or equivalent)
200 μL Pipette (Rainin, cat. No. 17008652 or equivalent)
200 μL Pipette Tips (Rainin, cat. No. 30389268)
Centrifuge (ThermoFisher Scientific, cat. No. 75004521 or equivalent)
10 mL pipettes (Corning Life Sciences, cat. No. 357551 or equivalent)
Pipetter (Integra Biosciences, cat. No. 155019 or equivalent)
CO2 Incubator (ThermoFisher Scientific, cat. No. 3310 or equivalent)
Tissue culture microscope (Carl Zeiss Microscopy, LLC, cat. No. 491237-0013-000 or equivalent)
Cell counter (Nexcelom Biosciences, cat. No. Cellometer Auto T4-IQOQ or equivalent)
White/Solid 1536-well flat bottom cell culture-treated plate (Greiner Bio-One, cat. No. 789173-F)
BioRAPTR2 Flying Reagent Liquid Dispenser (Let’s Go Robotics, Inc., Model No. BR2 or equivalent)
Microplate lids (Wako Automation, cat. No. 08-3241-0005)
Pintool Station (Wako Automation, cat. No. Pintool1144-3100 PLUS VELOCITY or equivalent)
ViewLux Plate Reader (Perkin Elmer, cat. No. 1430-0010A or equivalent)
BioCoat® Collagen 1-coated 12-well plate (Corning Life Sciences, cat. No. 354500)
Rneasy Midi Kit (Qiagen, cat. No. 75144)
TaqManTM Gene Expression Master Mix (ThermoFisher Scientific, cat. no. 4370074)
Nanodrop Spectrophotometer (DeNovix DS-11+ or equivalent)
High-Capacity RNA-to-cDNA™ Kit (ThermoFisher Scientific, cat. No. 4387406)
Thermal Cycler Model 2720 (Applied Biosystems, cat. No. 4359659 or equivalent)
MicroAmp® Optical 384-Well Reaction Plate with Barcode (ThermoFisher Scientific, cat. No. 4309849)
MicroAmp® Optical Adhesive Film (ThermoFisher Scientific, cat. No. 4311971)
Sealing Roller
QuantStudio 5 Real-Time PCR System (ThermoFisher Scientific, Ref. No. A28135 or equivalent)
GraphPad Prism Software (or equivalent)
Protocol steps:
Executing the pharmacologic study
-
Aliquot promising compounds chosen, from Basic Protocol 2 step 7, into compound plates.
A concentration response curve should be able to be acquired from these plates. Remember to use only columns 5-48 of the compound plate, so that the previously made positive control plate can still be used (columns 1-4). Therefore, use a 1:3 dilution starting with 20 mM stock compound in DMSO. Each compound should have quadruplicate amounts of each concentration. For example, the first compound chosen should have a 20 mM concentration in wells 5A, 6A, 5B, and 6B. This compound should then have a 6.67 mM concentration in wells 5C, 6C, 5D, and 6D. This should be repeated until 5AF and 6AF are filled. Columns 7 and 8 should contain the next chosen compound, and so on.
-
Generate a HepG2-CYP3A4-hPXR cell suspension, using assay media from the cells still being passaged from Basic Protocol 1 Step 20, with a concentration of 6.25 x 10⁵ cells/mL. Plate 4 μL of cell suspension into every well of white/solid 1536-well plates using a liquid dispenser. Place a lid on top of each plate and place the plates in an incubator set to 37°C and 5% CO2 for about 4 – 5 hours.
Plate 3 times as many plates as there are compound plates made in Step 2. For example, if there was one plate of follow-up compounds generated, plate 3 plates full of cells. Perform this experiment 3 times when possible so that proper statistics and robust data can be attained. Leave the plates in the incubator until the cells are attached.
Transfer 23 nL of the previously generated positive control plate from Basic Protocol 1 Step 26, as well as 23 nL from the compound plates produced in Step 2, to each cell plate using a Wako Pintool station (Figure 6).
-
Using assay media, make 2.5 mL (per plate) of co-treatment (DMSO, 2.5 μM SPA70, and 3.75 μM SPA70).
Add 6.25 μL of 1 mM SPA70 stock (in DMSO) to 2.5 mL of assay media to generate 2.5 μM SPA70. Add 9.38 μL of 1 mM SPA70 stock (in DMSO) to 2.5 mL of assay media to generate 3.75 μM SPA70. Add 9.38 μL of DMSO to 2.5 mL of assay media to represent the negative control. [*Might the preceding information be better incorporated into step 4?] Always use the same amount of DMSO as the highest amount of compound added. SPA70 is a known selective PXR antagonist (Lin et al., 2008). The concentrations of SPA70 chosen here were identified using optimization assays. However, the concentrations may vary depending on the performance of the assay in a different laboratory.
Add 1 μL of DMSO co-treatment to plate 1, 2.5 μM SPA70 (final concentration of 0.5 μM) co-treatment to plate 2, and 3.75 μM SPA70 (final concentration of 0.75 μM) co-treatment to plate 3, in every well of the respective plates.
-
Follow Steps 28 – 30 from Basic Protocol 1 to perform the luciferase reporter gene experiment on these plates.
When the 3 curves from each compound are compiled into one graph, a clear right shift should be seen from DMSO to increasing SPA70 concentrations for each positive compound, as shown in Figure 7.
Figure 7.
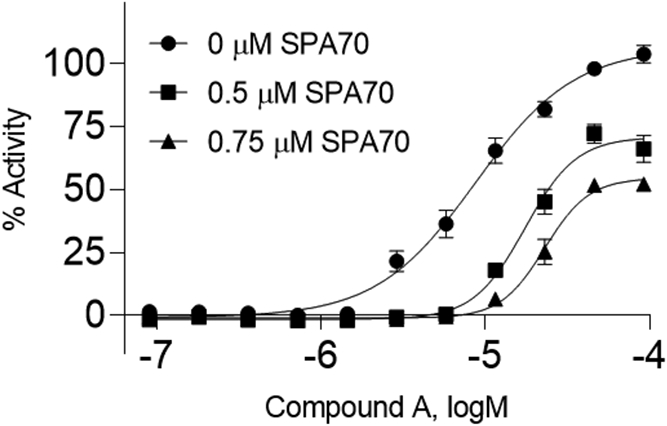
Pharmacological characterization of compound A. In this pharmacological assay, HepG2-hPXR-CYP3A4 cells were treated with multiple concentrations of Compound A and co-treated with 0, 0.5, or 0.75 μM of SPA70, a known PXR inhibitor. The % activity was calculated by comparing each data point to the positive control, RIF (100% = RIF activity). Data are expressed as the mean ± SD of triplicate experiments.
Quantitative Real-Time Polymerase Chain Reaction
-
7.
Make HepaRG™ culture media by combining 200 mL of William’s E Medium, 23.6 mL of HepaRG™ Thawing and Plating Medium Supplement (MHTAP), and 0.5 mL (25 U/mL) of Penn-strep. Store for up to 1 month at 4°C.
Every item going in and out of the biological safety cabinet should be wiped down with 70% Ethanol solution to minimize contamination. The supplements used may require another optimization step necessary to obtain optimal data; it is recommended that the manufacturer’s instructions for other supplements be looked at if the experiment does not appear to work.
-
8.
Warm the HepaRG™ culture media in a 37°C water bath.
-
9.
Thaw a frozen vial of HepaRG™ cells in a 37°C water bath until only a small piece of ice remains (about 90 seconds).
Do not fully submerge the vial into the water bath as this may cause contamination; only submerge enough of the vial in water to cover the frozen cells.
-
10.
Add the entire vial of cells into 9 mL of the prewarmed HepaRG™ culture media.
Use a small pipette to ensure the entire amount of liquid is transferred from the vial of cells. A 15- or 50-mL conical tube may be used for this step.
-
11.
Centrifuge at 100 x g for 5 minutes.
The manufacturer recommends skipping the centrifugation step when plating these cells; however, in our hands, a spin step generates a clean pellet free from any freezing chemicals with no harsh ramifications.
-
12.
Remove the supernatant and resuspend the pellet using 10 mL of fresh prewarmed HepaRG™ culture media.
-
13.
Plate HepaRG™ cells in a 12-well collagen coated plate at a concentration of 8x10⁵ cells/well (Day 0).
Cells should be plated in a confluent manner as these are fully differentiated and will not be passaged further.
-
14.
Incubate the plates at 37°C, 5% CO2.
-
15.
Acquire the EC70 for each selected compound using GraphPad software.
Once the % activity values, from the primary high-throughput screen are input into GraphPad and the concentrations are transformed into log values, click analyze again. Under the XY analyses topic, click “Nonlinear regression (curve fit)”. When the new window pops up, go to the section labeled “Dose Response – Special” and click the “log(agonist) vs. response – Find ECanything”. Next click on the Constrain tab and put “70” into the value box next to the constant F. (Where F=fraction of maximal response.) Click ok. Once the analysis comes up, copy the EC70 values onto your graph.
-
16.
On day 3, after determining that the cells are healthy under a microscope, exchange the old media with 1 mL of fresh media into each well.
See Figure 8A for an image of what healthy cells look like, under 10x. If the cells get contaminated or are not looking healthy (Figure 8B), they should be discarded, and the experiment started over.
-
17.
Treat the cells with each of the promising compounds (one well per treatment) by adding the correct amount of stock solution to the fresh media.
Using the EC70 from the concentration response curve, as the treatment concentration, generated in Step 15 is a good starting point. The goal is to use a concentration with a high efficacy but low potency value, so that the cells remain healthy throughout the experiment. If the EC70 value generates toxicity, lower the concentration in the next experiment. Make sure to also include a negative solvent control of the liquid used to dissolve your compounds (example: DMSO) and a positive control (Rifampicin, 10 μM) to ensure the assay worked. Due to the expense of metabolically competent cells, we recommend starting with one concentration for each compound. If possible, we also suggest making a 1000x stock solution of the compounds being used so that the user can add 1 μL of stock solution to the 1 mL of fresh media. For example, generate a 10 mM stock solution of rifampicin so that 1 μL will be added to the cells, generating a final treatment concentration of 10 μM.
-
18.
Gently shake the plate vertically, as well as horizontally, four times. This will ensure the compound being spread around the well and into the correct homogenous concentration.
-
19.
Place the treated plate back into the incubator at 37°C and 5% CO2 for 24 hours.
-
20.
After the 24-hour treatment, examine each well under a microscope.
Take note of any toxicity, contamination, or abnormal appearance. This will help make sense of the data if a number seems incorrect after the experiment.
-
21.
Suck out the media and wash each well with 1 mL of PBS two times.
-
22.
Harvest the cells by adding 350 μL of lysis buffer to each well.
Buffer RLT from the Qiagen Rneasy midi-prep kit was used for this protocol. However, other lysis buffers can be used and should be optimized for each respective laboratory. The amount of lysis buffer was based on the manufacturer’s recommendation. If necessary, the protocol may be paused here by putting the plate into a −80°C freezer until needed. If no kit is available, TRIzol™ may be used instead for the isolation of RNA; follow the manufacturer’s instructions carefully as using this chemical has many more steps which can generate errors.
-
23.
Perform RNA extraction using the Rneasy kit following their instructions precisely.
For the final step of this protocol, 30 μL of RNase free water was used to elute the RNA off the column and into a tube. Again, the protocol may be paused here by placing the samples in a −80°C freezer.
-
24.
Use a spectrophotometer to determine the RNA concentration of each sample.
The 260/280 ratio should be around 2.0 if your RNA is pure; when there is a protein, phenol, or other contaminant, the ratio will be much lower than 2.0 and this sample will not provide high quality data. Also, the 260/230 ratio should be between 2.0 and 2.2; if this value is higher, the sample may be contaminated with unwanted organic compounds.
-
25.
Using 1 μg of cDNA, perform reverse transcriptase using a high-capacity RNA-to-cDNA kit according to the manufacturer’s instructions. Store cDNA samples for up to 1 month at −20°C.
This step should be performed on ice until the samples are put in the thermal cycler. Be sure to vortex and then spin down the samples before placing them into the thermal cycler.
-
26.
Add 80 μL of water to each sample.
This will work for most samples as they are very concentrated. However, there may need to be less of a dilution if the RT-qPCR data cannot be quantified in the final steps (no CT value detected).
-
27.
Calculate how many wells, in a 384-well PCR assay plate, are needed for each gene. Figure 9 shows an example of a plate setup for 5 cDNA samples in triplicate.
A 96-well assay plate may also be used depending on the block in the specific assay machine used for this procedure. Each sample should be tested in triplicate for each gene. There should also always be extra made (example: 3 extra wells) so that some loss can be attained from the pipette tips.
-
28.
Generate gene mixes according to Table 1 using TaqMan™ Master Mix and the appropriate gene probes.
SYBR Green can also be used here; however, it is not as specific as a probe and there may be more variable data. TaqMan acquires cleaner and more reproducible data but is much more expensive, so each laboratory must optimize according to their needs. When selecting the correct primers/probes, always include an endogenous control that is stably expressed in the cell line to use as a reference gene (e.g., GAPDH, β-actin, etc.). For all nuclear receptors, commonly regulated genes should be chosen; for example, in this assay use CYP3A4 to represent modulation of PXR.
-
29.
Add 16 μL of each mix to the corresponding wells being assayed for that gene.
-
30.
Add 4 μL of each diluted cDNA sample into the correct wells, creating a total of 20 μL per well.
A no template control should also be tested to ensure the DNA is not contaminated. To do this, combine 16 μL of each one of the mixes with 4 μL of water. The amplification plot for each mix of no template control should display higher CT values than the control or sample dilutions. If they are not, your sample may include extraneous nucleic acid contamination and the assay will need to be completed again with extra caution for contamination being used.
-
31.
Add an adhesive seal firmly onto the plate, using a sealing roller, and ensure all sides are correctly stuck.
-
32.
Mix and spin down the plate, using a vortex and centrifuge respectively, to ensure there a homogenous liquid completely spun into the bottom of the well.
-
33.
Place the plate into the corresponding block of a PCR machine.
-
34.
Use a protocol which best fits the primers bought, according to the manufacturer’s instructions.
-
35.
Analyze the data according to the Fold = 2−ΔΔCt method, where ΔCt represents the differences in cycle threshold numbers between CYP3A4 (or the genes in question) and GAPDH, and ΔΔCt represents the relative change in these differences between negative control and treatment groups (Livak & Schmittgen, 2001).
Figure 8.

Morphology of healthy and toxic HepaRG cells. HepaRG cells were treated for 23 hours with DMSO (A) and a toxic compound (B) visually representing proper healthy cells and damaged cells, respectively. The microscope pictures were taken at 10x.
Figure 9.

Illustrative display of an RT-qPCR plate setup. The blue circles represent wells with a GAPDH probe while the pink circles represent wells including a CYP3A4 probe. The red box encircling Row A displays samples treated with DMSO (three blue and pink), while the blue box (Row C) defines the samples treated with rifampicin, the positive control. The pink boxes (Rows E, G, and I) identify there are three compounds being tested for identification of modulation of GAPDH and CYP3A4. This image was created with BioRender.com.
Table 1.
An example of PXR gene expression mixes for RT-qPCR
| 1 well | GAPDH (18 wells) |
CYP3A4 (18 wells) |
|
|---|---|---|---|
| 2x Master Mix (μL) | 10 | 180 | 180 |
| Probe (μL) | 1 | 18 | 18 |
| Water (μL) | 5 | 90 | 90 |
REAGENTS AND SOLUTIONS:
Cell Culture Media
880 ml of Eagle’s Minimum Essential Medium [EMEM] (ATCC, cat. No. 30-2003)
100 mL Characterized Fetal Bovine Serum [FBS] (Cytiva, cat. No. SH30071.03), 10% v/v
10 mL Penicillin-Streptomycin [Penn-Strep] (ThermoFisher Scientific, cat. No. 15140122), 1% v/v
10 mL Geneticin (ThermoFisher Scientific, cat. No. 10131027), 500 μg/mL
Filter under biological safety cabinet conditions. Store at 4°C for up to 1 month.
PXR Assay Media
920 ml of Phenol red-free Dulbecco’s Modified Eagle’s Medium [DMEM] (ThermoFisher Scientific, cat. No. 31053028)50 mL Charcoal Stripped FBS (ThermoFisher Scientific, cat. No. 12676029), 5% v/v
10 mL Penn-Strep (ThermoFisher Scientific, cat. No. 15140122), 1% v/v
10 mL Sodium Pyruvate 100 mM (ThermoFisher Scientific, cat. No. 11360070), 1 mM
10 mL L-Glutamine 200 mM (ThermoFisher Scientific, cat. No. 25030081), 2 mM
Filter under biological safety cabinet conditions. Store at 4°C for up to 1 month.
COMMENTARY:
Background Information:
Identification and characterization of potential novel modulators of nuclear receptors are important steps when identifying toxic drug-drug interactions, toxicity determination, or potential therapeutic benefits. Previously, this process has been low-throughput and, therefore, time consuming and slow (Attene-Ramos et al., 2013). The ethics of utilizing in-vivo animal models, when other options are available, has also become a global concern (Hsu et al., 2016). However, there have been recent strides in generating a high-throughput method that can be used for different nuclear receptors (Lynch, Mackowiak, et al., 2019; Lynch et al., 2021; Lynch et al., 2017; Lynch, Zhao, et al., 2019). When screening in a high-throughput manner, thousands of compounds can be assayed in one experiment, leading to a quick and reliable technique. One of the main disadvantages to these methods is the lack of an efficient metabolic capability. When a drug is ingested, often the chemical goes through metabolism and these high-throughput assays don’t often account for this natural process. Immortalized cell lines are frequently used in high-throughput screens due to the ease of working with them, their availability, cost, and durability. However, these cells do not usually contain a necessary metabolic component and may not represent human conditions. Therefore, follow-up studies are always an essential part of validating compounds identified from a high-throughput screen.
The detailed protocols described above were finalized after many different optimization steps, including examining various reagents, machines, and equipment settings. However, different machines may need different settings and reagents. For instance, Figure 4 represents the difference between using ONE-Glo and reagent 2, clearly identifying ONE-Glo as the superior reagent in this laboratory for this assay. The cell-type is another aspect that should be addressed when utilizing a luciferase reporter gene assay; transient transfection can be used with low- or medium-throughput but will be a disadvantage in a high-throughput assay. When performing a transient transfection, each well must include cells containing both plasmids (i.e., PXR and CYP3A4-luc); the transiently transfected cells often contain heterogenic cell populations, causing a high level of variability in the assay. Therefore, it is crucial to have a stable cell line when performing a high-throughput nuclear receptor luciferase reporter gene assay.
Pharmacological assays are often used to assess a drug’s activity by employing in-vivo animal models (Drug Discovery and Evaluation: Pharmacological Assays, 2016). However, as previously stated, it has become imperative to decrease animal usage in the scientific community. The pharmacological assay described above allows for the determination of PXR’s agonistic activity, without using an animal model. Once again, however, a metabolic component is missing in this assay and further experiments are necessary to verify the activity. In the assay above, SPA70, a known PXR antagonist, is used as the inhibitor of PXR. Prior to this compound’s identification as a selective and potent PXR antagonist, ketoconazole and sulforaphane were the best options. However, they have shown to be ineffective in in-vivo situations, potentially due to toxicity (Lin et al., 2017). Therefore, it is advisable to ensure the pharmacological assay be completed using varying concentrations of SPA70.
Quantifying mRNA levels, of a specific gene being regulated by a nuclear receptor, is a common technique when studying chemical activation. Historically, northern blot analysis , introduced in 1977, was the standard method for detecting a change in gene expression (Alwine, Kemp, & Stark, 1977). Utilizing electrophoresis, separated bands of mRNA are transferred from an agarose gel to a membrane. The membrane is then probed, and signal is detected. The recently preferred and precise method, RT-qPCR, is a quicker and more sensitive method that requires a significantly smaller amount of mRNA for detection (Bustin, 2000). However, there are some drawbacks to RT-PCR, including inappropriate results when the slightest contamination occurs. Therefore, it is imperative to work in as aseptic an area as possible when performing this assay.
Critical Parameters:
Basic Protocol 1 needs to be completed within a biological safety cabinet. Many specific steps in an experiment need to be optimized so that the assay will work to its optimum level. Cell type, cell number per assay well, reagents used, treatment time, plate type, and signal output reader are all pieces of information that need to be optimized for this assay. Another vital part to this protocol is the positive control plate. As all compounds are compared to the positive and negative controls, it is crucial that these compounds are at their optimal concentration and purity. It is also pivotal to keep the assay plates inside the incubator, at 37°C and 5% CO2, throughout the experiment for as long as possible so that the cells can achieve their healthiest forms.
The main goal of high-throughput screening is to acquire reliable and reproducible data in an efficient and quick manner. Therefore, the core attribute necessary for Basic Protocol 2 is to generate an assay that is easily duplicated without high levels of human error. Utilizing a robot is the simplest way to produce this type of experiment as it increases screening speed and minimizes mistakes. Since this experiment is a high-throughput version of Basic Protocol 1, many of the same critical parameters apply here as well. However, having access to a double-stable cell line is very important to this assay, as transient transfection may not guarantee assay reproducibility.
One of the most crucial aspects of Basic Protocol 3 is to select promising compounds using intuitive parameters (potency, efficacy, curve quality, and reproducibility). For example, a compound can have an efficacy of 100% of the positive control, rifampicin, due to an outlier. In this instance, the concentration curve could be flat with one data point up very high (Figure 10) generating a false positive and should not be selected for further, more in-depth, review. The pharmacological study will have many of the same parameters as Basic Protocol 1 since it is just an addendum to that experiment. However, one thing to be mindful of is selecting a known nuclear receptor inhibitor with good potency and efficacy, such as SPA70 for this specific protocol. When performing experiments requiring the use of mRNA, as when executing RT-qPCR, it is imperative to always use RNase-free water and be mindful of possible contaminants, such as oil from ungloved hands or droplets from talking/coughing near the sample. The chosen cells used for the RT-qPCR assay should already have the nuclear receptors and target genes inside the system so that chemical induction can be seen. This experiment will determine how much RNA is being generated and therefore, human primary hepatocytes or HepaRG cells are the more logical choices to be utilized. Another point of contention for the RT-qPCR assay is which type of dye, e.g., TaqMan vs SYBR Green, should be used. It will depend on the primers or probes bought and the specific machine’s capability; so, it is always necessary to make sure those aspects match up.
Figure 10.

Activity response curve of an efficacious but not selectable compound. HepG2-hPXR-CYP3A4 cells were treated with multiple concentrations of a test compound for 24 hours during the Tox21 10,000 compound high-throughput screen. The % activity was calculated by comparing each data point to the positive control, RIF (100% = RIF activity).
Troubleshooting:
Once optimized, the screening protocol should be easy to repeat quickly and efficiently. However, the optimization and follow-up steps, such as in these protocols, are nuanced and subject to many potential complications. Table 2 lists some ways in which to avoid these problems by explaining solutions in a clear and precise manner.
Table 2.
Troubleshooting Guide for Identifying PXR Activators
| Problem | Possible Cause | Solution |
|---|---|---|
| Cells won’t detach from flask | Didn’t wash with PBS free of CaCl2 and MgCl2 | Suck out trypsin, wash the flask 2x with CaCl2 and MgCl2 free PBS, add trypsin again |
| Overexposure when reading luminescence |
|
|
| Low signal when reading luminescence |
|
|
| Low RNA concentration |
|
|
| Low or no amplification during PCR |
|
|
Understanding Results:
When performing a luciferase reporter gene assay, the concentration response curve of a compound is the main result that needs to be understood; the potency and efficacy calculated using any plotting software (e.g., GraphPad) will characterize if the compound is a modulator of the nuclear receptor. Comparing a positive control compound to test compounds is an optimal way to analyze the screened data.
After using the equation from Basic Protocol 1, Step 30, any compound producing reporter gene activity above 100% is more efficacious than the positive control. However, a chemical can have an efficacy of 100% of rifampicin, but if the potency is at a concentration that is not clinically relevant, that compound will not be the best choice to select for further review when assessing the data in humans. Figure 11 displays the concentration response curves from a structural cluster of compounds identified in the PXR activator Tox21 10K compound screen, where the most potent and efficacious, Compound A, was chosen for further study (Lynch et al., 2021). Compound C could have also been selected; however, there were other compounds having similar results and we were interested in identifying as many compounds from different structural clusters as possible. Compound B also had a good curve but only had a 50% efficacy, and a lower potency, ruling it out among other more qualified compounds. When performing nuclear receptor luciferase reporter gene assays, the data shown here is the expected type of result.
Figure 11.

Activity response curves from a group of structurally similar compounds. HepG2-hPXR-CYP3A4 cells were treated with multiple concentrations of three test compounds from the same structural cluster (A, B, and C) for 24 hours during the Tox21 10,000 compound high-throughput screen. Data are expressed as the mean ± SD of triplicate assays.
The more in-depth and complicated data to decipher in this method is from Basic Protocol 3. The pharmacological assay is similar to the first two basic protocols, in that its endpoint is still concentration response curves. However, when adding an inhibitor into the treatment, a positive compound will generate a right shifted curve as compared to without inhibitor addition, as shown in Figure 7. Because the curves are shifted to the right, the EC50 will also be higher, meaning reduced potency. Compound A, the previously chosen compound, has a right-shifted curve in an inhibitor concentration-dependent manner.
The second follow-up study, RT-qPCR, normalizes treatment groups to a negative control, DMSO, to generate a xenobiotic-induced fold induction. Therefore, the DMSO group should always equal 1. After acquiring the gene fold induction for each treatment, a statistical analysis needs to be performed so that any significant change can be captured. Since there are triplicate values of a control and more than one treatment, also in triplicate, the statistical comparison tool that should be used is one-way analysis of variance (ANOVA) with post-hoc Dunnett’s analysis. The easiest way to perform this analysis is by Inputting the data into GraphPad Prism software and utilizing the correct functions. Figure 12 gives an example of what this data might look like for 6 tested compounds, including Compound A. RIF is the positive control of induction for CYP3A4 through PXR modulation, and Compounds A, 3, 4, and 5 also statistically significantly induce CYP3A4 activity. Once a compound is identified as statistically significantly different from the negative control, it is defined as an actual inducer of the nuclear receptor being tested. In this example, 4 of the 6 tested compounds appear to be PXR activators, through the induction of CYP3A4. However, other nuclear receptors also modulate CYP3A4, which suggests that more studies need to be conducted, potentially using PXR knock-out cells, to confirm their true activity.
Figure 12.

CYP3A4 mRNA expression in HepaRG cells. HepaRG cells were treated with the vehicle control (0.1 % DMSO), positive control (10 μM RIF), Compound A, or Compound 1, 2, 3, 4, or 5. Real-time PCR was used to analyze the mRNA expression of CYP3A4. Each bar represents the mean ± SD in triplicate wells. *, p < .05; **, p < .01; ***, p < .001 using ANOVA post-hoc Dunnett’s analysis.
Time Considerations:
Depending on the assay conditions in a protocol, it could take anywhere from a few weeks to a few months to optimize this assay. To bring up cells from thaw, we suggest having at least one passage before using the cells in an assay. For example, thaw cells on Monday, passage cells on Thursday, and the cells will be ready for use on the following Monday. Each time you perform the nuclear receptor luciferase reporter gene assay, it should take about the same amount of time. After plating the cells and letting them to attach on the bottom of the assay well (3-5 hours), the cells are treated for an optimal amount of time; we suggest between 15 and 24 hours depending on the type of assay. Adding detection reagents, assay plate incubation, and reading the plates generally take about 2 hours. Therefore, all together, one complete assay will take between 20 and 31 hours. Once the reagents, treatment timing, cells, and machine settings are optimized, a larger screen can take place. The timing for the screen will depend on how many compounds and plates you are screening at once, as well as the machinery available. However, if no robot is available, we suggest doing about 10-15 plates at a time due to hands-on restrictions. More than 15 plates at a time may get confusing and lead to timing issues as well as an increased chance of human error. When it comes to the pharmacological study in Basic Protocol 3, the time expectance is the same (between 20 and 31 hours) as the initial optimization assay because it is a repeat experiment and adding an inhibitor adds no extra time.
Regarding the RT-qPCR assay, there are various steps which take time depending on experience; there are also multiple places the experiment can be paused and put in the −80°C or −20°C freezer. Therefore, the assay can take 1 day from harvest to PCR analysis, or it can take however long is needed given time restraints. Depending on the cell type used, plating the cells and time before treatment varies. In this specific protocol, using HepaRG cells, the time from plating to harvesting is 4 days since there is a 24-hour treatment. Once harvested, the lysate can be kept at −80°C until ready to use. The next step is to isolate the RNA, using a kit or TRIzol™, which will take about 2-4 hours depending on the method and number of samples generated. The protocol can once again be paused, after the RNA is extracted, and samples can be kept at −80°C. Measuring the RNA concentration and performing reverse transcriptase takes about 2 hours total and once again the samples can be stored in a −20°C until the next step is ready. Setting up the qRT-PCR and performing it will take at least 2 hours depending on the number of samples and genes being measured, experience of the scientist, and type of master mix used. With an experienced scientist, one 384-well plate can be fully filled and completed in about 2.5 hours if using the regular Taqman master mix. If using the fast Taqman master mix, the PCR set-up and assay can be completed in about an hour and 45 minutes. Therefore, to complete a qRT-PCR assay once the samples are harvested, will take at least 6 hours if there are only a small number of samples and genes to measure. However, depending on whether the researcher stopped at different steps, the assay can be completed weeks or even months later.
ACKNOWLEDGEMENTS:
This work was supported in part by the Intramural Research Program of the National Center for Advancing Translational Sciences (NCATS), National Institutes of Health. The views expressed in this article are those of the authors and do not necessarily reflect the statements, opinions, views, conclusions, or policies of the NIH. Mention of trade names or commercial products does not constitute endorsement or recommendation for use.
Footnotes
CONFLICT OF INTEREST STATEMENT:
The authors report no conflict of interest. All authors have read and approved the final manuscript.
DATA AVAILABILITY STATEMENT:
The data, tools, and material (or their source) that support Basic Protocol 1 and 3 are available from the corresponding author upon reasonable request. The data that support Basic Protocol 2 are openly available in the Tox21 Gateway at https://tripod.nih.gov//tox21/pubdata/ , reference assay tox21-pxr-p1.
Literature Cited:
- Alwine JC, Kemp DJ, & Stark GR (1977). Method for detection of specific RNAs in agarose gels by transfer to diazobenzyloxymethyl-paper and hybridization with DNA probes. Proc Natl Acad Sci U S A, 74(12), 5350–5354. doi: 10.1073/pnas.74.12.5350 [DOI] [PMC free article] [PubMed] [Google Scholar]
- Attene-Ramos MS, Miller N, Huang R, Michael S, Itkin M, Kavlock RJ, … Xia M (2013). The Tox21 robotic platform for the assessment of environmental chemicals--from vision to reality. Drug Discov Today, 18(15-16), 716–723. doi: 10.1016/j.drudis.2013.05.015 [DOI] [PMC free article] [PubMed] [Google Scholar]
- Bustin SA (2000). Absolute quantification of mRNA using real-time reverse transcription polymerase chain reaction assays. J Mol Endocrinol, 25(2), 169–193. doi: 10.1677/jme.0.0250169 [DOI] [PubMed] [Google Scholar]
- Drug Discovery and Evaluation: Pharmacological Assays. (2016). (Hock FJ Ed. 4 ed.). Switzerland: Springer Cham. [Google Scholar]
- Huang R (2016). A Quantitative High-Throughput Screening Data Analysis Pipeline for Activity Profiling. Methods Mol Biol, 1473, 111–122. doi: 10.1007/978-1-4939-6346-1_12 [DOI] [PubMed] [Google Scholar]
- Hsu C-W, Huang R, Attene Ramos M, Austin C, Simeonov A, & Xia M (2016). Advances in high-throughput screening technology for toxicology. International Journal of Risk Assessment and Management, X, No. Y, 0–0. doi: 10.1504/IJRAM.2017.082562 [DOI] [Google Scholar]
- Kliewer SA, Moore JT, Wade L, Staudinger JL, Watson MA, Jones SA, … Lehmann JM (1998). An orphan nuclear receptor activated by pregnanes defines a novel steroid signaling pathway. Cell, 92(1), 73–82. doi: 10.1016/s0092-8674(00)80900-9 [DOI] [PubMed] [Google Scholar]
- Kumar GN, & Surapaneni S (2001). Role of drug metabolism in drug discovery and development. Med Res Rev, 21(5), 397–411. doi: 10.1002/med.1016 [DOI] [PubMed] [Google Scholar]
- Lin W, Wang YM, Chai SC, Lv L, Zheng J, Wu J, … Chen T (2017). SPA70 is a potent antagonist of human pregnane X receptor. Nat Commun, 8(1), 741. doi: 10.1038/s41467-017-00780-5 [DOI] [PMC free article] [PubMed] [Google Scholar]
- Lin W, Wu J, Dong H, Bouck D, Zeng FY, & Chen T (2008). Cyclin-dependent kinase 2 negatively regulates human pregnane X receptor-mediated CYP3A4 gene expression in HepG2 liver carcinoma cells. J Biol Chem, 283(45), 30650–30657. doi: 10.1074/jbc.M806132200 [DOI] [PMC free article] [PubMed] [Google Scholar]
- Livak KJ, & Schmittgen TD (2001). Analysis of relative gene expression data using real-time quantitative PCR and the 2(-Delta Delta C(T)) Method. Methods, 25(4), 402–408. doi: 10.1006/meth.2001.1262 [DOI] [PubMed] [Google Scholar]
- Lynch C, Mackowiak B, Huang R, Li L, Heyward S, Sakamuru S, … Xia M (2019). Identification of Modulators That Activate the Constitutive Androstane Receptor From the Tox21 10K Compound Library. Toxicol Sci, 167(1), 282–292. doi: 10.1093/toxsci/kfy242 [DOI] [PMC free article] [PubMed] [Google Scholar]
- Lynch C, Sakamuru S, Huang R, Niebler J, Ferguson SS, & Xia M (2021). Characterization of human pregnane X receptor activators identified from a screening of the Tox21 compound library. Biochem Pharmacol, 184, 114368. doi: 10.1016/j.bcp.2020.114368 [DOI] [PMC free article] [PubMed] [Google Scholar]
- Lynch C, Sakamuru S, Huang R, Stavreva DA, Varticovski L, Hager GL, … Xia M (2017). Identifying environmental chemicals as agonists of the androgen receptor by using a quantitative high-throughput screening platform. Toxicology, 385, 48–58. doi: 10.1016/j.tox.2017.05.001 [DOI] [PMC free article] [PubMed] [Google Scholar]
- Lynch C, Zhao J, Sakamuru S, Zhang L, Huang R, Witt KL, … Xia M (2019). Identification of Compounds That Inhibit Estrogen-Related Receptor Alpha Signaling Using High-Throughput Screening Assays. Molecules, 24(5). doi: 10.3390/molecules24050841 [DOI] [PMC free article] [PubMed] [Google Scholar]
- Schulman IG (2010). Nuclear receptors as drug targets for metabolic disease. Adv Drug Deliv Rev, 62(13), 1307–1315. doi: 10.1016/j.addr.2010.07.002 [DOI] [PMC free article] [PubMed] [Google Scholar]
- Sueyoshi T, & Negishi M (2001). Phenobarbital response elements of cytochrome P450 genes and nuclear receptors. Annu Rev Pharmacol Toxicol, 41, 123–143. doi: 10.1146/annurev.pharmtox.41.1.123 [DOI] [PubMed] [Google Scholar]
Associated Data
This section collects any data citations, data availability statements, or supplementary materials included in this article.
Data Availability Statement
The data, tools, and material (or their source) that support Basic Protocol 1 and 3 are available from the corresponding author upon reasonable request. The data that support Basic Protocol 2 are openly available in the Tox21 Gateway at https://tripod.nih.gov//tox21/pubdata/ , reference assay tox21-pxr-p1.