

Abstract
Purpose:
To investigate longitudinal changes in rates of optic nerve head circumpapillary retinal nerve fiber layer (cpRNFL) thinning and vessel density loss in primary open angle glaucoma (POAG) with or without history of disc hemorrhage (DH).
Design:
Observational cohort
Methods:
In this longitudinal study, 34 eyes with DH and 134 eyes without DH that had at least 1.5 years of follow-up and three OCT and OCTA follow-up scans were enrolled. A linear mixed-effect model was used to compare the rates of cpRNFL thinning and vessel density loss between DH and non-DH eyes.
Results:
Rates of whole image capillary density (wiCD) loss were faster in the DH group compared to non-DH group (mean difference (95% CI): −0.32 (−0.59,−0.04) %/year, P=0.027). Faster mean rates of vessel density loss were found in the inferotemporal, inferonasal, and nasal sectors in eyes with DH than without DH (P<0.05). There was no statistically significant difference in the global rate of cpRNFL thinning between the two groups (P=0.679). The mean rate of cpRNFL thinning was faster in the DH group compared to the non-DH group only in the inferotemporal sector (mean difference (95% CI): −1.01 (−1.62,−0.40) μm/year; P=0.001).
Conclusions:
Mean rates of vessel density loss between DH and non-DH eyes were different not only in the affected area but also in the other regions. In contrast, a significant difference in cpRNFL thinning between the two groups was detected only in the inferotemporal sector. Disc hemorrhage is an independent predictor of faster vessel density loss in glaucoma suspects and POAG patients.
Keywords: optic disc hemorrhage, retinal nerve fiber layer, vessel density, glaucoma, progression
Introduction
Glaucoma is a progressive optic neuropathy characterized by loss of retinal ganglion cells and their axons, leading to distinctive patterns of visual field (VF) defects.1, 2 Disc hemorrhage (DH) is reported to be associated with the development3–5 and rapid progression of glaucoma in many previous studies.6–11 Several hypotheses have been proposed to explain the pathophysiology of glaucomatous DHs, including vascular and mechanical theories.12, 13
Optical coherence tomography angiography (OCTA) is a non-invasive technique of imaging optic nerve head (ONH) and retinal microvasculature that provides assessment of retinal microvascular changes in ocular diseases. Compared to retinal nerve fiber layer (RNFL) thickness, OCTA-derived ONH vessel density has been found to provide similar diagnostic accuracy for differentiating glaucomatous and healthy eyes.14 In addition, decreased circumpapillary (cp) vessel density has been found to be strongly associated with increasing severity of VF defects in the disease.15, 16
Glaucomatous damage to the optic disc often may manifest earlier than a detectable VF defect.1 Thus, monitoring structural changes such as vessel density loss may be a more sensitive method to detect early progression in glaucoma. This study evaluated longitudinal changes in rates of ONH RNFL thinning and vessel density loss in primary open angle glaucoma (POAG) patients with or without history of DH.
Methods
In this observational cohort study, subjects were enrolled from the Diagnostic Innovations Glaucoma Study (DIGS), a prospective longitudinal study designed to evaluate structural and functional changes in glaucoma. Participants were assessed longitudinally according to a pre-established protocol consisting of regular follow-up visits with clinical examination, imaging, and functional tests. All participants from the DIGS study who met the inclusion criteria described below were included in the present study. Informed consent was obtained from all study participants. The University of California, San Diego Human Subject Committee approved all protocols, and the methods described adhered to tenets of the Declaration of Helsinki.
Participants
All subjects underwent annual comprehensive ophthalmologic evaluation, including best-corrected visual acuity, slit-lamp biomicroscopy, Goldmann applanation tonometry, gonioscopy, dilated fundus examination, stereoscopic optic disc photography, ultrasound pachymetry, and standard automated perimetry (SAP) in both eyes. Semi-annual evaluations included intraocular pressure (IOP) measurement, OCTA imaging, and SAP testing.
This study included eyes diagnosed as glaucoma or glaucoma suspect with or without history of DH with a minimum follow-up time of 1.5 years and a minimum of three follow-up OCTA scans. Glaucoma suspects included eyes with elevated IOP (≥22mmHg) or glaucomatous-appearing optic discs without the presence of repeatable glaucomatous VF damage. Eyes were classified as glaucomatous if they had repeatable (at least 2 consecutive) abnormal VF test results with evidence of glaucomatous optic neuropathy – defined as excavation, the presence of focal thinning, notching of neuroretinal rim, or localized or diffuse atrophy of the RNFL on the basis of masked grading of optic disc photographs by 2 graders or clinical examination by a glaucoma specialist. An abnormal VF test was defined as a pattern standard deviation outside of the 95% normal confidence limits or a Glaucoma Hemifield Test result outside normal limits. Glaucoma disease severity was classified as early (24–2 VF MD>−6 dB), moderate (−6 dB ≤ 24–2 VF MD>−12 dB), and advanced (24–2 VF MD ≤ −12 dB).
Inclusion criteria included (1) older than 18 years of age, (2) open angles on gonioscopy, (3) best-corrected visual acuity of 20/40 or better, and (4) at least 1.5 years of follow-up with a minimum of three follow-up OCT and OCTA scanning sessions.
Exclusion criteria included (1) history of trauma or intraocular surgery (except for uncomplicated cataract surgery or glaucoma surgery), (2) coexisting retinal disease, (3) uveitis, or (4) non-glaucomatous optic neuropathy. Participants with the diagnosis of systemic diseases such as Parkinson’s disease, Alzheimer’s disease, dementia, or a history of stroke were also excluded. Those with unreliable VFs or poor-quality OCTA and spectral domain optical coherence tomography (SDOCT) scans were also excluded from this report. Eyes with an axial length of 27 mm or more were also excluded from this study.
Stereophotography
All color stereophotographs were taken using a Nidek Stereo Camera Model 3-DX (Nidek Inc, Palo Alto, CA) after maximal pupil dilation. Evaluations of all photographs were performed using a simultaneous stereoscopic viewer (Asahi Pentax Stereo Viewer II; Pentax, Tokyo, Japan) with a standard fluorescent light bulb. Each grader (T.N. and R.D.) was masked to the subject’s identity and other test results. Included photographs were judged to be of adequate quality or better. Discrepancies between the two graders were resolved by consensus or adjudication by a third experienced grader (S.M.). DHs were required to be located within one-half disc diameter from the optic disc border and not associated with optic disc edema, papillitis, diabetic retinopathy, central or branch retinal vein occlusion, or any other retinal disease.17 The location of DHs was categorized as hemispheric (superior, inferior, or both) and sectoral (nasal, temporal, inferior nasal, inferior temporal, superior nasal and superior temporal) corresponding to those on OCTA and OCT sectoral parameters.
OCT Angiography
Optic nerve head microvasculature was evaluated using the AngioVue OCT system (software version 5.6.3.0). This system has been described previously.18 Vessel density was automatically calculated as the proportion of measured area occupied by flowing blood defined as pixels having decorrelation values acquired by the split-spectrum amplitude-decorrelation angiography algorithm above the threshold level. Vessel density in the cpRNFL was assessed within a 4.5 × 4.5-mm field centered on the ONH. Vessel density within the cpRNFL was measured from the internal limiting membrane (ILM) to the cpRNFL posterior boundary using standard AngioVue software. Image quality review was done on all scans according to the University of California, San Diego, Imaging Data Evaluation and Analysis (IDEA) Reading Center standard protocol. Trained graders reviewed scans and excluded poor-quality images, defined as images with (1) a signal strength index (SSI) of less than 48, (2) poor clarity, (3) residual motion artifacts visible as irregular vessel pattern or disc boundary on the en face angiogram, (4) local weak signal, or (5) segmentation errors. The location of the disc margin in the ONH scans was reviewed for accuracy and was adjusted manually if required. ONH whole en face image capillary density (wiCD) and circumpapillary capillary density (cpCD) were obtained over the entire 4.5 × 4.5 mm scan. Regional measurements were also analyzed as described by Garway-Heath et al.19
OCT Measurements
The Spectralis SDOCT (Spectralis HRA+OCT, software version 5.4.7.0; Heidelberg Engineering, Inc.) was used for cpRNFL thickness measurements. Details of its operation have been discussed previously.20 Spectralis uses a dual-beam SDOCT, a confocal laser-scanning ophthalmoscope with a wavelength of 870 nm, and an infrared reference image to obtain images of ocular microstructures. Spectralis incorporates a real-time eye-tracking system that couples a confocal laser-scanning ophthalmoscope and SDOCT scanners to adjust for eye movements and to ensure that the same location of the retina is scanned over time. The cpRNFL thickness was measured using a high-resolution RNFL circle scan, which consists of 1536 A-scan points from a 3.45mm circle centered on the optic disc. All images were processed and reviewed by the IDEA Reading Center. Images with non-centered scans, inaccurate segmentation of the RNFL, or quality scores of 15 dB or less were excluded from the analysis. The cpRNFL measurements evaluated in this study included the mean global index, temporal quadrant (316 – 45 degrees), superotemporal sector (46 – 90 degrees), superonasal sector (91 – 135 degrees), nasal quadrant (136 – 225 degrees), inferonasal sector (226 – 270 degrees) and inferotemporal sector (271 – 315 degrees).
Statistical analysis
All statistical analyses were performed with commercially available software (Stata version 15; StataCorp, College Station, Texas, USA). Statistical significance for tests was set at P≤0.05. Descriptive statistics were calculated as the mean and 95% confidence interval (CI). Categorical variables were compared using the chi-square test. Mixed-effects modeling was used to compare ocular parameters among groups. Models were fitted with ocular measurements as response variable and classification groups (DH history) as fixed effects. Measurements of bilateral eyes were nested within subjects to account for the fact that eyes from the same individual were more likely to have similar measurements.
Evaluation of the effect of DH on mean rates of change in cpRNFL and vessel density was performed using a linear mixed model with random intercepts and random slopes.21–23 In this model, the average values of the outcome variables (vessel density and cpRNFL measurements) were explored using a linear function of time, and random intercepts and random slopes were introduced with patient- and eye-specific deviations from this average value. This model can account for the fact that different eyes may have different rates of vessel density loss and cpRNFL thinning over time, while allowing for correlation between two eyes of the same individual and between visits over time.21, 22 As structural decline may depend on disease severity, an unstructured covariance between random effects was assumed, allowing for correlation between intercepts and slopes of change.24 Multivariable models were constructed including the following potential confounding factors: age, gender, mean IOP during follow-up, and baseline 24–2 mean deviation (MD). Factors contributing to the rate of vessel density loss were also explored using a linear mixed model. The effect of potential predictors – age, mean IOP during follow-up, and baseline 24–2 mean deviation (MD) or baseline global cpRNFL thickness as factors affecting glaucoma severity, and any other variable in which the P value was <0.1 in univariable analysis – on the rates of vessel density loss was examined.
Results
In this study, 34 eyes with DH and 134 eyes without DH that had at least 1.5 years of follow-up and three OCTA follow-up scans were enrolled. Initial DH occurrence was recorded with an average of 3.9 years prior to OCTA evaluation, and the most recent DH occurrence was an average of 1.9 years before the OCTA evaluation. Eyes with recent DH occurrence earlier than average (1.9 years) had mean (95% CI) wiCD loss of −0.77 (−1.14, −0.39) %/year, while those later than average had −1.14 (−1.47, −0.80) %/year, with mean difference of −0.37 (−0.85, 0.10) %/year, P=0.119). Eyes with recent DH occurrence earlier than the average had cpRNFL thinning of −0.52 (−0.86, −0.19) μm/year, and those later than average had −0.57 (−1.03, −0.11) μm/year, with mean difference of −0.04 (−0.59, 0.50) μm/year (P=0.868). Demographics and baseline clinical characteristics between the DH and non-DH groups are presented in Table 1. Statistically significant differences were seen between two groups with respect to gender (P=0.028) and mean IOP during follow-up (P=0.040). There were no significant differences in age, race, hypertension, diabetes mellitus, mean ocular perfusion pressure (MOPP), axial length, central corneal thickness (CCT), baseline IOP, distribution of disease severity based on baseline 24–2 VF MD, number of follow-up years, and number of OCTA follow-up scans (P>0.05). Difference in diagnosis of glaucoma and glaucoma suspects (P=0.304), baseline 24–2 VF MD (P=0.519), baseline cpRNFL thickness (P=0.874), baseline wiCD (P=0.657), and baseline cpCD (P=0.925) also did not reach statistical difference between groups at baseline. Multiple DHs were seen in 41.2 % of DH patients. DHs were more common in the inferior hemiretina (73.5 %). The number of glaucoma medications before and after DH was also examined. Glaucoma medications (mean (95% CI)) remained unchanged in 23 eyes (2.0 (1.6, 2.4) to 1.8 (1.4, 2.2), P=0.534), and medications were escalated in 11 eyes after DH (1.6 (1.3, 2.0) to 3.0 (2.6, 3.4), P<0.001).
Table 1.
Demographics and Baseline Clinical Characteristics of DH and Non-DH Eyes
| DH group (32 subjects, 34 eyes) | Non-DH group (97 subjects, 134 eyes) | P value | |
|---|---|---|---|
|
| |||
| Age (years) | 71.0 (67.1, 75.0) | 69.1 (67.0, 71.2) | 0.383 |
| Gender (Female/Male) | 22/10 | 45/52 | 0.028 |
| Race (African American/Non-African American) | 5/27 | 25/72 | 0.239 |
| Self-reported HTN, n (%) | 20 (62.5%) | 61 (62.9%) | 0.969 |
| Self-reported DM, n (%) | 3 (9.4%) | 15 (15.5%) | 0.389 |
| MOPP (mmHg) | 50.5 (47.3, 53.6) | 52.3 (50.9, 53.7) | 0.280 |
| Axial length (mm) | 24.3 (23.9, 24.7) | 24.4 (24.2, 24.6) | 0.593 |
| CCT (μm) | 537.6 (520.0, 555.3) | 536.5 (526.8, 546.2) | 0.891 |
| Baseline IOP (mmHg) | 14.8 (13.3, 16.2) | 15.3 (14.5, 16.2) | 0.450 |
| Mean IOP during follow-up (mmHg) | 14.5 (13.5, 15.6) | 15.7 (15.1, 16.3) | 0.040 |
| Diagnosis | |||
| Glaucoma/Glaucoma suspect, Eye No. | 25/9 | 86/48 | 0.304 |
| Disease Severity by baseline 24–2 VF MD | 0.892 | ||
| Early glaucoma, Eye No. (%) | 28 (82.4%) | 109 (81.3%) | |
| Moderate and advanced glaucoma, Eye No. (%) | 6 (17.6%) | 25 (18.7%) | |
| Multiple DH, Eye No. (%) | 14 (41.2%) | ||
| DH Location, Eye No. (%) | |||
| Inferior | 20 (58.8%) | ||
| Superior | 9 (26.5%) | ||
| Both hemispheres | 5 (14.7%) | ||
| DH Sectoral Location, Eye No. (%) | |||
| Nasal | 1 (2.9%) | ||
| Temporal | 0 (0.0%) | ||
| Inferonasal | 5 (14.7%) | ||
| Inferotemporal | 23 (67.7%) | ||
| Superonasal | 5 (14.7%) | ||
| Superotemporal | 8 (23.5%) | ||
| Baseline 24–2 VF MD (dB) | −3.4 (−5.1, −1.8) | −2.9 (−3.5, −2.2) | 0.519 |
| Baseline 24–2 VF PSD (dB) | 4.1 (2.8, 5.4) | 4.3 (3.7, 4.9) | 0.767 |
| Baseline cpRNFL (μm) | 76.3 (71.3, 81.2) | 75.8 (73.0, 78.6) | 0.874 |
| Baseline wiCD (%) | 43.1 (41.4, 44.8) | 42.7 (41.9, 43.5) | 0.657 |
| Baseline cpCD (%) | 44.2 (42.2, 46.3) | 44.1 (43.2, 45.1) | 0.925 |
| Average SSI for OCTA | 61.6 (60.3, 63.0) | 62.6 (62, 63.2) | 0.877 |
| OCTA number of scans | 4.9 (4.3, 5.4) | 4.8 (4.6, 5.1) | 0.898 |
| Follow-up (years) | 3.3 (3.1, 3.6) | 3.4 (3.2, 3.5) | 0.829 |
| SDOCT number of scans | 6.1 (5.9, 6.2) | 6.3 (6.0, 6.5) | 0.619 |
| Average SQ for SDOCT | 29.9 (29.4, 30.5) | 29.3 (29.1, 29.6) | 0.467 |
CCT = central corneal thickness; CD = capillary density; cp = circumpapillary; DH = disc hemorrhage; DM = diabetes mellitus; HTN = hypertension; IOP = intraocular pressure; MD = mean deviation; MOPP = mean ocular perfusion pressure; OCTA = optical coherence tomography angiography; PSD = pattern standard deviation; RNFL = retinal nerve fiber layer; SDOCT = spectral domain optical coherence tomography; SQ = scan quality; SSI = signal strength index; VF = visual field; wi = whole image. Values are shown in mean (95% confidence interval), unless otherwise indicated. Statistically significant P values are shown in bold.
Table 2 summarizes the mean rates of CD loss in the DH and non-DH groups. Rates of wiCD were faster in the DH group compared to the non-DH group (mean difference (95% CI): −0.32 (−0.59, −0.04) %/year, P=0.027). Statistically significantly higher mean rates of vessel density loss were found in the inferotemporal, (mean difference (95% CI): −0.86 (−1.39, −0.33) %/year, P=0.002), inferonasal (mean difference (95% CI): −0.70 (−1.24, −0.15) %/year, P=0.012), and nasal sectors (mean difference (95% CI): −0.46 (−0.85, −0.06) %/year, P=0.023). Similar results were found after adjusting for confounding factors. Differences in the rates of cpRNFL thickness change and CD change are represented in Figure 1.
Table 2.
Comparison of Rates of CD Loss between DH and Non-DH Eyes
| DH Group Mean (95% CI) |
Non-DH Group Mean (95% CI) |
Difference Mean (95% CI) |
P value (adjusted) |
|
|---|---|---|---|---|
|
| ||||
| CD Change Rate (%/year) | ||||
| wiCD | −0.92 (−1.17, −0.67) | −0.60 (−0.73, −0.48) | −0.32 (−0.59, −0.04) | 0.027 (0.050) |
| cpCD | −0.84 (−1.13, −0.56) | −0.53 (−0.67, −0.38) | −0.31 (−0.63, 0.00) | 0.053 (0.104) |
| Nasal | −1.03 (−1.38, −0.68) | −0.58 (−0.75, −0.40) | −0.46 (−0.85, −0.06) | 0.023 (0.013) |
| Temporal | −0.60 (−0.96, −0.24) | −0.63 (−0.82, −0.45) | 0.04 (−0.37, 0.44) | 0.862 (0.600) |
| Inferonasal | −1.02 (−1.51, −0.54) | −0.32 (−0.57, −0.08) | −0.70 (−1.24, −0.15) | 0.012 (0.029) |
| Inferotemporal | −1.28 (−1.76, −0.81) | −0.43 (−0.67, −0.19) | −0.86 (−1.39, −0.33) | 0.002 (0.007) |
| Superonasal | −0.42 (−0.85, 0.02) | −0.35 (−0.57, −0.12) | −0.07 (−0.56, 0.42) | 0.781 (0.805) |
| Superotemporal | −0.82 (−1.35, −0.29) | −0.68 (−0.94, −0.41) | −0.14 (−0.74, 0.45) | 0.639 (0.744) |
CD = capillary density; cp = circumpapillary; DH = disc hemorrhage; IOP = intraocular pressure; M = male; wi = whole image. Values are shown in mean (95% confidence interval), unless otherwise indicated. Statistically significant P values are shown in bold.
Adjusted to age, gender, baseline 24–2 visual field mean deviation, and mean IOP.
Figure 1.
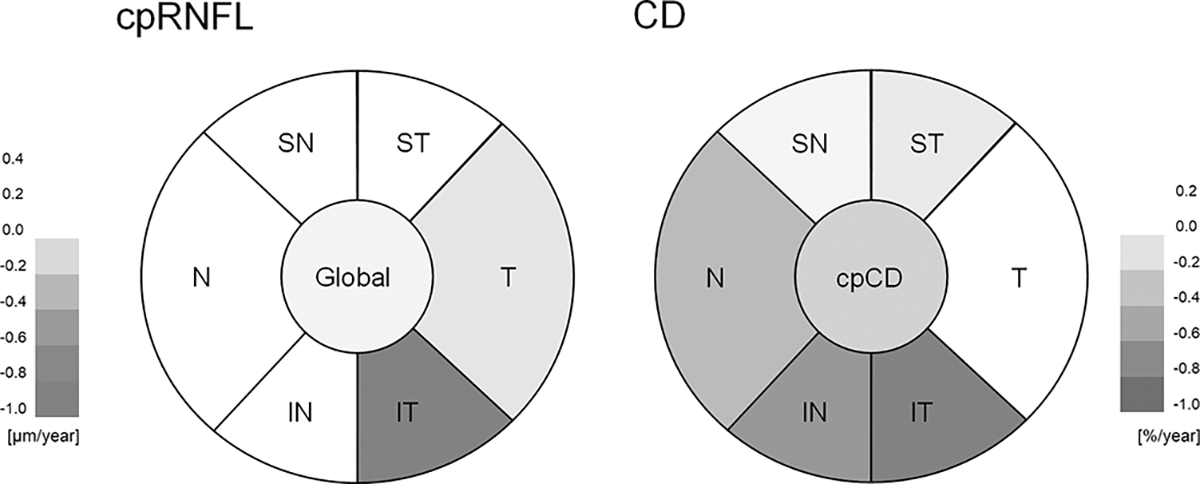
Diagrams showing mean differences of cpRNFL thickness change rate (Left; μm/year) and CD change rate (Right; %/year) between DH and Non-DH Eyes. cp = circumpapillary; CD = capillary density; IN = inferonasal; IT = inferotemporal; N = nasal; RNFL = retinal nerve fiber layer; SN = superonasal; ST = superotemporal; T = temporal; wi = whole image.
Table 3 summarizes the mean rates of cpRNFL thinning in DH and non-DH group. No difference in the global rate of cpRNFL thinning between the DH and non-DH groups was found(P=0.679). A significantly higher mean rate of cpRNFL thinning in DH eyes compared to non-DH eyes was found only in inferotemporal sector (mean difference (95% CI): −1.01 (−1.62, −0.40) μm/year; P=0.001). Similar results were found after adjusting for confounding factors. In eyes with DH in inferior hemisphere (n=20), a faster capillary density loss was found in the superior hemisphere than in the inferior hemisphere (−1.08 (−1.48, −0.67) vs −0.54 (−0.97, −0.12) %/year, respectively, P=0.077). More prominent differences were found with cpRNFL between the inferior and superior hemispheres (−0.90 (−1.29, −0.52) μm/year vs −0.29 (−0.54, −0.42) μm/year, respectively, P=0.014) in eyes with DH in the inferior hemisphere.
Table 3.
Comparison of Rates of cpRNFL Thinning between DH and Non-DH Eyes
| DH Group Mean (95% CI) |
Non-DH Group Mean (95% CI) |
Difference Mean (95% CI) |
P value (adjusted) |
|
|---|---|---|---|---|
|
| ||||
| cpRNFL Change Rate (μm/year) | ||||
| Mean Global | −0.53 (−0.79, −0.27) | −0.47 (−0.60, −0.34) | −0.06 (−0.36, 0.23) | 0.679 (0.459) |
| Nasal | −0.13 (−0.52, 0.27) | −0.34 (−0.54, −0.14) | 0.21 (−0.23, 0.65) | 0.352 (0.748) |
| Temporal | −0.36 (−0.83, 0.12) | −0.22 (−0.46, 0.02) | −0.13 (−0.67, 0.40) | 0.622 (0.511) |
| Inferonasal | −0.79 (−1.32, −0.26) | −0.82 (−1.09, −0.56) | 0.04 (−0.56, 0.63) | 0.907 (0.945) |
| Inferotemporal | −1.72 (−2.26, −1.17) | −0.71 (−0.98, −0.43) | −1.01 (−1.62, −0.40) | 0.001 (0.002) |
| Superonasal | −0.26 (−0.77, 0.25) | −0.45 (−0.70, −0.19) | 0.19 (−0.38, 0.76) | 0.521 (0.879) |
| Superotemporal | −0.28 (−0.79, 0.24) | −0.65 (−0.91, −0.39) | 0.37 (−0.21, 0.95) | 0.209 (0.229) |
cp = circumpapillary; DH = disc hemorrhage; RNFL = retinal nerve fiber layer. Values are shown in mean (95% confidence interval), unless otherwise indicated. Statistically significant P values are shown in bold.
Adjusted to age, gender, baseline 24–2 visual field mean deviation, and mean IOP.
Table 4 summarizes the possible predictors of vessel density loss in follow-up evaluations. In model 1, baseline 24–2 VF MD was selected in addition to age, mean IOP, and history of DH, while baseline cpRNFL was replaced by 24–2 VF MD in model 2. In both multivariable models, factors including age and history of DH were found to be significantly associated with wiCD loss over time (P<0.05 for all).
Table 4.
Factors Contributing to the Rate of wiCD Loss Over Time in Study Participants by Univariable and Multivariable Mixed Model Analysis
| Variables | Univariable Model | Multivariable Model 1 | Multivariable Model 2 | |||
|---|---|---|---|---|---|---|
|
| ||||||
| β, 95 % CI | P value | β, 95 % CI | P value | |||
|
| ||||||
| Age, per 10 years older | −0.12 (−0.22, −0.02) | 0.020 | −0.12 (−0.22, −0.02) | 0.017 | −0.14 (−0.23, −0.04) | 0.004 |
| Gender: Female | −0.03 (−0.26, 0.20) | 0.802 | ||||
| Race: African American |
0.08 (−0.18, 0.34) | 0.554 | ||||
| Self-reported diabetes | 0.07 (−0.27, 0.40) | 0.693 | ||||
| Self-reported hypertension | −0.02 (−0.25, 0.21) | 0.852 | ||||
| MOPP, per 1 mmHg lower | 0.00 (−0.02, 0.01) | 0.964 | ||||
| Axial length, per 1mm longer | −0.06 (−0.17, 0.05) | 0.283 | ||||
| CCT, per 100 μm thinner | 0.04 (−0.27, 0.35) | 0.808 | ||||
| Baseline IOP, per 1 mmHg higher | 0.01 (−0.02, 0.04) | 0.427 | ||||
| Mean IOP, per 1 mmHg higher | 0.00 (−0.04, 0.03) | 0.864 | −0.02 (−0.05, 0.02) | 0.290 | −0.02 (−0.05, 0.01) | 0.182 |
| History of disc hemorrhage | −0.32 (−0.59, −0.04) | 0.027 | −0.28 (−0.55, 0.00) | 0.049 | −0.27 (−0.51, −0.02) | 0.036 |
| History of inferior disc hemorrhage | −0.24 (−0.56, 0.07) | 0.134 | ||||
| Baseline 24–2 VF MD, per 1 dB worse | −0.02 (−0.05, 0.01) | 0.114 | −0.02 (−0.05, 0.00) | 0.087 | ||
| Baseline cpRNFL, per 10 μm thinner | −0.14 (−0.20, −0.07) | <0.001 | −0.14 (−0.21, −0.08) | <0.001 | ||
| Follow-up period, per 1 year longer | 0.00 (−0.19, 0.19) | 0.973 | ||||
| OCTA number of scans | 0.00 (−0.08, 0.07) | 0.928 | ||||
| Average SSI, per 1 higher | 0.02 (−0.06, 0.10) | 0.640 | ||||
CCT = central corneal thickness; CD = capillary density; cp = circumpapillary; IOP = intraocular pressure; MD = mean deviation; MOPP = mean ocular perfusion pressure; OCTA = optical coherence tomography angiography; RNFL = retinal nerve fiber layer; SQ = scan quality; SSI = signal strength index; VF = visual field; wi = whole image. Values are shown in β coefficient (95% confidence interval). Statistically significant P values are shown in bold.
Possible predictors of cpRNFL thinning in follow-up evaluations are summarized in Supplemental Table 3. Since no significant differences were seen in mean global cpRNFL change between DH eyes and non-DH eyes (Table 3), the factors contributing to inferotemporal cpRNFL thinning over time were examined. In model 1, baseline 24–2 VF MD was selected in addition to age, gender, axial length, mean IOP, and history of DH. In model 2, baseline wiCD was replaced by 24–2 VF MD. In both multivariable models, history of DH was found to be significantly associated with inferotemporal cpRNFL thinning over time (P<0.05 for both).
Discussion
DHs have been identified as a risk factor for the development and progression of glaucoma in prior studies.3–11 In this study, OCTA-derived measures of the rates of vessel density loss are significantly faster in DH eyes compared to non-DH eyes. Differences between the DH and non-DH groups were detected in the global rates of vessel density loss as well as in several sectoral rates of vessel density loss. While these findings support changes in optic disc microvasculature as being especially important in DH eyes, they also suggest that clinicians consider OCTA in addition to OCT imaging for monitoring glaucoma progression in patients with DH.
Several studies have explored the application of OCTA in DH eyes. Nitta et al. found a significant association between cpCD loss and DH occurrence in glaucoma patients.25 Okamoto et al. reported a significant correlation between widening of the retinal nerve fiber layer defect and widening of the decreased superficial retinal microvasculature angle, as well as an association between DH and a subsequent decrease in the superficial retinal microvasculature in retinal nerve fiber layer defects.26 In this study, we find DH to be an independent predictor of faster vessel density loss in glaucoma suspects and POAG patients. Our findings may help clinicians to better understand the role of OCTA in DH eyes as a tool in monitoring glaucoma progression in these high-risk patients.
While wiCD change rates are found in this study to be significantly different between DH and non-DH eyes, cpCD change rates are not. A possible explanation for these results is that wiCD evaluates a larger area, which may be advantageous in detecting vessel density change. The limited measurement area of cpCD may exclude areas of sparse vasculature that hold diagnostic value, as vascular dropout may also be seen in the areas beyond the limits of cpCD.27 Another possible explanation for our finding is that in DH eyes the vessel density change happens diffusely which make these eyes susceptible to DH and subsequent localized cpRNFL loss. Prior studies also have shown that a history of migraine, low or high systolic blood pressure, and use of systemic β-blockers are IOP-independent parameters associated with DH.28 The contribution of vascular mechanisms other than or in addition to IOP in the pathogenesis of DH may lead to failure of autoregulation and varying degrees of optic nerve ischemia, resulting in microinfarction of the optic nerve head and the occurrence of DH in glaucoma patients.29
Liu et al. reported that when comparing DH and non-DH eyes, the rate of cpRNFL thinning was significantly higher in the quadrant of the DH, while the rate of global cpRNFL thinning was not statistically significant between the two groups.30 This is consistent with our results, in which the inferotemporal sector of the cpRNFL shows a significantly faster rate of thinning in DH eyes compared to non-DH eyes, while the mean global cpRNFL thinning rate is not significantly different. One possible explanation for these findings is that cpRNFL thinning is topographically related to the DH location.31 in contrast, our analysis of OCTA measures suggests that vessel density may decrease not only in the affected sector but also in the other regions of the optic disc in DH eyes.
Akagi et al. explored how RNFL thinning rates changed after DH, and they found that RNFL thinning rates were significantly higher in quadrants with DH compared to quadrants without DH. Intensifying glaucoma treatment was found to slow progression of RNFL thinning globally as well as in both the DH and non-DH quadrants.32 We find significant cpCD loss in DH eyes. Therefore, it may be useful for clinicians to monitor for diffuse microvascular loss and sectoral RNFL thinning over time in these eyes, and to intensify treatment to prevent progression if detected.
This study has several limitations. First, the study duration is relatively short. Longer studies are need to validate these results across the glaucoma continuum. Second, the frequency of optic disc photos may have been inadequate as they were obtained annually, while most DHs typically resolve within 6 months.33 As such, it is possible that some DHs may have been missed. Third, this is not a prospective observational study, and we did not collect data on baseline glaucoma treatment and changes in glaucoma treatment. Most of the patients were on glaucoma medication therapy and thus we could not evaluate the effect of the IOP intensive therapy on rate of CD change in DH eyes. Last, there is some evidence that topical glaucoma medications may affect ocular blood flow.34, 35 Therefore, we cannot exclude the possibility that the use of topical eye drops may have contributed to the observed vascular differences between the study groups.34
In conclusion, this study demonstrates that differences in cpRNFL thinning rates between DH and non-DH eyes are detectable only in the inferotemporal sector (corresponding to the DH location), while differences in vessel density loss rates between DH and non-DH eyes are detected both globally and in several sectors. This study also finds DHs to be an independent predictor of faster vessel density loss in glaucoma suspects and POAG patients, supporting the use of OCTA in patients with a history of DH in order to better detect glaucomatous progression in this high-risk group.
Supplementary Material
Synopsis:
In this prospective cohort study, glaucomatous eyes with disc hemorrhages (DH) exhibited faster vessel density loss than those without DH.
Acknowledgements
Financial Support:
National Institutes of Health/National Eye Institute Grants R01EY029058, R01EY011008, U10EY14267, R01EY026574, R01EY019869 and R01EY027510; Core Grant P30EY022589; an unrestricted grant from Research to Prevent Blindness (New York, NY); UC Tobacco Related Disease Research Program (T31IP1511); and grants for participants’ glaucoma medications from Alcon, Allergan, Pfizer, Merck, and Santen. The sponsor or funding organizations had no role in the design or conduct of this research.
Footnotes
Financial Disclosures:
Takashi Nishida: none; Sasan Moghimi: none; Ryan Caezar C. David: none; Aimee C. Chang: none; Wu Jo-Hsuan: none; Nevin El-Nimri: none; James A. Proudfoot: none; Alireza Kamalipour: none; Linda M. Zangwill: Financial support (research instruments) - Heidelberg Engineering, Carl Zeiss Meditec, Optovue, Topcon; Robert N. Weinreb: Financial support (research instruments) - Heidelberg Engineering, Carl Zeiss Meditec, Konan Medical, Optovue, Centervue, Bausch & Lomb; Consultant – Aerie Pharmaceuticals, Allergan, Equinox, Eyenovia; Patent – Toromedes, Carl Zeiss Meditec.
References
- 1.Weinreb RN, Leung CK, Crowston JG, et al. Primary open-angle glaucoma. Nat Rev Dis Primers 2016;2:16067. [DOI] [PubMed] [Google Scholar]
- 2.Weinreb RN, Aung T, Medeiros FA. The pathophysiology and treatment of glaucoma: a review. JAMA 2014;311:1901–11. [DOI] [PMC free article] [PubMed] [Google Scholar]
- 3.Budenz DL, Anderson DR, Feuer WJ, et al. Detection and prognostic significance of optic disc hemorrhages during the Ocular Hypertension Treatment Study. Ophthalmology 2006;113:2137–43. [DOI] [PMC free article] [PubMed] [Google Scholar]
- 4.Kim HJ, Song YJ, Kim YK, Jeoung JW, Park KH. Development of visual field defect after first-detected optic disc hemorrhage in preperimetric open-angle glaucoma. Jpn J Ophthalmol 2017;61:307–313. [DOI] [PubMed] [Google Scholar]
- 5.Sawada A, Manabe Y, Yamamoto T, Nagata C. Long-term clinical course of normotensive preperimetric glaucoma. Br J Ophthalmol 2017;101:1649–1653. [DOI] [PubMed] [Google Scholar]
- 6.Leske MC, Heijl A, Hussein M, et al. Factors for glaucoma progression and the effect of treatment: the early manifest glaucoma trial. Arch Ophthalmol 2003;121:48–56. [DOI] [PubMed] [Google Scholar]
- 7.Keltner JL, Johnson CA, Anderson DR, et al. The association between glaucomatous visual fields and optic nerve head features in the Ocular Hypertension Treatment Study. Ophthalmology 2006;113:1603–12. [DOI] [PubMed] [Google Scholar]
- 8.De Moraes CG, Prata TS, Liebmann CA, Tello C, Ritch R, Liebmann JM. Spatially consistent, localized visual field loss before and after disc hemorrhage. Invest Ophthalmol Vis Sci 2009;50:4727–33. [DOI] [PubMed] [Google Scholar]
- 9.Medeiros FA, Alencar LM, Sample PA, Zangwill LM, Susanna R Jr., Weinreb RN. The relationship between intraocular pressure reduction and rates of progressive visual field loss in eyes with optic disc hemorrhage. Ophthalmology 2010;117:2061–6. [DOI] [PubMed] [Google Scholar]
- 10.Kim JM, Kyung H, Azarbod P, Lee JM, Caprioli J. Disc haemorrhage is associated with the fast component, but not the slow component, of visual field decay rate in glaucoma. Br J Ophthalmol 2014;98:1555–9. [DOI] [PubMed] [Google Scholar]
- 11.Chan TCW, Bala C, Siu A, Wan F, White A. Risk Factors for Rapid Glaucoma Disease Progression. Am J Ophthalmol 2017;180:151–157. [DOI] [PubMed] [Google Scholar]
- 12.Lee EJ, Han JC, Kee C. A novel hypothesis for the pathogenesis of glaucomatous disc hemorrhage. Prog Retin Eye Res 2017;60:20–43. [DOI] [PubMed] [Google Scholar]
- 13.Kim KE, Park KH. Optic disc hemorrhage in glaucoma: pathophysiology and prognostic significance. Curr Opin Ophthalmol 2017;28:105–112. [DOI] [PubMed] [Google Scholar]
- 14.Yarmohammadi A, Zangwill LM, Diniz-Filho A, et al. Optical coherence tomography angiography vessel density in healthy, glaucoma suspect, and glaucoma eyes. Investigative ophthalmology & visual science 2016;57:OCT451–OCT459. [DOI] [PMC free article] [PubMed] [Google Scholar]
- 15.Yarmohammadi A, Zangwill LM, Diniz-Filho A, et al. Relationship between Optical Coherence Tomography Angiography Vessel Density and Severity of Visual Field Loss in Glaucoma. Ophthalmology 2016;123:2498–2508. [DOI] [PMC free article] [PubMed] [Google Scholar]
- 16.Rao HL, Pradhan ZS, Weinreb RN, et al. Regional Comparisons of Optical Coherence Tomography Angiography Vessel Density in Primary Open-Angle Glaucoma. Am J Ophthalmol 2016;171:75–83. [DOI] [PubMed] [Google Scholar]
- 17.Jonas JB, Iester M. Disc hemorrhage and glaucoma. Ophthalmology 1995;102:365–6. [DOI] [PubMed] [Google Scholar]
- 18.Liu L, Jia Y, Takusagawa HL, et al. Optical Coherence Tomography Angiography of the Peripapillary Retina in Glaucoma. JAMA Ophthalmol 2015;133:1045–52. [DOI] [PMC free article] [PubMed] [Google Scholar]
- 19.Garway-Heath DF, Holder GE, Fitzke FW, Hitchings RA. Relationship between electrophysiological, psychophysical, and anatomical measurements in glaucoma. Invest Ophthalmol Vis Sci 2002;43:2213–20. [PubMed] [Google Scholar]
- 20.Leite MT, Rao HL, Weinreb RN, et al. Agreement among spectral-domain optical coherence tomography instruments for assessing retinal nerve fiber layer thickness. Am J Ophthalmol 2011;151:85–92 e1. [DOI] [PubMed] [Google Scholar]
- 21.Laird NM, Ware JH. Random-effects models for longitudinal data. Biometrics 1982;38:963–74. [PubMed] [Google Scholar]
- 22.Laird NM, Donnelly C, Ware JH. Longitudinal studies with continuous responses. Stat Methods Med Res 1992;1:225–47. [DOI] [PubMed] [Google Scholar]
- 23.Zhang X, Dastiridou A, Francis BA, et al. Baseline Fourier-Domain Optical Coherence Tomography Structural Risk Factors for Visual Field Progression in the Advanced Imaging for Glaucoma Study. Am J Ophthalmol 2016;172:94–103. [DOI] [PMC free article] [PubMed] [Google Scholar]
- 24.Medeiros FA, Meira-Freitas D, Lisboa R, Kuang TM, Zangwill LM, Weinreb RN. Corneal hysteresis as a risk factor for glaucoma progression: a prospective longitudinal study. Ophthalmology 2013;120:1533–40. [DOI] [PMC free article] [PubMed] [Google Scholar]
- 25.Nitta K, Sugiyama K, Wajima R, Tachibana G, Yamada Y. Associations between changes in radial peripapillary capillaries and occurrence of disc hemorrhage in normal-tension glaucoma. Graefes Arch Clin Exp Ophthalmol 2019;257:1963–1970. [DOI] [PubMed] [Google Scholar]
- 26.Okamoto Y, Akagi T, Suda K, et al. Longitudinal changes in superficial microvasculature in glaucomatous retinal nerve fiber layer defects after disc hemorrhage. Sci Rep 2020;10:22058. [DOI] [PMC free article] [PubMed] [Google Scholar]
- 27.Yarmohammadi A, Zangwill LM, Diniz-Filho A, et al. Optical Coherence Tomography Angiography Vessel Density in Healthy, Glaucoma Suspect, and Glaucoma Eyes. Invest Ophthalmol Vis Sci 2016;57:OCT451–9. [DOI] [PMC free article] [PubMed] [Google Scholar]
- 28.Furlanetto RL, De Moraes CG, Teng CC, et al. Risk factors for optic disc hemorrhage in the low-pressure glaucoma treatment study. Am J Ophthalmol 2014;157:945–52. [DOI] [PubMed] [Google Scholar]
- 29.Drance SM. Disc hemorrhages in the glaucomas. Surv Ophthalmol 1989;33:331–7. [DOI] [PubMed] [Google Scholar]
- 30.Liu X, Lau A, Hou H, et al. Progressive Thinning of Retinal Nerve Fiber Layer and Ganglion Cell-Inner Plexiform Layer in Glaucoma Eyes with Disc Hemorrhage. Ophthalmol Glaucoma 2021. [DOI] [PMC free article] [PubMed] [Google Scholar]
- 31.Suh MH, Park KH, Kim H, et al. Glaucoma progression after the first-detected optic disc hemorrhage by optical coherence tomography. J Glaucoma 2012;21:358–66. [DOI] [PubMed] [Google Scholar]
- 32.Akagi T, Zangwill LM, Saunders LJ, et al. Rates of Local Retinal Nerve Fiber Layer Thinning before and after Disc Hemorrhage in Glaucoma. Ophthalmology 2017;124:1403–1411. [DOI] [PMC free article] [PubMed] [Google Scholar]
- 33.Kitazawa Y, Shirato S, Yamamoto T. Optic disc hemorrhage in low-tension glaucoma. Ophthalmology 1986;93:853–7. [DOI] [PubMed] [Google Scholar]
- 34.Mayama C, Araie M. Effects of antiglaucoma drugs on blood flow of optic nerve heads and related structures. Jpn J Ophthalmol 2013;57:133–49. [DOI] [PubMed] [Google Scholar]
- 35.Chihara E, Dimitrova G, Chihara T. Increase in the OCT angiographic peripapillary vessel density by ROCK inhibitor ripasudil instillation: a comparison with brimonidine. Graefes Arch Clin Exp Ophthalmol 2018;256:1257–1264. [DOI] [PMC free article] [PubMed] [Google Scholar]
Associated Data
This section collects any data citations, data availability statements, or supplementary materials included in this article.