
Fig. 1. Regional sentinel genetic variants associated (p<1.004×10⁻¹¹) with at least one protein target in up to 10,708 participants from the Fenland Study.
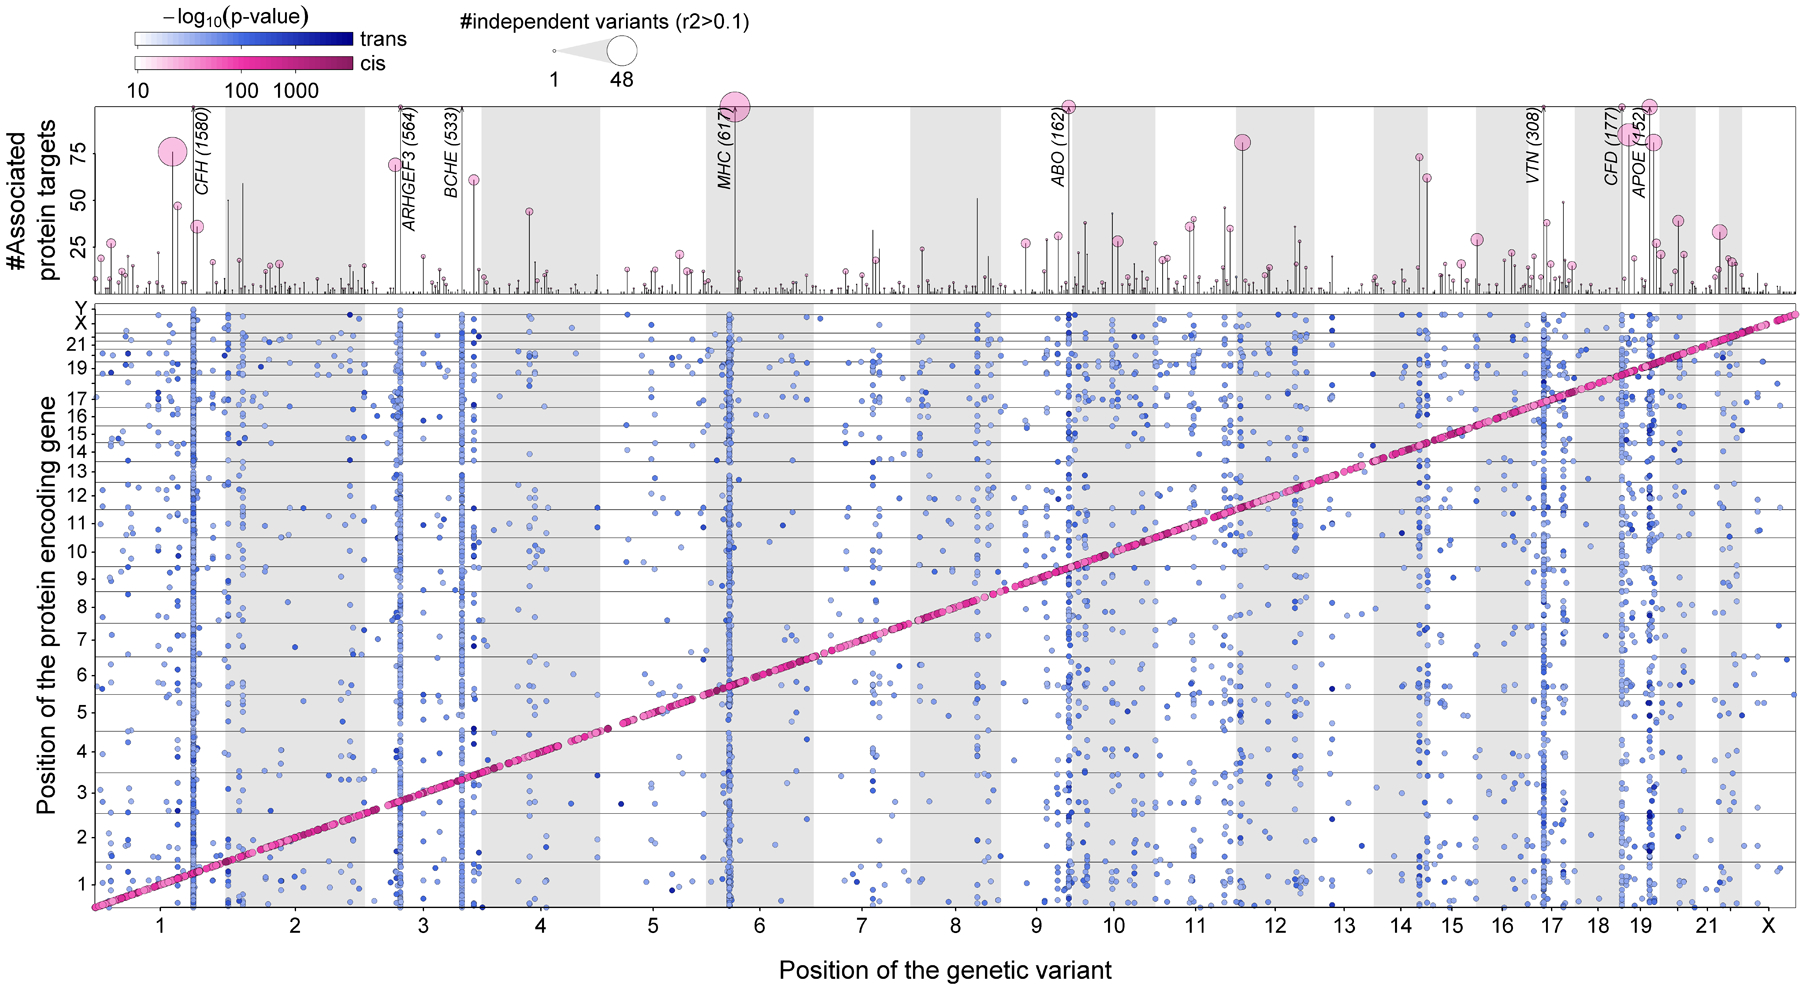
The lower panel maps the genomic locations of the genetic variants against the genomic locations of the protein-encoding genes. Genetic variants close to the protein-encoding gene (±500 kb) are highlighted in pink (cis-pQTLs) and all others are shown in blue (trans-pQTLs). Darker shades indicate more significant p-values. The upper panel shows the number of associated protein targets for each genomic region (vertical line), with circles above representing the number of approximately independent genetic variants (r2<0.1), such that larger circles indicate more genetic variants in the region.