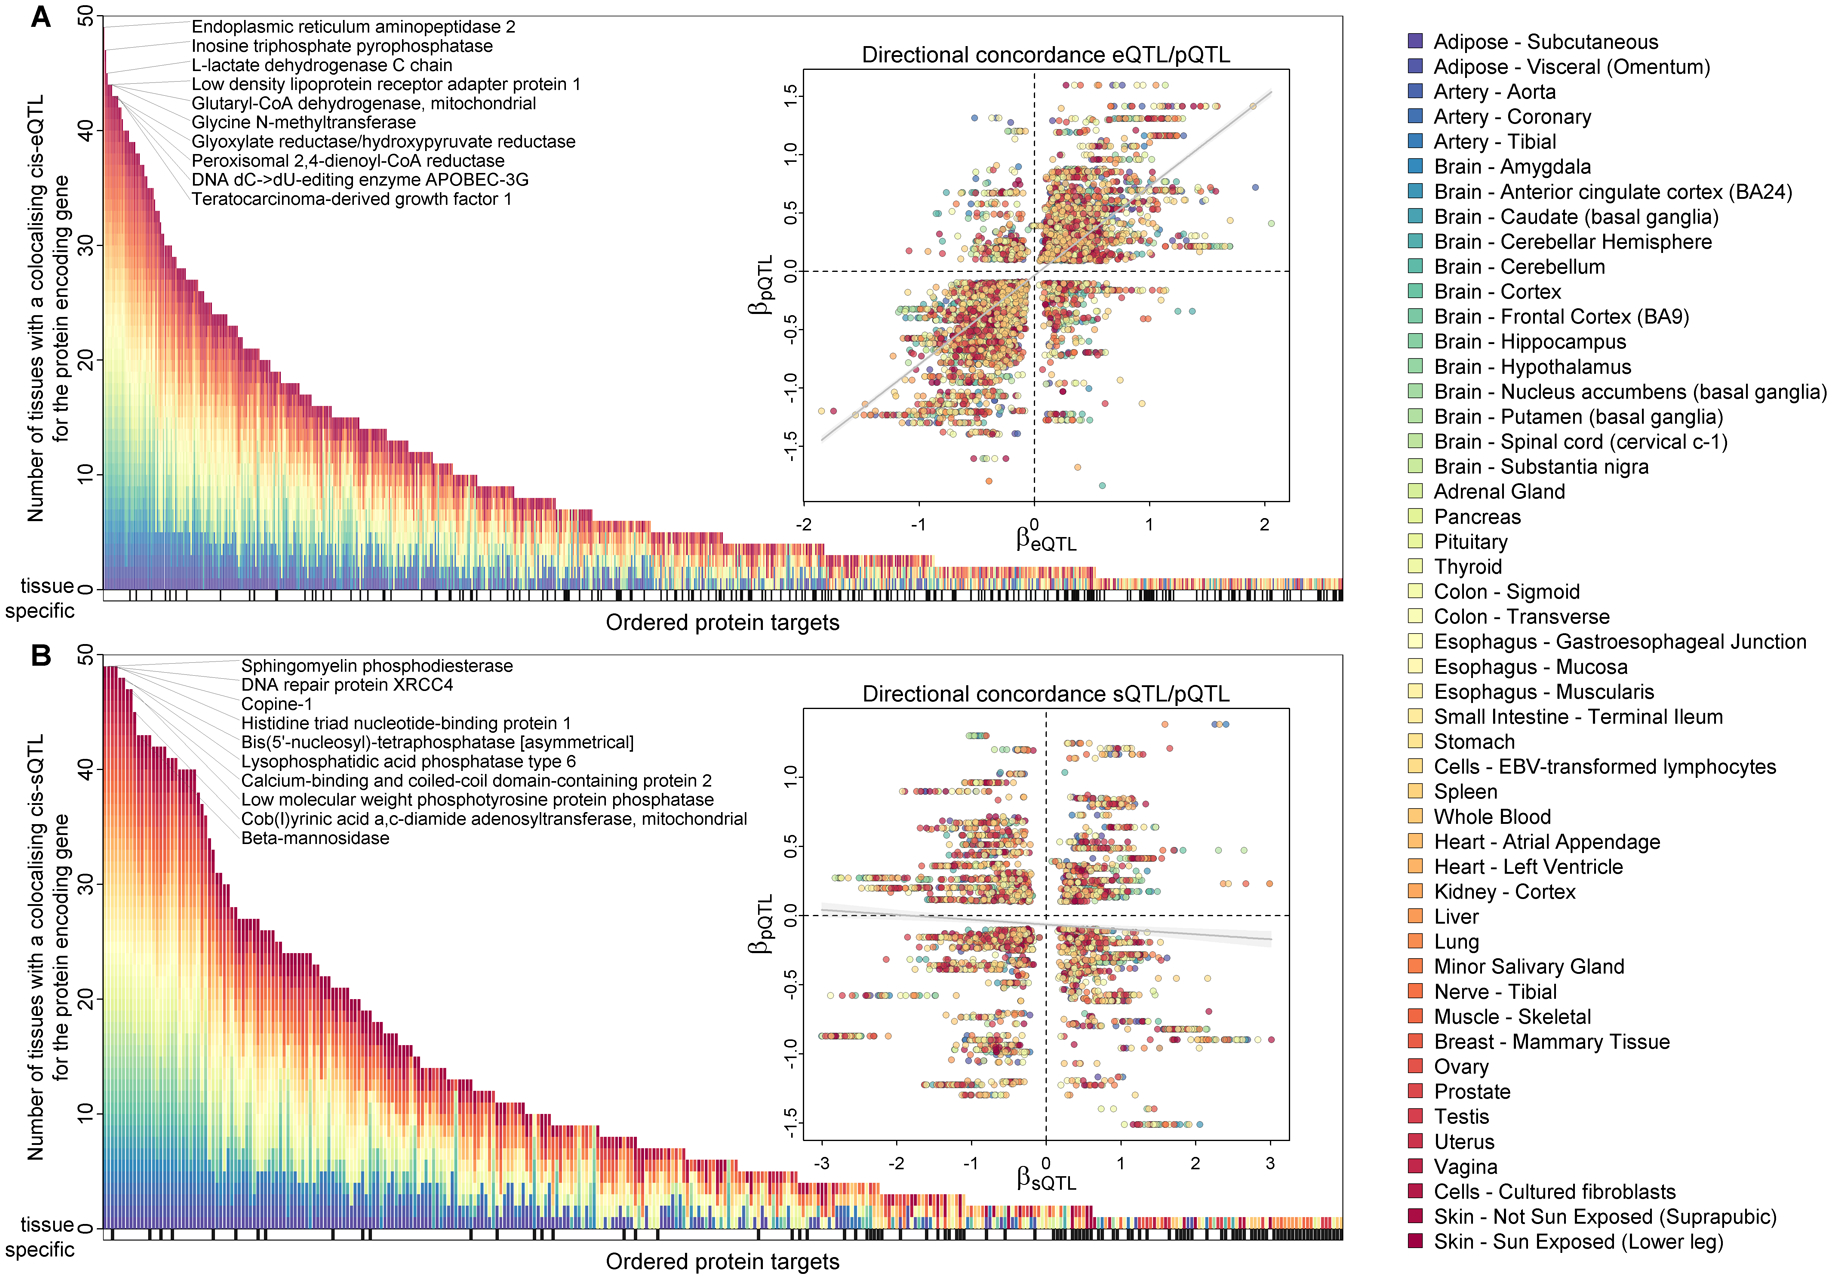
Fig. 3. Integration of gene and splicing quantitative trait loci (eQTLs and sQTLs).

A) Protein targets ordered by the number of tissues for which at least one of the cis-pQTLs was also a cis-eQTL as determined by statistical colocalization (posterior probability >80% for a shared signal). Protein targets for which the eQTL showed evidence for a tissue-specific effect are indicated by black vertical lines underneath. B) Same as A) but considering cis-sQTLs.
