

Abstract
Objective:
To determine metrics and provider characteristics associated with inappropriate antibiotic prescribing for respiratory tract diagnoses (RTDs).
Design:
Retrospective cohort study.
Setting:
Primary care practices in a university health system.
Participants:
Patients seen by an attending physician or advanced practice provider (APP) at their primary care office visit with International Classification of Disease, Tenth Revision, Clinical Modification (ICD-10-CM)–coded RTDs.
Methods:
Medical records were reviewed for 1,200 randomly selected office visits in which an antibiotic was prescribed to determine appropriateness. Based on this gold standard, metrics and provider characteristics associated with inappropriate antibiotic prescribing were determined.
Results:
Overall, 69% of antibiotics were inappropriate. Metrics utilizing prespecified RTDs most strongly associated with inappropriate prescribing were (1) proportion prescribing for RTDs for which antibiotics are almost never required (eg, bronchitis) and (2) proportion prescribing for any RTD. Provider characteristics associated with inappropriate antibiotic prescribing were APP versus physician (72% vs 58%; P = .02), family medicine versus internal medicine (76% vs 63%; P = .01), board certification 1997 or later versus board certification before 1997 (75% vs 63%; P = .02), nonteaching versus teaching practice (73% vs 51%; P < .01), and nonurban vs urban practice (77% vs 57%; P < .01).
Conclusions:
Metrics utilizing proportion prescribing for RTDs for which antibiotics are almost never required and proportion prescribing for any RTD were most strongly associated with inappropriate prescribing. APPs and clinicians with family medicine training, with board certification 1997 or later, and who worked in nonteaching or nonurban practices had higher proportions of inappropriate prescribing. These findings could inform design of interventions to improve prescribing and could represent an efficient way to track inappropriate prescribing.
Antibiotic resistance is estimated to cause >2.8 million infections and >35,000 deaths in the United States each year.1 Antibiotic overuse is a major driver of antibiotic resistance. Most antibiotic prescribing takes place in the ambulatory setting, and at least 30% of all outpatient antibiotic prescriptions are unnecessary.2,3 Most of the avoidable outpatient prescribing is for respiratory tract infections.4
The Centers for Disease Control and Prevention (CDC) Core Elements of Outpatient Antibiotic Stewardship call for tracking and reporting ambulatory antibiotic prescribing by individual clinician and facility.5 However, it is not practical to perform retrospective chart review to audit prescribing, so metrics that can be easily extracted are needed. In an effort to organize administrative data more meaningfully, Fleming-Dutra et al3 grouped International Classification of Diseases, Ninth Revision, Clinical Modification (ICD-9-CM) codes for infections into 3 tiers based on whether or not antibiotics are indicated. Tier 1 diagnoses are conditions for which antibiotics are almost always indicated (eg, bacterial pneumonia); tier 2 diagnoses are conditions for which antibiotics may be indicated depending on the clinical scenario (eg, sinusitis); and tier 3 diagnoses are conditions for which antibiotics are almost never indicated (eg, bronchitis).3
Metrics derived from administrative data have the potential to make tracking and reporting antibiotic prescribing data more efficient. However, determining which metrics are most strongly associated with inappropriate prescribing is essential. The primary objective of this study was to determine metrics using prespecified respiratory tract diagnoses (RTDs) that are most strongly associated with inappropriate antibiotic prescribing. The secondary objective was to determine provider characteristics associated with inappropriate prescribing.
Methods
Data collection
We conducted a retrospective cohort study from January 1, 2016, through December 31, 2016, at the 32 primary care practices in the University of Pennsylvania Health System, which included 227 primary care providers. There were no ongoing antibiotic stewardship interventions at any of the practices throughout the study period. Likewise, no clinical decision support tools for treatment of respiratory tract infections were in use.
Office visits were eligible for inclusion if (1) there was an ICD-10-CM code for at least 1 RTD (Supplemental Table 1, online), (2) the patient was at least 18 years of age, and (3) the prescriber was either an attending physician or advanced practice provider (APP). Office visits were excluded if an infection other than a respiratory infection was coded in the same visit. Only office visits in which a patient was seen primarily by an attending physician or APP were included in the analysis, given that resident trainees were not present in all practices. Only the first office visit during the study period per patient was included. Demographics were collected for all patients in the study cohort. Comorbidities were collected using ICD-9-CM and ICD-10-CM codes within 1 year prior to the index office visit.
To determine a gold standard of antibiotic appropriateness, encounters were randomly selected from office visits in which an oral antibacterial agent (excluding rifamycins, ethambutol, isoniazid, pyrazinamide, vancomycin, rifaximin, fidaxomicin, fosfomycin, metronidazole, and nitrofurantoin) or intramuscular penicillin was prescribed. To identify the random subset, 60 prescribers were randomly selected. Then, 20 office visits for each of these prescribers were randomly selected, for a total of 1,200 randomly selected office visits (Fig. 1).
Fig. 1.
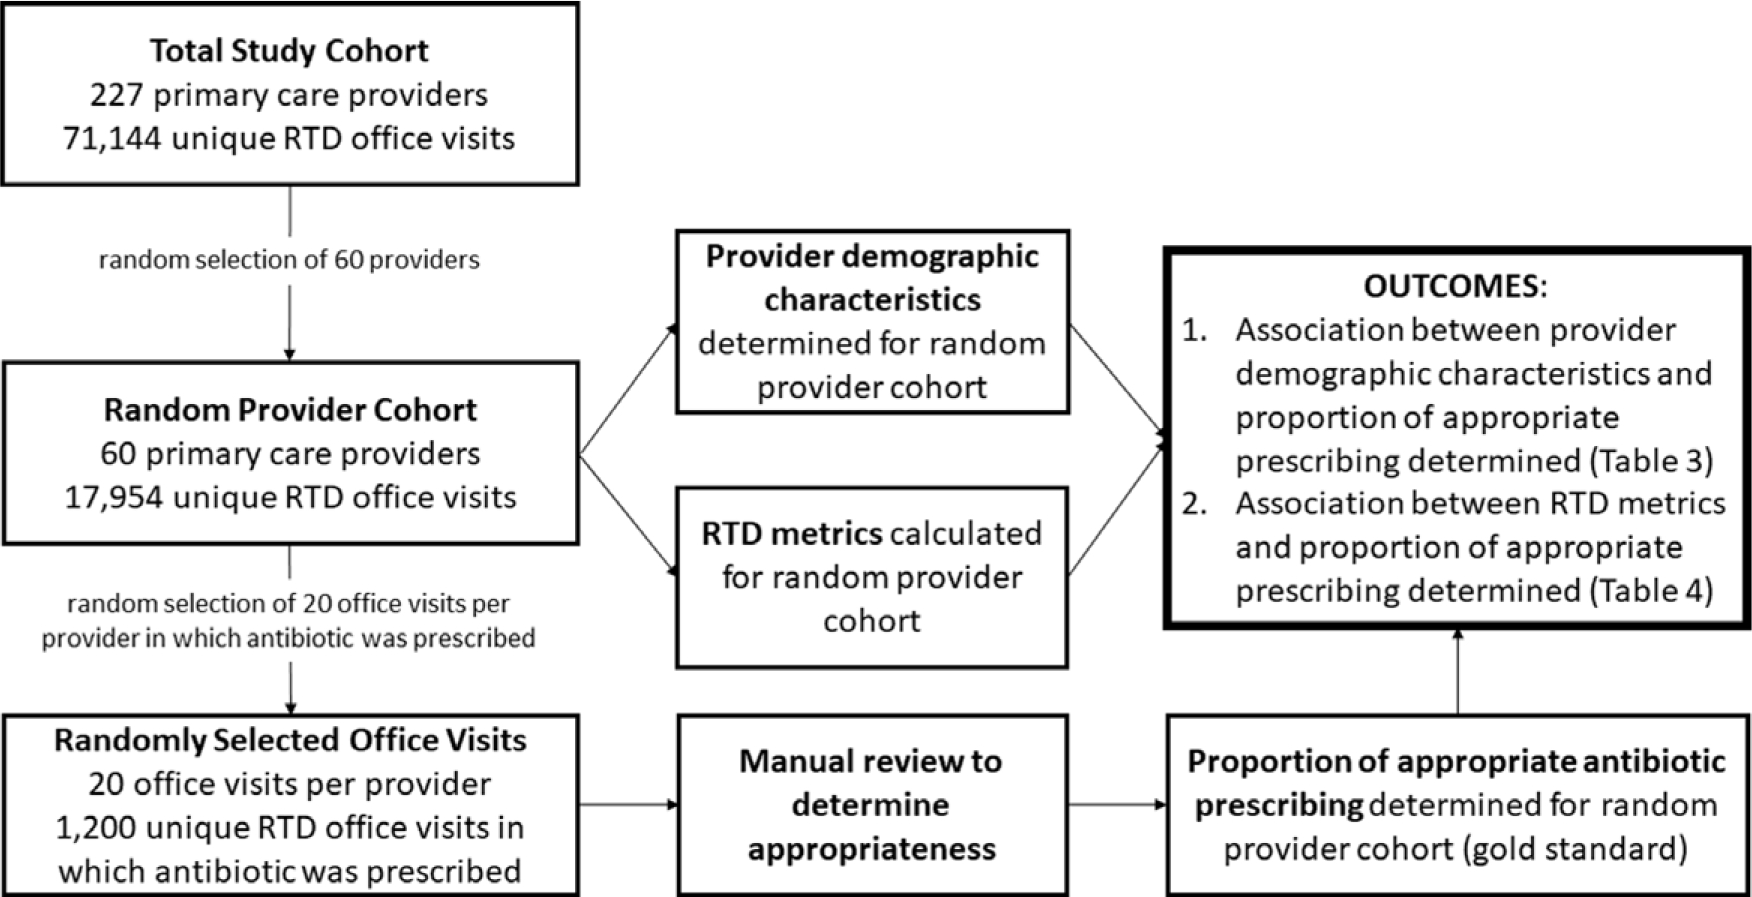
Methods of determining the association of appropriate antibiotic prescribing with respiratory tract diagnosis (RTD) metrics and provider demographic characteristics.
Electronic health records (EHRs) from each office visit in the random subset were reviewed by at least 1 of 4 infectious diseases physicians (V.C., K.D., M.D., and K.H.). The decision to prescribe an antibiotic was coded as appropriate or inappropriate based on diagnostic criteria for bacterial respiratory tract infections. Diagnostic criteria for bacterial community-acquired pneumonia, group A Streptococcus pharyngitis, and bacterial rhinosinusitis were based on Infectious Diseases Society of America (IDSA) guidelines.6–8 Diagnostic criteria for bacterial otitis media were modified from American Academy of Pediatrics guidelines.9 Diagnosis of pertussis was based on CDC criteria.10 Prescribing for bronchitis was considered appropriate only if the patient had an established diagnosis of chronic obstructive pulmonary disease or bronchiectasis and the patient fit clinical criteria for antibiotic treatment based on Global Initiative for Obstructive Lung Disease criteria.11
Antibiotics were classified as appropriate if the patient fit diagnostic criteria for a bacterial respiratory tract infection. Otherwise, they were classified as inappropriate. Only the decision to prescribe an antibiotic was considered when determining appropriateness. Antibiotic choice, dose, and duration were not considered. Chart abstraction for appropriateness was performed using REDCap electronic data capture tools hosted at the University of Pennsylvania.12 Also, 15% of office visits were double-coded by 2 infectious diseases physicians. If there was a discrepancy in the determination of appropriateness for an office visit, 3 infectious diseases physicians discussed the case and came to a consensus on appropriateness. This adjudicated decision was used as the final determination of appropriateness for the double-coded encounters.
RTD metrics that were evaluated to determine their association with appropriateness included the proportion of antibiotic prescribing for visits in which (1) any RTD was coded; (2) a tier 3 RTD was coded; (3) an upper RTD was coded; (4) a lower RTD was coded; (5) bronchitis was coded; and (6) nonspecific symptoms (eg, cough) were coded without a specific RTD. Determination of tier 3 RTDs were based on modified criteria previously described using ICD-10-CM codes for diagnoses in which antibiotics are almost never indicated; office visits were excluded if the visit included a tier 1 or tier 2 RTD.3 The denominator for all of these RTD metrics was calculated by identifying all of the visits coded with a relevant ICD-10-CM code. The proportion for which an antibiotic was prescribed was determined for each of the visit types. Only the first visit for each patient was utilized in these calculations.
To examine the impact of severity of illness, the mean Charlson comorbidity index (CCI) was calculated for each primary care provider by first identifying all patients seen by that prescriber with a code for an RTD during the study period. Next, a CCI for each of these patients was calculated using ICD-9-CM and ICD-10-CM codes for relevant comorbidities during the year prior to the office visit using a method previously described.13 A mean CCI was then calculated for each provider.
Prescriber demographics were collected, including medical degree type, specialty, year of board certification, and gender. The ambulatory care practices were characterized as either teaching or nonteaching depending on whether resident trainees saw patients at the clinic, and they were characterized as either urban or nonurban.
Statistical analysis
Categorical variables were summarized using frequencies, and continuous variables were summarized using mean and median when appropriate. The association between demographic factors and appropriate prescribing was determined using a t test or a Wilcoxon rank-sum test where appropriate. Linear regression was used to determine the RTD metrics that were associated with appropriate antibiotic prescribing, as determined from a manual EHR review of randomly selected patients. Multivariate regression was performed to adjust for CCI. R2 was used to evaluate association of these RTD metrics with appropriateness. Data were analyzed using STATA version 15.0 software (StataCorp, College Station, TX). This study was approved by the University of Pennsylvania Institutional Review Board.
Results
Of 109,049 total office visits during the study period, 42,196 visits (39%) were identified in which an antibiotic was prescribed with a respiratory diagnosis. When duplicate patients were removed, 26,671 unique patient visits (37%) of 71,144 office visits were identified in which an antibiotic was prescribed. There were 89,240 ICD-10-CM codes for RTDs in these 71,144 unique office visits. For the visits in which an antibiotic was prescribed, there were 31,677 ICD-10 codes for RTDs. Demographic characteristics and comorbidities of patients in the study cohort and random subset are shown in Table 1. RTDs are shown in Table 2, and antibiotics prescribed in these visits are shown in Supplementary Table 2 (online). The total number of antibiotic prescriptions from office visits in which an RTD was coded and proportion of antibiotic prescribing for each RTD metric by month are shown in Figure 2.
Table 1.
Demographics and Comorbidities of Patients in Study Cohort and the Random Cohort
| Characteristic | All Unique Patients in Cohort (N=71,144) | Patients Randomly Selected for Manual Review (N=1,200) |
|---|---|---|
| Age, mean (SD) | 51 (18) | 54 (18) |
| Sex, No. (%) | ||
| Female | 46,201 (65) | 744 (62) |
| Male | 24,913 (35) | 455 (38) |
| Race, No. (%) | ||
| White | 49,815 (70) | 826 (69) |
| Black | 14,938 (21) | 241 (20) |
| Asian | 2,132 (3) | 40 (3) |
| Other | 4,259 (6) | 93 (8) |
| Comorbidities, No. (%) | ||
| Asthma | 4,497 (6) | 96 (8) |
| Bronchiectasis | 134 (0.2) | 1 (0.1) |
| Coronary artery disease | 3,851 (5) | 62 (5) |
| Congestive heart failure | 3,004 (4) | 66 (6) |
| COPD | 1,568 (3) | 31 (3) |
| Chronic kidney disease | 1,976 (3) | 33 (3) |
| Diabetes | 5,821 (8) | 103 (9) |
| HIV | 705 (1) | 12 (1) |
| Hyperlipidemia | 8,985 (13) | 157 (13) |
| Hypertension | 14,362 (20) | 256 (21) |
| Immunodeficiency other than HIV | 377 (0.5) | 9 (0.8) |
| Liver disease | 1,208 (2) | 28 (2) |
| Lung disease other than COPD | 1,562 (2) | 34 (3) |
| Malignancy | 4,617 (6) | 71 (6) |
| Peripheral artery disease | 578 (1) | 6 (1) |
| Transient ischemic attack or stroke | 603 (1) | 12 (1) |
| Solid organ or stem cell transplant | 288 (0.4) | 5 (0.4) |
Note. SD, standard deviation; COPD, chronic obstructive pulmonary disease; HIV, human immunodeficiency virus.
Table2.
Respiratory Tract Diagnoses (RTDs) in Visits With an Antibiotic Prescribed for All Patients in the Study Cohort as Well as Subset of 1,200 Randomly Selected Patients, Identified by ICD-10-CM Code
| Diagnosis | Diagnoses in All RTD Office Visits with Antibiotic Prescribed (N=31,677 diagnoses in 26,671 office visits), No. (%) | Diagnoses in 1,200 Randomly Selected Office Visits (N=1,560 diagnoses in 1,200 office visits), No (%) |
|---|---|---|
| Respiratory Tract Diagnoses | ||
| Infectious diagnoses | 22,576 (71) | 1,032 (66) |
| Sinusitis | 9,509 (30) | 397 (25) |
| Laryng/Tracheo/Bronchitis | 4,502 (14) | 187 (12) |
| Pharyngitis | 3,396 (11) | 185 (12) |
| Acute URI | 2,738 (9) | 154 (10) |
| Otitis media | 1,780 (6) | 57 (4) |
| Pneumonia | 526 (2) | 26 (2) |
| Pertussis | 9 (0.03) | 2 (0.1) |
| Other | 116 (0.4) | 24 (1.5) |
| Noninfectious diagnoses | 4,818 (15) | 265 (17) |
| Other/unspecified | 1,743 (6) | 65 (4) |
| Asthma | 1,510 (5) | 56 (4) |
| Allergic rhinitis | 1,126 (4) | 52 (3) |
| COPD | 385 (1) | 67 (4) |
| Bronchiectasis | 54 (0.2) | 25 (2) |
| Nonspecific symptoms | 4,283 (14) | 263 (17) |
| Cough | 2,824 (9) | 201 (13) |
| Wheezing/bronchospasm | 512 (2) | 27 (2) |
| Nasal congestion | 355 (1%) | 13 (1) |
| Dyspnea | 243 (1) | 8 (1) |
| Post-nasal drip | 183 (1) | 7 (0.4) |
| Throat pain | 83 (0.3) | 2 (0.1) |
| Other | 83 (0.3) | 5 (0.3) |
| Tier Groups | ||
| Tier 1 | 1,067 (3) | 30 (2) |
| Tier 2 | 13,143 (41) | 636 (41) |
| Tier 3 | 17,467 (55) | 894 (57) |
| Respiratory Tract Diagnosis Groups | ||
| Upper respiratory tract | 18,995 (60) | 823 (53) |
| Lower respiratory tract | 8,473 (27) | 434 (28) |
| Nonspecific | 4,209 (13) | 303 (19) |
Note. ICD-10-CM, International Classification of Disease, Tenth Revision, Clinical Modification; URI, upper respiratory tract infection; COPD, chronic obstructive pulmonary disease.
Fig. 2.
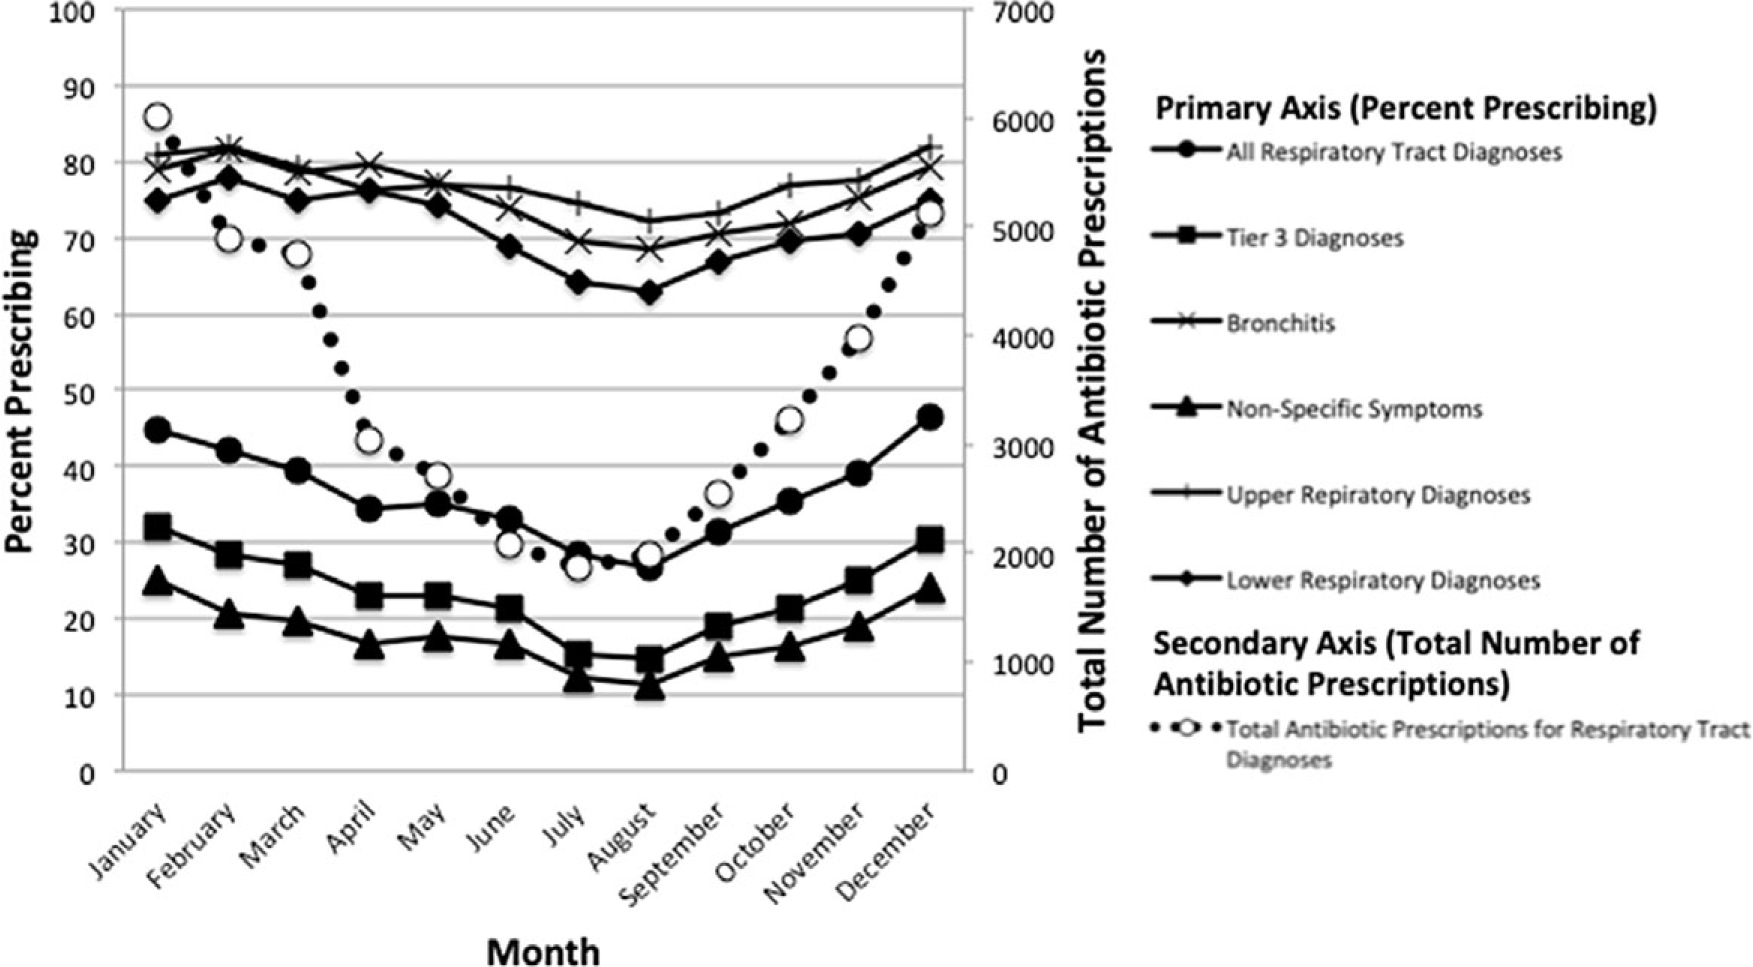
Proportion of antibiotic prescribing for respiratory tract diagnosis (RTD) metrics and total number of antibiotic prescriptions for RTDs by month.
In the entire study cohort, there was considerable variability in the proportion of prescribing for the different RTD metrics (Supplementary Figure 1 online). Of all the RTD metrics, bronchitis had the highest overall median of provider prescribing (ie, 59%) as well as the widest range (0–100%). Nonspecific symptoms had the lowest median provider prescribing (ie, 13%) and the narrowest range excluding outliers (0%–60%).
Of the 180 office visits that were double-coded in the random subset, there was 92% concordance between coders for determination of antibiotic prescribing appropriateness. Overall, 69% of all antibiotic prescriptions for RTDs were determined to be inappropriate, with a range of 15%–100% for individual providers. Certain provider characteristics were associated with higher proportion of inappropriate prescribing including APP, family medicine specialty, initial board certification 1997 or later, nonteaching practice, and nonurban practice (Table 3). Female clinicians had higher rates of inappropriate prescribing, but this difference was not statistically significant. Given the seasonal variation in antibiotic prescribing for RTDs (Fig. 1), a post hoc analysis of inappropriateness by time of year was performed, demonstrating that fall and winter months (October–March) were associated with higher proportion of inappropriate prescribing than spring and summer months (April–September) (74% vs 63%; P < .01).
Table 3.
Primary Care Provider Demographic Characteristics and Association With Proportion of Inappropriate Antibiotic Prescribing for RTDs for the 60 Providers Randomly Selected to Determine Appropriateness of Antibiotic Prescriptions
| Characteristics | No. (%) | % Inappropriate | P Value |
|---|---|---|---|
| Provider Role | |||
| Physician | 47 (78) | 58 | .02 |
| APP | 13 (22) | 72 | |
| Provider Gender | |||
| Male | 23 (38) | 66 | .10 |
| Female | 37 (62) | 73 | |
| Provider Specialty | |||
| Internal medicine specialty | 35 (57) | 63 | .01 |
| Family medicine specialty | 25 (42) | 76 | |
| Board Certification Year | |||
| Board certification before 1997 | 26 (43) | 63 | .02 |
| Board certification 1997 or later | 34 (57) | 75 | |
| Teaching Status | |||
| Teaching practice | 14 (23) | 51 | <.01 |
| Nonteaching practice | 46 (77) | 73 | |
| Practice Setting | |||
| Urban practice | 27 (45) | 57 | <.01 |
| Nonurban practice | 33 (55) | 77 | |
Note. RTD, respiratory tract diagnosis; APP, advance practice provider.
The individual RTD metrics that were most strongly associated with inappropriate prescribing in univariate analysis were proportion of prescribing for tier 3 RTDs (R2 = 0.24; P < .01) and proportion of prescribing for all RTDs (R2 = 0.23; P < .01) (Table 4 and Fig. 3). These RTD metrics, as well as all other metrics reporting proportion prescribing for various groupings of RTDs, had a positive association with inappropriateness as determined by manual chart review. In other words, primary care providers with a higher proportion of visits with antibiotic prescriptions also tended to prescribe inappropriate antibiotics more frequently.
Table 4.
Association of RTD Metrics With Appropriateness of Antibiotic Prescribing as Determined by Manual Chart Review for 60 Randomly Selected Primary Care Providers
| Metric | β-Coefficient | 95% CI | P Value | R2 |
|---|---|---|---|---|
| Prescribing for tier 3 RTDs | 0.7 | 0.3–1.0 | <.01 | 0.24 |
| Prescribing for all RTDs | 0.5 | 0.3–0.8 | <.01 | 0.23 |
| Prescribing for upper RTDs | 0.5 | 0.2–0.7 | <.01 | 0.20 |
| Prescribing for lower RTDs | 0.5 | 0.2–0.7 | <.01 | 0.19 |
| Prescribing for bronchitis | 0.2 | 0.1–0.4 | <.01 | 0.11 |
| Prescribing for nonspecific symptoms | 0.5 | 0.1–1.0 | .03 | 0.08 |
| Provider CCI | −5.9 | −11.4 to 0.1 | .12 | 0.04 |
Note. RTD, respiratory tract diagnosis; CI, confidence interval; CCI, Charlson comorbidity index.
Fig. 3.
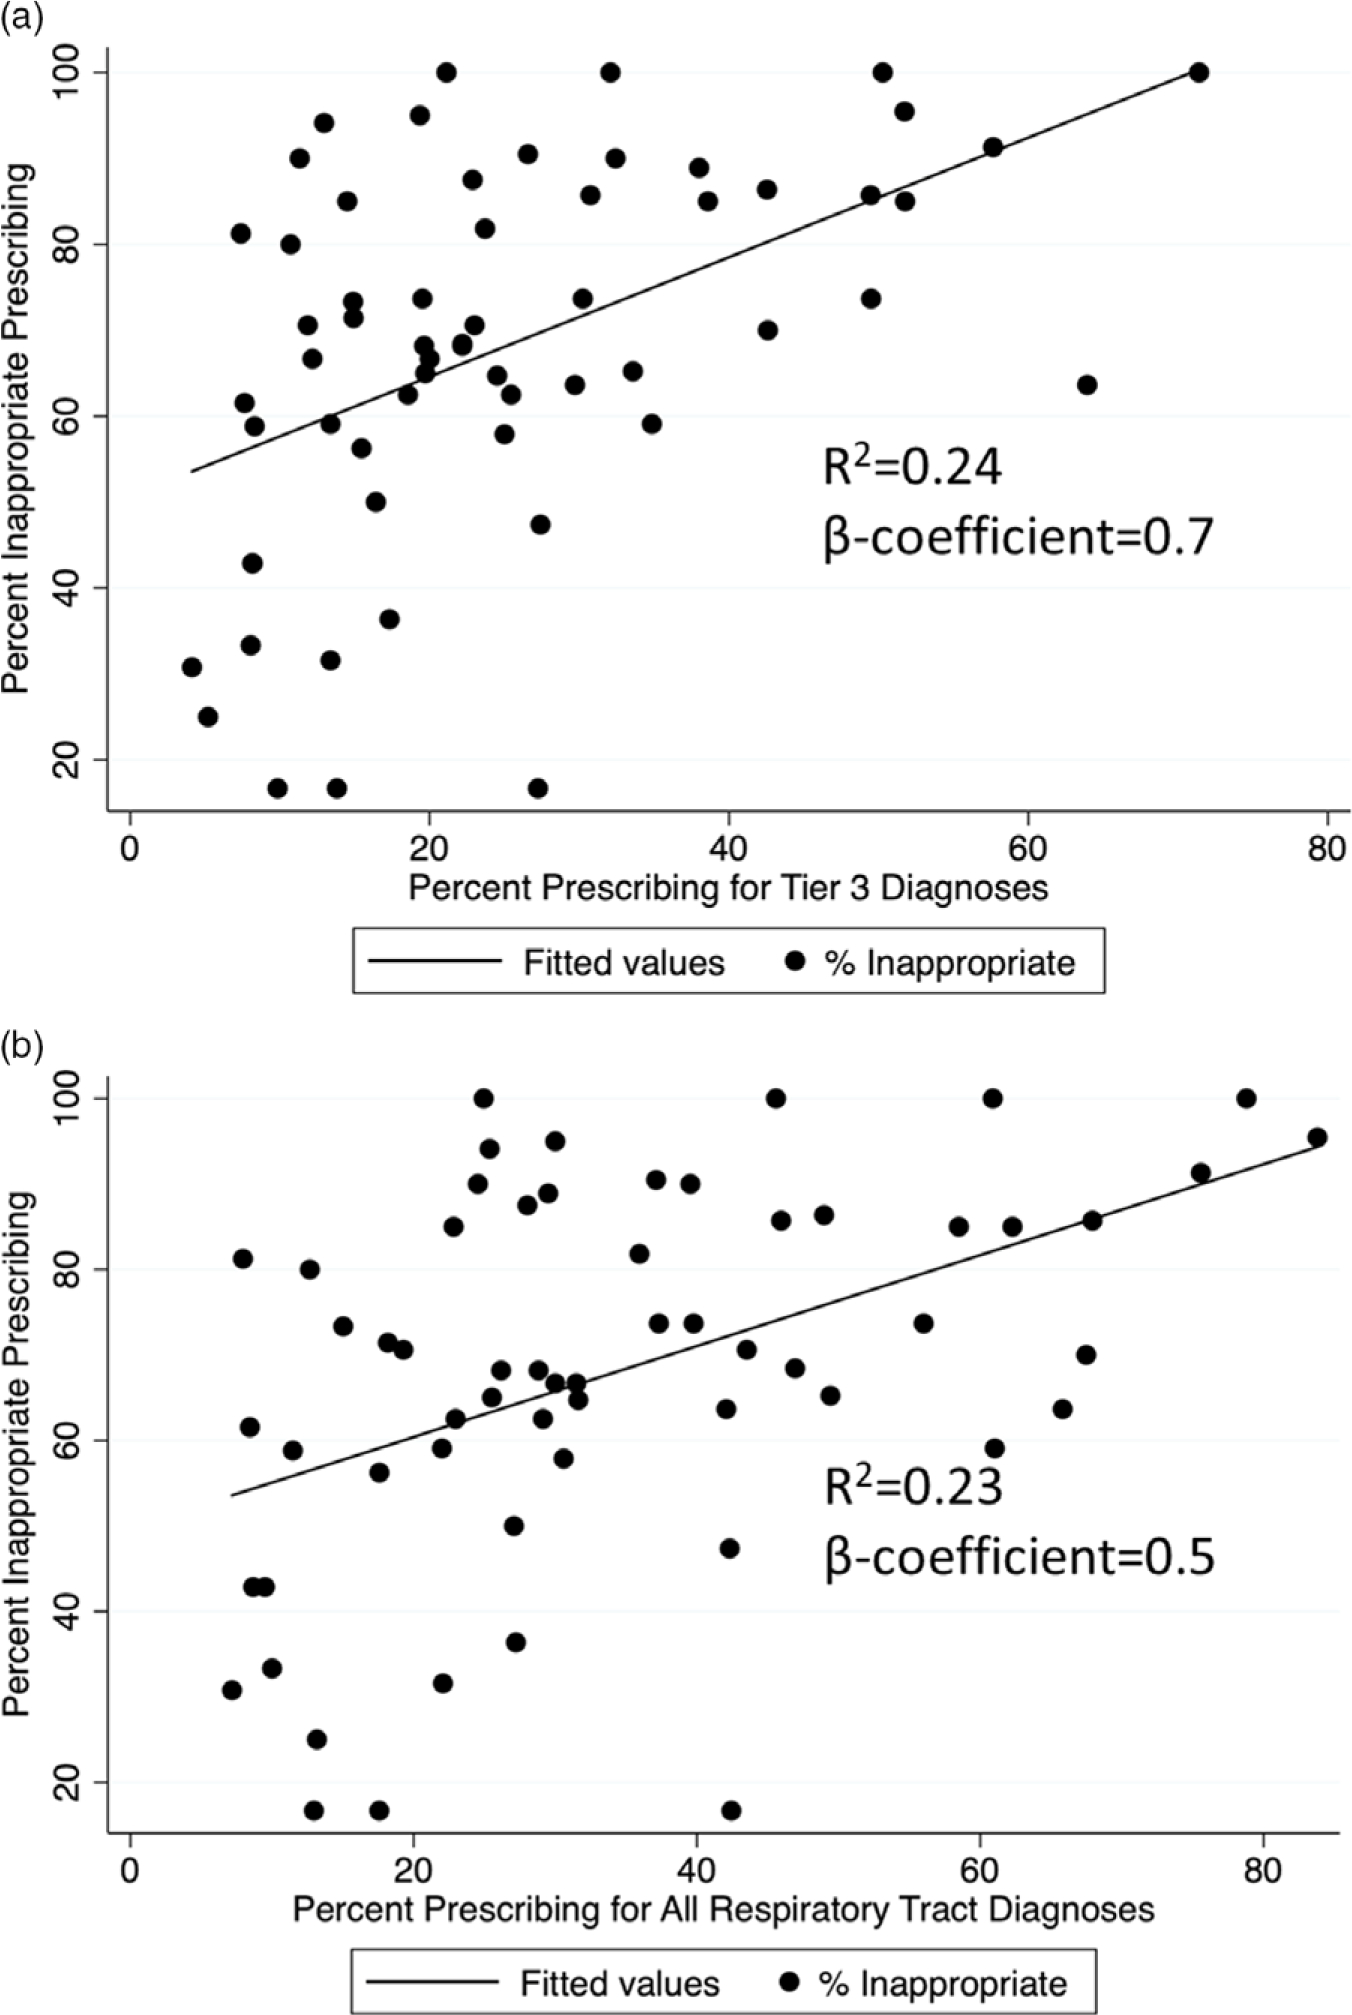
Proportion of inappropriate prescribing and association with (A) percentage prescribing for tier 3 diagnosis visits and (B) percentage prescribing for all respiratory tract diagnosis (RTD) visits.
Notably, univariate analysis showed a nonsignificant negative association between a provider’s mean CCI and that provider’s proportion of inappropriate prescribing. Incorporating CCI in multivariate analyses did demonstrate a modest improvement in the models (Supplementary Table 3 online). For instance, incorporating CCI in a multivariate model with proportion of prescribing for tier 3 RTDs demonstrated an increase in R2 over the univariate analysis of proportion of prescribing for tier 3 RTDs (0.32 vs 0.24). However, we detected a significant association between CCI and inappropriateness in the multivariate models only when CCI was combined with proportion of prescribing for tier 3 RTDs and not when it was combined with other RTD metrics.
In a post hoc analysis, providers with lower mean CCI tended to have training in family medicine rather than internal medicine (mean CCI, 4.1 vs 5.2; P < .01) and to be APPs rather than physicians (mean CCI, 4.7 vs 5.1; P = .02). Other provider characteristics were not associated with significant differences in CCI.
Discussion
Based on national prescribing trends, outpatient antibiotic stewardship programs should prioritize interventions targeting inappropriate prescribing for RTDs. Developing meaningful and validated prescribing metrics has the potential to decrease inappropriate antibiotic use through benchmarking of providers and to facilitate tracking of antibiotic use by healthcare systems, health plans, and public health agencies. This practice of auditing can be used on a clinician or institution level to highlight patterns in prescribing, to guide stewardship interventions, and to assess the impact of interventions. However, it is not practical to perform retrospective medical record reviews to audit prescribers. In this study, we sought to determine which RTD metrics that are accessible from administrative data were associated with inappropriate antibiotic prescribing using manual chart review.
The RTD metrics with the strongest association with inappropriate antibiotic prescribing were proportion of prescribing for office visits in which a tier 3 RTD was coded and proportion of prescribing for office visits in which any RTD was coded. Adding CCI to a multivariate model with each of these metrics to adjust for chronic comorbidities yielded a modest improvement compared to each metric alone. CCI had a negative association with inappropriate prescribing. In other words, primary care providers who cared for patients with lower mean CCI tended to prescribe antibiotics more inappropriately. The original intention of including CCI was to adjust for the potential of higher antibiotic utilization by providers with patients with higher CCIs. However, we detected a trend toward lower utilization by these providers.
This finding between CCI and inappropriate prescribing may have been confounded by provider characteristics. In a post hoc analysis discussed previously, providers with lower mean CCI tended to have training in family medicine as opposed to internal medicine and to be APPs as opposed to physicians, both of which factors were associated with higher rates of inappropriate prescribing. Further supporting this hypothesis that the relationship between CCI and antibiotic prescribing may be a result of confounding, prior studies have demonstrated that variation in antibiotic prescribing is not explained by differences in comorbidities of individual patients.14 Therefore, antibiotic stewardship programs may wish to report RTD metrics that are not adjusted by CCI for the following reasons: (1) adjusting for CCI is associated with only a modest improvement in models; (2) higher CCI is actually associated with more appropriate prescribing; (3) the association between CCI and appropriateness may be a result of confounding; and (4) calculating mean CCI by provider on an ongoing basis is time intensive.
Given that providers may attempt to circumvent antibiotic prescribing audits by inappropriately shifting ICD-10-CM codes to tier 1 or tier 2 RTDs, stewardship personnel should consider reporting both proportion of prescribing for office visits with tier 3 diagnoses and proportion of prescribing for office visits with any RTD to capture shifts in diagnostic coding.15 Using both metrics could detect and possibly minimize shifting of diagnostic codes that could occur during an audit and feedback intervention. For example, providers could shift diagnostic coding from bronchitis (tier 3 diagnosis) to pneumonia (tier 1 diagnosis) to justify prescribing an antibiotic. If this practice did occur, monitoring both metrics would allow the stewardship team to detect coding shifts because the proportion of prescribing for tier 3 diagnoses would change, but not prescribing for all RTDs because bronchitis and pneumonia would both be captured in the latter diagnostic grouping. However, more study is required to evaluate these metrics in the setting of audit and feedback and to understand provider perceptions of these metrics.
Notably, we detected considerable seasonable variation not only in total antibiotic prescribing but also in proportion of antibiotic prescribing for some RTD metrics, including prescribing for office visits in which any RTD was coded. Therefore, in fall and winter months not only was the number of antibiotics higher, but the proportion of antibiotic prescribing per office visit was also higher. Seasonal variation in prescribing for RTDs has been noted in prior studies as well.16–19 In a post hoc analysis of inappropriateness by time of year discussed previously, fall and winter months were associated with higher proportion of inappropriate prescribing compared to spring and summer months. More study needs to be performed to understand the drivers of this seasonal variation; however, this finding suggests that, at least in part, the increased antibiotic prescribing for RTDs in fall and winter months may be related to an increase inappropriate antibiotic prescribing during these months.
Macrolides made up the greatest proportion of antibiotic prescriptions for RTDs (41%), followed by β-lactams (38%) and fluoroquinolones (12%). Although we did not evaluate the appropriateness of antibiotic choice in this study, the high frequency of antibiotic prescribing with macrolides and fluoroquinolones could indicate high rates of inappropriate antibiotic choice because the high rates of inappropriate use of these agents in RTDs is well documented.20 However, additional study is warranted to evaluate appropriateness of antibiotic choice.
Our findings also suggest that APPs, family medicine providers, clinicians in nonteaching practices, clinicians in nonurban practices, and clinicians who are newer to practice have higher proportion of inappropriate antibiotic prescribing compared to physicians, internal medicine providers, clinicians in teaching practices, clinicians in urban practices, and clinicians who have been in practice longer, respectively. Prior studies have identified provider demographics to be associated with higher proportion of antibiotic prescribing or with surrogate metrics of inappropriateness, including female gender (compared to male), APP (compared to physician), family medicine specialty (compared to pediatrician and internal medicine), older age (compared to younger), nonurban practice setting (compared to urban), and southern United States geographic region (compared to western).21–33
All of the characteristics that could be assessed in this study had similar associations to prior studies except for time in practice. In this study, less time in practice was associated with a higher proportion of inappropriate antibiotic prescribing, whereas in other studies older providers were associated with higher proportion of inappropriate antibiotic prescribing. This difference could have resulted from assessing different infectious conditions or different practice settings. The association with time in practice for physicians may not be reproducible and requires further study. Likewise, more study is needed to understand how provider demographic characteristics affect antibiotic decision making and whether targeted interventions that address these characteristics are beneficial.
This study has several limitations. First, it was a retrospective single health-system study, which could limit the generalizability of results. Second, RTD metrics were based on diagnostic codes. Although, the determination of appropriateness was based on manual chart review by infectious diseases physicians, the validity of these RTD metrics depends on providers choosing ICD-10-CM diagnostic codes that accurately capture the clinical scenario, which may not always be the case. Third, in determination of association of provider demographic characteristics with appropriate prescribing, the small number of providers in the random subset precluded multivariate analysis and exploration of association of different provider characteristics with each other.
In conclusion, RTD metrics most strongly associated with inappropriate antibiotic prescribing for RTDs were proportion of prescribing for office visits in which a tier 3 RTD was coded and proportion of prescribing for office visits in which any RTD was coded. Antibiotic stewardship programs may be able to utilize these metrics to provide periodic reporting, benchmarking, or academic detailing to improve antibiotic prescribing for RTDs. Future study should focus on understanding provider perceptions of these RTD metrics and outcomes following implementation of these metrics for the purposes of audit and feedback.
Supplementary Material
Acknowledgments.
The authors would like to acknowledge the Antimicrobial Resistance and Healthcare Epidemiology Study Collaborative (ARES) at the University of Pennsylvania for expertise in study design and data analytics.
Financial support.
This research was supported by a CDC Cooperative Agreement (FOA no. CK16-004) from the Epicenters for the Prevention of Healthcare Associated Infections.
Footnotes
Conflicts of interest. No authors have conflicts of interest to report.
Supplementary material. To view supplementary material for this article, please visit https://doi.org/10.1017/ice.2021.44
References
- 1.Centers for Disease Control and Prevention. 2019 Antimicrobial resistance threats report. https://www.cdc.gov/drugresistance/biggest-threats.html. Accessed September 24, 2020.
- 2.Suda KJ, Hicks LA, Roberts RM, et al. A national evaluation of antibiotic expenditures by healthcare setting in the United States, 2009. J Antimicrob Chemother 2013;68:715–718. [DOI] [PubMed] [Google Scholar]
- 3.Fleming-Dutra KE, Hersh AL, Shapiro DJ, et al. Prevalence of inappropriate antibiotic prescriptions among US ambulatory care visits, 2010–2011. JAMA 2016;315:1864–1873. [DOI] [PubMed] [Google Scholar]
- 4.Gonzales R, Malone DC, Maselli JH, Sande MA. Excessive antibiotic use for acute respiratory infections in the United States. Clin Infect Dis 2001;33:757–762. [DOI] [PubMed] [Google Scholar]
- 5.Sanchez GV, Fleming-Dutra KE, Roberts RM, Hicks LA. Core elements of outpatient antibiotic stewardship. MMWR Recomm Rep 2016;65(RR-6):1–12. [DOI] [PubMed] [Google Scholar]
- 6.Mandell LA, Wunderink RG, Anzueto A, et al. Infectious Diseases Society of America/American Thoracic Society consensus guidelines on the management of community-acquired pneumonia in adults. Clin Infect Dis 2007;44 suppl 2:S27–S72. [DOI] [PMC free article] [PubMed] [Google Scholar]
- 7.Chow AW, Benninger MS, Brook I, et al. IDSA clinical practice guideline for acute bacterial rhinosinusitis in children and adults. Clin Infect Dis 2012;54(8):e72–e112. [DOI] [PubMed] [Google Scholar]
- 8.Shulman ST, Bisno AL, Clegg HW, et al. Clinical practice guideline for the diagnosis and management of group A streptococcal pharyngitis: 2012 update by the Infectious Diseases Society of America. Clin Infect Dis 2012;55(10):e86–e102. [DOI] [PMC free article] [PubMed] [Google Scholar]
- 9.Lieberthal AS, Carroll AE, Chonmaitree T, et al. The diagnosis and management of acute otitis media. Pediatrics 2013;131(3):e964–e999. [DOI] [PubMed] [Google Scholar]
- 10.Pertussis (whooping cough) surveillance and reporting. Centers for Disease Control and Prevention website. http://www.cdc.gov/pertussis/surv-reporting.html. Accessed September 24, 2020. [Google Scholar]
- 11.Global strategy for the diagnosis, management, and prevention of chronic obstructive pulmonary disease 2018. Global Initiative for Chronic Obstructive Lung Disease (GOLD) website. https://goldcopd.org/wp-content/uploads/2017/11/GOLD-2018-v6.0-FINAL-revised-20-Nov_WMS.pdf. Accessed September 24, 2020. [Google Scholar]
- 12.Harris PA, Taylor R, Thielke R, et al. Research electronic data capture (REDCap)—a metadata-driven methodology and workflow process for providing translational research informatics support. J Biomed Inform 2009;42:377–381. [DOI] [PMC free article] [PubMed] [Google Scholar]
- 13.Quan H, Sundararajan V, Halfon P, et al. Coding algorithms for defining comorbidities in ICD-9-CM and ICD-10 administrative data. Med Care 2005;43:1130–1139. [DOI] [PubMed] [Google Scholar]
- 14.Pouwels KB, Dolk CK, Smith DRM, et al. Explaining variation in antibiotic prescribing between general practices in the UK. J Antimicrob Agents Chemother 2018;73:ii27–ii35. [DOI] [PMC free article] [PubMed] [Google Scholar]
- 15.Calfee DP, Brooks J, Zirk NM, et al. A pseudo-outbreak of nosocomial infections associated with the introduction of an antibiotic management programme. J Hosp Infect 2003;55:26–32. [DOI] [PubMed] [Google Scholar]
- 16.Ferech M, Coenen S, Malhotra-Kumar S, et al. European Surveillance of Antimicrobial Consumption (ESAC): outpatient antibiotic use in Europe. J Antimicrob Chemother 2006;58:401–407. [DOI] [PubMed] [Google Scholar]
- 17.Durkin MJ, Jafarzadeh SR, Hsueh K, et al. Outpatient antibiotic prescription trends in the United States: a national cohort study. Infect Control Hosp Epidemiol 2018;39:584–589. [DOI] [PMC free article] [PubMed] [Google Scholar]
- 18.Yan J, Hawes L, Turner L, et al. Antimicrobial prescribing for children in primary care. J Paedriatr Child Health 2019;55:54–58. [DOI] [PubMed] [Google Scholar]
- 19.Curtis HJ, Walker AJ, Mahtani KR, Goldacre B. Time trends and geographical variation in prescribing of antibiotics in England 1998–2017. J Antimicrob Chemother 2019;74:242–250. [DOI] [PubMed] [Google Scholar]
- 20.Suda KJ, Hicks LA, Roberts RM, et al. Trends and seasonal variation in outpatient antibiotic prescription rates in the United States, 2006 to 2010. Antimicrob Agents Chemother 2014;58:2763–2766. [DOI] [PMC free article] [PubMed] [Google Scholar]
- 21.Saliba-Gustafsson EA, Hampton AD, Zarb P, et al. Factors associated with antibiotic prescribing in patients with acute respiratory tract complaints in Malta: a 1-year repeated cross-sectional surveillance study. BMJ Open 2019;9(12):e032704. [DOI] [PMC free article] [PubMed] [Google Scholar]
- 22.Lee TH, Wong JG, Lye DC, et al. Medical and psychosocial factors associated with antibiotic prescribing in primary care: survey questionnaire and factor analysis. Br J Gen Pract 2017;67:e168–e177. [DOI] [PMC free article] [PubMed] [Google Scholar]
- 23.Schmidt ML, Spender MD, Davidson LE. Patient, provider, and practice characteristics associated with inappropriate antimicrobial prescribing in ambulatory practices. Infect Control Hosp Epidemiol 2018;39:307–315. [DOI] [PubMed] [Google Scholar]
- 24.Li D, Conson M, Kim N, et al. Patient and provider characteristics and outcomes associated with outpatient antibiotic overuse in acute adult bronchitis. Proc (Bayl Univ Med Cent) 2020;33:183–187. [DOI] [PMC free article] [PubMed] [Google Scholar]
- 25.Gonzales R, Steiner JF, Sande MA. Antibiotic prescribing for adults with colds, upper respiratory tract infections, and bronchitis by ambulatory care physicians. JAMA 1997;278:901–904. [PubMed] [Google Scholar]
- 26.Nyquist AC, Gonzales R, Steiner JF, Sande MA. Antibiotic prescribing for children with colds, upper respiratory tract infections, and bronchitis. JAMA 1998;279:875–877. [DOI] [PubMed] [Google Scholar]
- 27.Katz SE, Staub M, Ouedraogo Y, et al. Population-based assessment of patient and provider characteristics influencing pediatric outpatient antibiotic use in a high antibiotic-prescribing state. Infect Control Hosp Epidemiol 2020;41:331–336. [DOI] [PMC free article] [PubMed] [Google Scholar]
- 28.Hicks LA, Bartoces MG, Roberts RM, et al. US outpatient antibiotic prescribing variation according to geography, patient population, and provider specialty in 2011. Clin Infect Dis 2015;60:1308–1316. [DOI] [PubMed] [Google Scholar]
- 29.Fleming-Dutra KE, Demirjian A, Bartoces M, et al. Variations in antibiotic and azithromycin prescribing for children by geography and specialty—United States, 2013. Pediatr Infect Dis J 2018;37:52–58. [DOI] [PMC free article] [PubMed] [Google Scholar]
- 30.Kabbani S, Palms D, Bartoces M, et al. Outpatient antibiotic prescribing for older adults in the United States: 2011 to 2014. J Am Geriatr Soc 2018;66:1998–2002. [DOI] [PMC free article] [PubMed] [Google Scholar]
- 31.Staub M, Ouedraogo Y, Evans CD, et al. Analysis of a high-prescribing state’s 2016 outpatient antibiotic prescriptions: implications for outpatient antimicrobial stewardship interventions. Infect Control Hosp Epidemiol 2020;41:135–142. [DOI] [PMC free article] [PubMed] [Google Scholar]
- 32.Frost HM, McLean HQ, Chow BDW. Variability in antibiotic prescribing for upper respiratory illnesses by provider specialty. J Pediatr 2018;203:76–85.e8. [DOI] [PubMed] [Google Scholar]
- 33.Ference EH, Min JY, Chandra RK, et al. Antibiotic prescribing by physicians versus nurse practitioners for pediatric upper respiratory infections. Ann Otol Rhinol Laryngol 2016;125:982–991. [DOI] [PubMed] [Google Scholar]
Associated Data
This section collects any data citations, data availability statements, or supplementary materials included in this article.