

Abstract
Limited research has evaluated the mental health effects during compounding disasters (e.g., a hurricane occurring during a pandemic), and few studies have examined post‐disaster mental health with alternative data sources like crisis text lines. This study examined changes in crisis help‐seeking for individuals in Louisiana, USA, before and after Hurricane Ida (2021), a storm that co‐occurred during the COVID‐19 pandemic. An interrupted time series analysis and difference‐in‐difference analysis for single and multiple group comparisons were used to examine pre‐and post‐changes in crisis text volume (i.e., any crisis text, substance use, thoughts of suicide, stress/anxiety, and bereavement) among help‐seeking individuals in communities that received US Federal Emergency Management Agency individual and public assistance following a presidential disaster declaration. Results showed a significant increase in crisis texts for any reason, thoughts of suicide, stress/anxiety, and bereavement in the four‐week, three‐month, and four‐month post‐impact period. Findings highlight the need for more mental health support for residents directly impacted by disasters like Hurricane Ida.
Keywords: Climate disaster, mental health, Crisis Text Line, ARIMA, difference‐in‐difference, interrupted time series analysis, thoughts of suicide, stress/anxiety, substance use, bereavement
Key Points
This study examines changes in crisis help‐seeking among those exposed to Hurricane Ida in Louisiana, USA
Ida led to a sustained increase in stress/anxiety, thoughts of suicide, and bereavement
Findings support the need for crisis text lines in post‐disaster mental health support and surveillance efforts
1. Introduction
A robust evidence base shows that as climate change continues, there will be an increase in the occurrence of intense tropical cyclones like Hurricane Ida (Kossin et al., 2020). Since the early 1980s, the intensity, frequency, and duration of North Atlantic hurricanes, as well as the frequency of the strongest hurricanes have all increased (Kossin et al., 2010; Melillo et al., 2014; Walsh et al., 2014). A recent NOAA report concludes that tropical cyclones' intensity and associated rainfall are likely to increase during the 21st century due to anthropogenic climate change, putting US populations at greater risk for hurricane impacts (Knutson et al., 2019). Direct exposure to climate disaster events yields an increase in mental health consequences in the impacted populations, including anxiety (Costa et al., 2009; Weems et al., 2016), suicidal ideation (Fitzpatrick & Spialek, 2020; Kessler, 2006; Runkle, Michael, et al., 2021; Runkle, Sugg, et al., 2021), bereavement (Cunsolo & Ellis, 2018; Shear et al., 2011), and substance use (Rowe & Arakida, 2008).
The hurricane season of 2020 and 2021 was unprecedented for those tropical cyclones that co‐occurred with the COVID‐19 pandemic, with COVID‐19 cases in the U.S as high as 39.6 million and deaths reaching 650,000 as of August 2021. The pandemic co‐occurred with several climate‐driven disasters in the U.S., including Hurricane Laura (2020), Western wildfires (2020), and Hurricane Ida (2021). This co‐occurrence can hamper hurricane preparedness and response, including evacuations and decision‐making (Collins et al., 2021; Pei et al., 2020).
To date, there is little known about the mental health impacts of concurrent disasters or disasters that co‐occur spatially and temporally, although researchers have highlighted the potential for more harmful and severe impacts (Quigley et al., 2020). Limited research on mental health events from climate disasters during the COVID‐19 pandemic has shown that the pandemic is the primary driver of crisis outcomes rather than large‐scale disasters like the 2020 Western US Wildfires (Sugg et al., 2021). There is a potential for intersecting health risks of the COVID‐19 pandemic and tropical cyclones, like Hurricane Ida, including the amplification of COVID‐19 infection rates, a reduction in COVID‐19 vaccination rates, and other adverse health effects related to direct exposure or cascading effects from hurricane damage (e.g., loss of power for the medically vulnerable or affordable housing) (Shulz et al., 2022). These additional direct and indirect health risks may also amplify adverse mental health outcomes for impacted populations.
This study aimed to evaluate pre‐ and post‐changes in crisis‐support‐seeking patterns among people impacted in Louisiana during and following Hurricane Ida in August 2021. Ida resulted in a loss of power for nearly 1 million Louisiana residents in the days following the storm and over 76 billion dollars in damage (Comstock, 2021). The events of Hurricane Ida also occurred during the COVID‐19 pandemic, which resulted in over 197,000 cases and 2,900 deaths in Louisiana from August to September 2021.
We hypothesize that the compounding event (defined as spatially and temporally co‐occurring extremes) of Hurricane Ida occurring during the COVID‐19 pandemic resulted in excess mental health burden for the directly impacted population in the acute impact phase (i.e., 4 months post‐disaster) (Singh et al., 2022). We further this aim by also exploring the effects of mental health across multiple temporal periods (e.g., 4‐week, 3‐month, and 4‐month). As methods are still evolving to examine the mental health impact of multiple disasters, we employed two separate quasi‐experimental designs, the difference‐in‐difference (DID) model and the interventional autoregressive integrated moving average (ARIMA) model, to study the association between Hurricane Ida and crisis response in the backdrop of elevated crisis response brought on by the pandemic. In the context of previous literature that focuses on the mental health and hurricane relationship before COVID‐19, our results will provide new knowledge on the association of crisis events from Hurricane Ida, a storm that co‐occurred with the pandemic.
2. Methods
2.1. Storm Impact on the Study Area
Hurricane Ida (26 August–3 September 2021) made landfall in the United States near Port Fourchon, Louisiana, as a Category 4 hurricane with maximum sustained winds of 150 mph. It became the second‐most damaging and intense hurricane to land in Louisiana, behind Hurricane Katrina (2005). The hurricane gained intensity in a very short period, around 24 hr, increasing from a Category 1 to a Category 4 storm as it moved into the Gulf of Mexico (NOAA, 2022). Hurricane Ida moved quickly over the state of Louisiana, but not before leaving 5–10 inches of rain across impacted areas, with some areas receiving as much as 15 inches of rain. There was heavy damage to the energy infrastructure across southern Louisiana, causing widespread, long‐duration power outages to millions of people across the state; additionally, wireless services were temporarily out because of the storm (Rossenthal, 2021). As a result of the rainfall, several levies were overtopped in Jefferson and Plaquemines Parish (Wetly, 2021). LA received a disaster declaration for Ida on 29 August 2021, whereby every county in the state was eligible to receive public assistance and the counties in the lower Capital (Region 2), South Central (Region 3), Northshore (Region 9), and Greater New Orleans (Region 1) areas were eligible for public and individual assistance from FEMA. The NOAA National Centers for Environmental Information (NCEI) estimated damages from wind and water during Ida resulted in $76.5 billion in losses (e.g., societal disruptions, property damage) and 96 deaths, with 26 of those deaths in Louisiana (Louisiana Department of Health, 2021; National Centers for Environmental Information, 2022).
Concurrent events. At the time of Ida's landfall, COVID‐19 cases were on the decline following a surge in early August 2021. Still, at the time of the storm, inpatient hospitalizations for COVID‐19 were higher than at any other point in the pandemic (Treisman, 2021). COVID‐19 response efforts were slowed due to the evacuation of healthcare facilities following storm damage.
2.2. Crisis‐Text Data
Anonymized data from Crisis Text Line (CTL), a non‐profit organization that provides free, 24/7 crisis counseling services via text messaging across the US, was used to study crisis help‐seeking patterns. This data has previously been used to understand the relationship between crisis‐help seeking in response to temperature extremes (Sugg et al., 2019), wildfires (Sugg et al., 2022), Hurricane Florence (Runkle, Michael, et al., 2021; Runkle, Sugg, et al., 2021), and the COVID‐19 pandemic (Runkle, Michael, et al., 2021; Runkle, Sugg, et al., 2021; Sugg et al., 2021). In addition, CTL data has been shown to mirror the response pattern of emergency room data following a large‐scale hurricane (Runkle, Michael, et al., 2021; Runkle, Sugg, et al., 2021).
When using CTL, an individual is connected with a trained volunteer Crisis Counselor via SMS text message. Immediately following each conversation, CTL asks its volunteer counselors to complete a report to identify common issues discussed during the conversations. Crisis issues are identified as a bivariate response (yes/no). Approximately 95% of CTL conversations have crisis counselor reports. A conversation can be labeled with multiple “issues tags.” The primary issue tags used in this analysis were the following bivariate (yes/no) crisis concerns: substance use, thoughts of suicide, stress/anxiety, and bereavement. We included only mental health‐related crisis concerns and opted to exclude crisis concerns not related to disaster impacts on mental health (e.g., eating disorders, racism, and sexual abuse) (e.g., Runkle, Michael, et al., 2021; Runkle, Sugg, et al., 2021; Sugg et al., 2022).
Daily CTL conversation counts were aggregated for the five area codes of Louisiana for all of 2021; four of those represented the impacted area (i.e., hurricane‐exposed areas) based on FEMA designations for zip codes that received both public and individual assistance and were used as the focus for this study (i.e., 504, 985, 225, 337), while the fifth was used as the control (i.e., unexposed) group (i.e., 318) (Figure 1). The control group was restricted to Louisiana so that both impacted and control groups were under the same political structure and disaster support, which may change across state lines, given that disaster declarations are requested by the governor of the impacted state (Domingue & Emrich, 2019; Malmin, 2020; Schmidtlein et al., 2008). All CTL data used in this study were anonymized and de‐identified, and daily text volumes for “texter issues” were aggregated to protect the privacy of CTL users. While data on demographic characteristics were available for a subset of approximately 20%–30% of the users; to ensure sufficient sample size we opted to not subset crisis texts to only those users who provided demographic data in our interrupted time series (ITS) and DID analyses.
Figure 1.
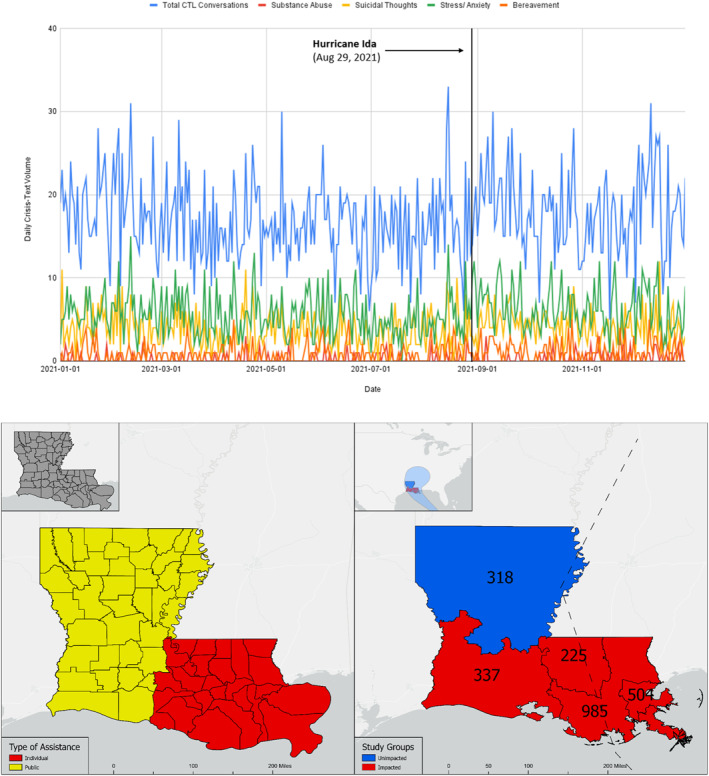
Daily crisis text volume time‐series for all CTL conversations in Louisiana, substance use, suicidal thoughts, stress/anxiety, and bereavement between 1 January 2021, and December 2021. On the left map figure are the Parishes and their level of assistance (FEMA, 2021). On the right map figure are the impacted area codes in red and control locations (i.e., non‐exposed) in blue. The path of Hurricane Ida's track is indicated by the black, dashed line.
2.3. Pre‐ and Post‐Hurricane Temporal Periods
The study period occurred from Jan 1 to 29 December 2021. The pre‐Ida period was defined as 1 January to 28 August 2021, and the post‐Ida period was 29 August to 29 December 2021. To evaluate the change in crisis text volume following Ida, we examined three different time periods, (a) the 4 weeks after the storm (29 August 2021, to 29 September 2021); (b) 3 months after the storm, (29 August 2021, to 29 November 2021); and (c) 4 months following the storm, (29 August 2021, to 29 December 2021). These three time periods were chosen as a secondary exploratory aim to investigate the post‐event timing of crisis outcomes. Our temporal periods build upon previous studies that investigate both the immediate impacts (less than 6 weeks) (Runkle, Michael, et al., 2021; Runkle, Sugg, et al., 2021) and the delayed impacts (3 and 4 months) (He et al., 2016; Kessler et al., 2008; Lieberman‐Cribbin et al., 2017). Additionally, time periods were selected to reflect the SAMHSA model, which provides a temporal framework for US stakeholders on the provision of behavioral health services in response to disasters (DeWolfe & Nordboe, 2000). In total, the time series included 363 days of crisis‐text observations, 240 days of pre‐Ida data, and 123 days of post‐Ida data.
2.4. Statistical Analysis
Descriptive statistics were performed to examine the mean daily CTL volume with a 95% confidence interval for each pre‐and post‐hurricane temporal period for the impacted and control groups. A paired t‐test (continuous data) and chi‐square test (categorical data) were used to determine whether the mean daily CTL text volume for each “texter issue” differed by the pre‐and post‐Ida period (α = 0.05) for each intervention group (i.e., impacted, control).
Our study leveraged Hurricane Ida as a natural experiment to understand the causal impact that climate disasters may have on population‐level mental health. To examine pre‐ and post‐changes in crisis concerns, we employed two distinct models: (a) the difference‐in‐difference (DID) and (b) interrupted time series (ITS) models.
2.4.1. Interrupted Time Series Analysis
We performed an interrupted time series (ITS) analysis to capture the immediate and gradual impact of crisis text volume for individuals in impacted Louisiana communities before and after Ida. AutoRegressive Integrated Moving Average (ARIMA) models were used to analyze daily CTL volume and address autocorrelation between daily time series for each crisis tag. The AR portion of the model predicts future values based on past values, whereas the MA term uses past forecasts to adjust future predictions (Schaffer et al., 2021). ARIMA models make very few assumptions and are a flexible class of time series models that allow for pre‐and post‐event hypothesis testing (Ho & Xie, 1998). We examined various ARIMA models, and the best fit was assessed by using a four‐step process: (a) evaluate the autocorrelation function (ACF) and partial autocorrelation function (PACF); (b) use an algorithm, auto.arima (Hyndman et al., 2022), to determine the ideal autoregressive terms (p), the number of nonseasonal differences needed for stationarity (d), and the number of lagged forecast errors in the prediction equation (q); (c) manually adjust the p, d, and q values to assess if another ideal combination exists for residual diagnostic tests like Ljung‐Box test; and finally 4) evaluate the Akaike Information Criterion (AIC) score to determine the most parsimonious and best‐fit model (one that explains the greatest amount of variation using the simplest model). Comparisons were made among the Step (i.e., a sudden, sustained change where the time series is shifted either up or down by a given value immediately following the intervention), Ramp (i.e., a change in slope that occurs immediately after the intervention), and Pulse (i.e., a sudden, temporary change i.e., observed for one or more time points immediately after the intervention and then returns to baseline level) functions to determine if these contributed to better results (Schaffer et al., 2021). The base ARIMA (1,0,1) was shown to have the lowest AIC score and was determined to be the best fit for predicting future text volume 4 months after Ida and therefore did not include step, ramp, or pulse functions. This ARIMA model was then applied to all temporal periods and scenarios in the study. Forecasting was used in the ARIMA model to generate predicted text volume for the time series based on pre‐Ida data to compare the actual versus predicted volume of daily text in the post‐Ida period. Analysis was done in R packages astsa (David Stoffer, 2021), forecast (Hyndman et al., 2022), and stats (R Core Team, 2021) using R version 4.2.0 (2022‐04‐22).
2.4.2. Comparative—ITS
One disadvantage of the use of interventional ARIMA in ITS is the inability to differentiate changes originating from one treatment when co‐occurring within another (e.g., Hurricane Ida within the same time as COVID‐19) (Sugg et al., 2021). Thus, to minimize the potential confounding of co‐occurring events, we also included control (i.e., counterfactual) locations where Hurricane Ida did not impact populations in the same manner (Turner et al., 2020). ARIMA (1,0,1) was also computed on locations not impacted by Hurricane Ida. This comparative ITS design is typically not done in other ITS analysis, with as few as one‐fourth of ITS studies including some form of external control (Turner et al., 2020). Comparative ARIMA models were constructed for the control region, and forecasted results were compared to observed values (α = 0.10).
2.4.3. Difference‐In‐Difference (DID) Analysis
Difference‐in‐difference (DID) is a separate quasi‐experimental design performed for analyses of longitudinal data on treatment and control groups to obtain an appropriate counterfactual to estimate the causal effect of an intervention on long‐term health outcomes for the impacted population compared to the control (Cao & Song, 2011; Hersche & Moor, 2020; Wing et al., 2018). DID is typically used to estimate the effect of a specific intervention or treatment, such as a new policy, or drug implementation, by differencing the changes in outcomes over time between the population as impacted (intervention group) and the control group (Stuart et al., 2014). Unlike the ARIMA analysis, DID allows for the inclusion of control group(s) (i.e., counterfactual model) (Callaway & Sant'Anna, 2021a).
For this analysis, CTL data were restricted to area codes that were exposed and unexposed (control) to determine the first difference. A second difference examined the temporal pre‐/post‐comparator following the timeframe of the hurricane event (post‐event) compared to the time frame before the hurricane event (pre‐event) (Babu & Hallam, 2017). We used the Callaway and Sant'Anna difference‐in‐difference approach with multiple time periods because, unlike the traditional DID method, this method allows for multiple staggered time periods to be examined at once (Callaway & Sant'Anna, 2021a). In our study, the Average Treatment Effect on Treated (ATT) was constructed for each crisis concern separately. After constructing the ATT variable, which contained all the results for group‐time average treatment effects, the Aggregated Group‐Time Average Treatment Effects (which aggregates each variable into a smaller number of parameters) was performed to allow for multiple time periods post‐treatment (i.e., 4 weeks, 3 months, and 4 months) to be observed. Analysis was done in the R package did (Callaway &Sant'Anna, 2021b) using R version 4.2.0 (2022‐04‐22). This study was exempt from the Appalachian State University's IRB review board (protocol#: 23563).
3. Results
3.1. Descriptive Statistics of Study Population
Figure 1 shows the daily CTL text volume for each outcome for the time series (01 January–29 December 2021). Daily total CTL conversations peaked 12 and 21 days after the storm, while thoughts of suicide peaked around days 60 and 110, substance use peaked on day 9, and again around day 74, stress/anxiety peaked around days 2 and 17, and bereavement peaked on day 59 post‐Ida.
Table 1 shows the demographic characteristics and crisis issues for the impacted and control locations pre‐ and post‐Hurricane Ida. Crisis texters in LA who reported demographic information were generally female, LGBTQ+, and White. Most of the users are young (under the age of 24) for both the control and impacted regions, 16.4% and 18.1%, respectively. In impacted areas, the proportion of texters who reported thoughts of suicide and stress/anxiety increased in the post‐impact relative to the pre‐impact period. Significant increases in CTL use were observed following Hurricane Ida for genders non‐conforming texters in both impact and control regions. In general, there was a significant increase in CTL users who did not complete the survey in the post‐Ida period, which limited the ability to investigate the demographics in detail.
Table 1.
Summary of Daily Crisis‐Text Volume and Demographics of Louisiana Impacted and Control Communities Before and After Hurricane Ida, 2021
| Impacted group | Control group | ||||||
|---|---|---|---|---|---|---|---|
| Demographics | Pre‐Ida | Post‐Ida | p‐value | Pre‐Ida | Post‐Ida | p‐value | |
| n = 4,067 | n = 2215 | n = 1,035 | n = 588 | ||||
| Gender (%) | Female | 933 (22.9) | 393 (17.7) | <0.001 | 229 (22.1) | 111 (18.8) | 0.013 |
| Male | 171 (4.2) | 57 (2.6) | – | 21 (2.0) | 12 (2.0) | – | |
| Nonconforming | 194 (4.8) | 109 (4.9) | – | 21 (2.0) | 22 (3.7) | – | |
| No Answer | 2769 (68.1) | 1,656 (74.8) | – | 763 (73.8) | 444 (75.4) | – | |
| Race and Ethnicity (%) | Asian | 10 (0.2) | 1 (0.0) | 0.001 | 8 (0.8) | 4 (0.7) | 0.1 |
| Black | 321 (7.9) | 144 (6.5) | – | 65 (6.3) | 37 (6.3) | – | |
| White | 518 (12.7) | 219 (9.9) | – | 133 (12.9) | 63 (10.7) | – | |
| Hispanic | 92 (2.3) | 44 (2.0) | – | 5 (0.5) | 1 (0.2) | – | |
| Indigenous American | 14 (0.3) | 6 (0.3) | – | 5 (0.5) | 6 (1.0) | – | |
| Middle Eastern | 3 (0.1) | 0 (0.0) | – | 0 (0.0) | 0 (0.0) | – | |
| Other Mixed Race | 238 (5.9) | 121 (5.5) | – | 19 (1.8) | 7 (1.2) | – | |
| No Answer | 2871 (70.6) | 1,680 (75.8) | – | 799 (76.2) | 471 (80.0) | 0.004 | |
| Sexual Identity (%) | LGBTQ+ | 530 (13.0) | 238 (10.7) | <0.001 | 113 (10.9) | 41 (7.0) | – |
| Straight | 619 (15.2) | 217 (9.8) | – | 147 (14.2) | 88 (14.9) | – | |
| No Answer | 2918 (71.7) | 1,760 (79.5) | – | 774 (74.9) | 460 (78.1) | ||
| Age (%) | 13 or younger | 113 (2.8) | 62 (2.8) | 0.002 | 54 (5.2) | 19 (3.2) | 0.032 |
| 14–17 | 417 (10.3) | 178 (8.0) | – | 58 (5.6) | 49 (8.3) | – | |
| 18–24 | 241 (5.9) | 124 (5.6) | – | 66 (6.4) | 39 (6.6) | – | |
| 25–34 | 254 (6.2) | 102 (4.6) | – | 45 (4.4) | 29 (4.9) | – | |
| 35–44 | 49 (1.2) | 45 (2.0) | – | 11 (1.1) | 6 (1.0) | – | |
| 45–54 | 52 (1.3) | 38 (1.7) | – | 12 (1.2) | 13 (2.2) | – | |
| 55–64 | 10 (0.2) | 5 (0.2) | – | 2 (0.2) | 1 (0.2) | – | |
| 65+ | 8 (0.2) | 4 (0.2) | – | 0 (0.0) | 0 (0.0) | – | |
| No Answer | 2923 (71.9) | 1,657 (74.8) | – | 786 (76.1) | 433 (73.5) | ||
Note. Pre‐Ida: 1 January–28 August 2021; Post‐Ida: 29 August–29 December 2021 (4‐month time period). The values in parentheses represent the percentage of conversations where that issue was flagged.
Table 2 demonstrates the mean text volume from pre‐Ida (baseline) compared to the three post‐intervention periods using paired t‐tests: 4 weeks, 3 months, and 4 months post‐storm. We observed significantly more crisis text frequency for all texts (20.41 daily conversations), thoughts of suicide (5 daily conversations), stress/anxiety (7.56 daily conversations), as well as bereavement (1.56 daily conversations) in the 4 weeks after Ida compared to the pre‐event period. Daily text volume for thoughts of suicide (4.37 daily conversations), stress/anxiety (6.32 daily conversations) were significantly higher in the first 3 months after the storm compared to the pre‐hurricane period. Daily text volume for any text (18.02 daily conversations), substance use (0.45 daily conversations), thoughts of suicide (4.29 daily conversations), stress/anxiety (6.3 daily conversations), and bereavement (1.23 daily conversations) were significantly higher in 4 months following the storm compared to the pre‐hurricane period.
Table 2.
Summary of Daily Crisis Text From Impacted Communities in Louisiana Pre‐ and Post‐Hurricane Ida, 2021
| Daily text volume | Pre‐Ida mean | Post‐Ida mean | ||
|---|---|---|---|---|
| 4 weeks | 3 months | 4 months | ||
| (95%CI) | (95%CI) | (95%CI) | (95%CI) | |
| (1 January–28 August) | (29 August–26 September) | (29 August–29 November) | (29 August–29 December) | |
| Any Text | 16.81 | 20.41 a | 17.6 | 18.02 b |
| (12.08, 21.54) | (15.97, 24.85) | (13.0, 22.2) | (13.01, 23.03) | |
| Substance Use | 0.3 | 0.26 | 0.41 | 0.45 b |
| (−0.28, 0.88) | (−0.4, 0.92) | (0.32, 1.14) | (−0.28, 1.18) | |
| Thoughts of Suicide | 3.7 | 5 c | 4.37 c | 4.29 b |
| (1.52, 8.88) | (3.31, 6.69) | (2.65, 6.09) | (2.33, 6.25) | |
| Stress and Anxiety | 5.56 | 7.56 a | 6.32 b | 6.3 b |
| (2.92, 8.20) | (4.97, 10.15) | (3.75, 8.89) | (3.62, 8.98) | |
| Bereavement | 0.92 | 1.56 c | 1.18 | 1.23 b |
| (−0.16, 2.0) | (0.51, 2.61) | (−0.02, 2.38) | (0.01, 2.25) | |
p‐value < 0.001.
p‐value < 0.05.
p‐value < 0.01.
3.2. ARIMA Models for Crisis Text Line Volume in Impacted Communities Post‐Ida
The base ARIMA (1,0,1) model was the best‐fit model to examine the pre‐/post Hurricane Ida change in daily crisis text counts and was applied to all crisis outcomes (e.g., stress and anxiety, substance use). No seasonal lag was observed in daily crisis text volume within the period examined, and seasonality was not adjusted for in the models.
Table 3 shows the estimated conversation volume for each hurricane post‐event period: 4 weeks, 3 months, and 4 months. The model predicted an expected increase of 3%, 0%, 3.5%, 4.1%, and 6.5% in average conversation volume per day for any reason, substance use, thoughts of suicide, stress/anxiety, and bereavement, respectively, in the 4 week period following Hurricane Ida. In the 3 months post‐impact period, the average crisis text volume per day was predicted to increase by 1%, 10%, 4.9%, 3.6%, and 7.6% for any reason, substance use, thoughts of suicide, stress/anxiety, and bereavement, respectively, compared to the pre‐Ida volume. In the 4 months post‐impact period, the conversation volume per day was predicted to increase by 2.6%, 16.7%, 5.1%, 4.1%, and 10.9% for any reason, substance use, thoughts of suicide, stress/anxiety, and bereavement, respectively, compared to the pre‐Ida volume.
Table 3.
ARIMA (1,0,1) Model Parameter Characteristics for Each Crisis Text Outcome in Impacted Louisiana Communities Post‐Ida Under Different Impact Scenarios, Crisis Text Line 2021
| Model 1 (4 weeks) | Model 2 (3 months) | Model 3 (4 months) | ||||
|---|---|---|---|---|---|---|
| Estimate (SE) | p‐Value | Estimate (SE) | p‐Value | Estimate (SE) | p‐Value | |
| Any Text | 17.32(0.65) | <0.001 | 17.03(0.43) | <0.001 | 17.23(0.41) | <0.001 |
| AR 1 | 0.94(0.07) | <0.001 | 0.90(0.1) | <0.001 | 0.85(0.09) | <0.001 |
| MA 1 | −0.81(0.10) | <0.001 | −0.82(0.13) | <0.001 | −0.75(0.12) | <0.001 |
| Substance Use | 0.30(0.04) | <0.001 | 0.33(0.03) | <0.001 | 0.35(0.03) | <0.001 |
| AR 1 | −0.44(0.69) | 0.53 | 0.53(0.32) | 0.1 | −0.52(0.78) | 0.51 |
| MA 1 | 0.46(0.68) | 0.5 | −0.59(0.31) | 0.05 | 0.54(0.79) | 0.49 |
| Thoughts of Suicide | 3.83(0.13) | <0.001 | 3.89(0.11) | <0.001 | 3.89(0.11) | <0.001 |
| AR 1 | −0.82(0.15) | <0.001 | −0.83(0.14) | <0.001 | −0.76(0.23) | <0.001 |
| MA 1 | 0.76(0.17) | <0.001 | 0.78(0.16) | <0.001 | 0.69(0.25) | <0.01 |
| Stress and Anxiety | 5.76(0.2) | <0.001 | 5.76(0.17) | <0.001 | 5.8(0.17) | <0.001 |
| AR 1 | 0.48(0.40) | 0.23 | 0.17(0.33) | 0.6 | 0.27(0.29) | 0.35 |
| MA 1 | −0.33(0.43) | 0.43 | −0.01(0.33) | 0.99 | −0.09(0.3) | 0.75 |
| Bereavement | 0.98(0.08) | <0.001 | 0.99(0.07) | <0.001 | 1.02(0.06) | <0.001 |
| AR 1 | −0.06(0.31) | 0.85 | −0.03(0.79) | 0.97 | −0.28(0.32) | 0.39 |
| MA 1 | 0.26(0.30) | 0.39 | 0.13(0.76) | 0.86 | 0.39(0.31) | 0.21 |
Note. Model 1: Short‐term impact (29 August–26 September). Model 2: Delayed impact (29 August–29 November). Model 3: Chronic impact (29 August–29 December).
Shocks to the daily crisis text rate for each outcome in the 4 months after the storm were felt in subsequent days following the storm (Figures 2a–2e). We observed a statistically significant 12%, 24.3%, 28.4%, and 41.8% increase in crisis texts for any reason, thoughts of suicide, stress/anxiety, and bereavement, respectively, in the 4 week period after Ida compared to the forecasted volume for each crisis outcome. In the 3 months following Ida, there was a statistically significant 11.3% and 10.2% increase in crisis text for thoughts of suicide and stress/anxiety compared to the forecasted volume. In the 4 months following Ida, there was a significant 4.5%, 24.3%, 9.2%, 9%, and 17.8% increase in crisis texts for any reason, substance use, thoughts of suicide, stress/anxiety, and bereavement, respectively, compared to the forecasted volume.
Figure 2.
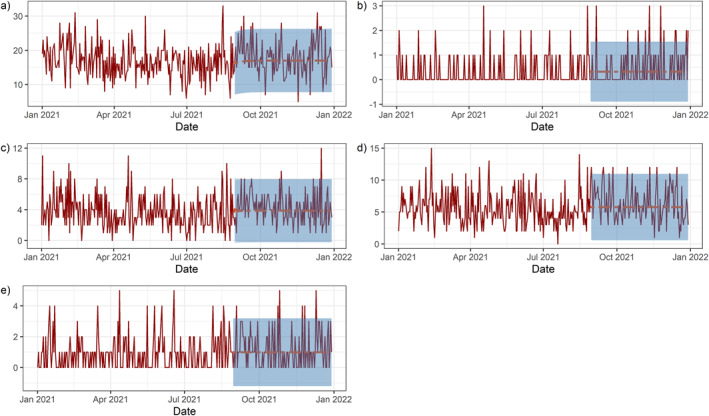
The forecasted crisis text volume in the four‐month post‐Ida intervention period for (a) any text; (b) substance use; (c) thoughts of suicide; (d) stress/anxiety; (e) bereavement, Louisiana 2021. The dotted red line shows the forecasted amount of conversations and the transparent blue square represents the 95% confidence interval.
3.3. Forecast Modeling of Control Group Post‐Ida
Table 5 shows the ARIMA(1,0,1) model estimated conversation volume of daily future crisis text volume for individuals in Louisiana post‐Ida for each intervention period for non‐impacted areas (i.e., control regions). These areas were analyzed to determine if the trends in the impacted areas were also found in the non‐exposed locations across the state (counterfactuals) (Figures 3a–3e). Using ARIMA, significantly more crisis text volume was observed for any text in the 4 weeks and 4 months after Ida compared to the pre‐event period, 9% and 6.8%, respectively. Significantly more crisis text volume was observed for bereavement in the 3 months (34.7%) and 4 months (31%) after Ida compared to the pre‐event forecasted volume.
Table 5.
ARIMA (1,0,1) Model Parameter Characteristics for Each Crisis Text Outcome in the Control Louisiana Communities Post‐Ida Under Different Impact Scenarios, Crisis Text Line 2021
| Model 1 (4 weeks after) | Model 2 (3 months after) | Model 3 (4 months after) | ||||
|---|---|---|---|---|---|---|
| Estimate (SE) | p‐Value | Estimate (SE) | p‐Value | Estimate (SE) | p‐Value | |
| Any Text | 4.32(0.15) | <0.001 | 4.34(0.13) | <0.001 | 4.43(0.13) | <0.001 |
| AR 1 | −0.32(0.30) | 0.26 | −0.34(0.31) | 0.28 | −0.19(0.43) | 0.66 |
| MA 1 | 0.44(0.27) | 0.11 | 0.44(0.30) | 0.13 | 0.30(0.42) | <0.47 |
| Substance Use | 0.09(0.02) | <0.001 | 0.08(0.02) | <0.001 | 0.07(0.02) | <0.001 |
| AR 1 | −059(0.39) | <0.001 | −0.57(0.36) | <0.001 | −0.59(0.41) | <0.001 |
| MA 1 | 0.65(0.36) | <0.001 | 0.63(0.34) | <0.001 | 0.64(0.39) | <0.001 |
| Thoughts of Suicide | 1.02(0.06) | <0.001 | 0.98(0.06) | <0.001 | 1.02(0.06) | <0.001 |
| AR 1 | −0.02(1.76) | 0.99 | −0.09(0.83) | 0.92 | 0.04(0.48) | 0.94 |
| MA 1 | 0.03(1.75) | 0.99 | 0.11(0.83) | 0.90 | 0.02(0.48) | 0.97 |
| Stress and Anxiety | 1.50(0.07) | <0.001 | 1.47(0.06) | <0.001 | 1.49(0.06) | <0.001 |
| AR 1 | −0.59(0.56) | 0.38 | −0.27(0.64) | 0.67 | −0.32(0.59) | 0.58 |
| MA 1 | 0.42(0.59) | 0.47 | 0.22(0.65) | 0.73 | 0.28(0.60) | 0.63 |
| Bereavement | 0.29(0.03) | <0.001 | 0.33(0.03) | <0.001 | 0.34(0.03) | <0.001 |
| AR 1 | 0.17(3.16) | 0.96 | 0.19 | 1 | 0.51(1.31) | 0.61 |
| MA 1 | −0.16(3.20) | 0.96 | −0.19 | 1 | −0.49(1.33) | 0.63 |
Note. Model 1: Fout weeks after (29 August–26 September). Model 2: Three months after (29 August–29 November). Model 3: Four months after (29 August–29 December).
Figure 3.
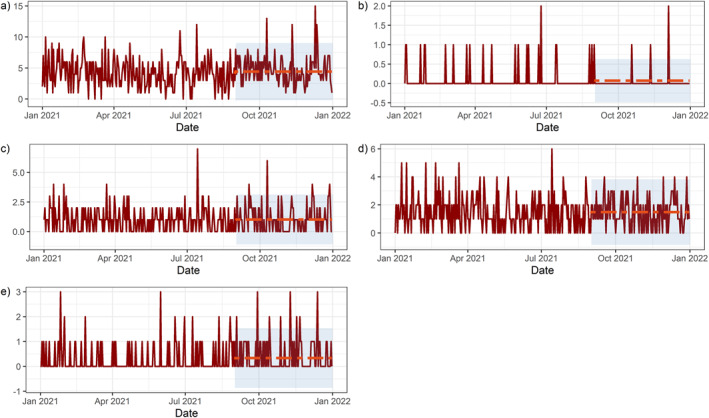
The forecasted crisis text volume for the control group in the four‐month post‐Ida intervention period for (a) any text; (b) substance use; (c) thoughts of suicide; (d) stress/anxiety; (e) bereavement, Louisiana 2021. The dotted red line shows the forecasted amount of conversations, and the transparent blue square represents the 95% confidence interval.
The impacted and control group saw an equal rise in text volume for any reason in the first 4 weeks after Ida. Indicating that the rise in overall crisis help‐seeking behavior and bereavement rates were not isolated to just the impacted areas and may be influenced by other stressors outside of Hurricane Ida (e.g., the COVID‐19 pandemic).
3.4. Difference‐In‐Difference Models for Crisis Text Line Volume Post‐Ida
The DID model results for each crisis outcome for the different hurricane event scenarios are shown in Table 4. We observed a significant positive percent difference in texter volume in the impacted group compared to the control group for substance use (0.03, CI: 0.03–0.04) and stress/anxiety (0.13, CI: 0.02–0.24) in the four‐week period following the storm. In the three‐month period following the storm, there was a significant increase in texter volume for the impacted group compared to the control group for substance use (0.08, CI: 0.06, 0.09), thoughts of suicide (0.19, CI: 0.10–0.27), and stress/anxiety (0.12, CI: 0.07–0.16). In the four‐month period following Hurricane Ida, there was a significant positive percent difference for people texting about substance use (0.08, CI: 0.04–0.12).
Table 4.
Summary of the Average Effect of Treatment on the Treated (ATT) for Louisiana Impacted Compared to Control Communities Before and After Hurricane Ida, 2021
| Post‐Ida ATT | |||
|---|---|---|---|
| Daily text volume | 4 weeks | 3 months | 4 months |
| (95%CI) | (95%CI) | (95%CI) | |
| (29 August 2021–26 September 2021) | (27 September 2021–29 November 2021) | (30 November 2021–29 December 2021) | |
| Any Text | 0.0227 | 0.0020 | −0.0743 a |
| (−0.1612, 0.2066) | (−0.0425, 0.0466) | (−0.1120, −0.0365) | |
| Substance Use | 0.0313 a | 0.0754 a | 0.0822 a |
| (0.0262, 0.0363) | (0.0559, 0.0948) | (0.0449, 0.1194) | |
| Thoughts of Suicide | −0.0152 | 0.1858 a | −0.1620 a |
| (−0.1403, 0.1100) | (0.0969, 0.2747) | (−0.2257, −0.0983) | |
| Stress and Anxiety | 0. 1,336 a | 0. 1,174 a | 00137 |
| (0. 0246, 0. 2425) | (0. 0698, 0.1649) | (−0.0883, 0.1156) | |
| Bereavement | 0.0026 | −0.0784 a | −0.0271 |
| (−0.0406, 0.0457) | (−0.1202, −0.0366) | (−0.1181, 0.0639) | |
p‐value < 0.05.
4. Discussion
The objective of this study was to examine the mental health impact on residents of impacted communities in Louisiana after Hurricane Ida, which co‐occurred during the COVID‐19 pandemic. Results from our ITS analysis confirm our hypothesis that Hurricane Ida generated an immediate (4‐week) and sustained (3–4 months) increase in crisis text patterns for thoughts of suicide and stress/anxiety texts among individuals directly impacted by Ida in all three time periods following the storm. Additionally, there was a significant increase in conversations regarding substance use in the impacted group, an increase not observed in the control group, in the 4 months post‐Ida.
Our DID analysis supports the ITS results, indicating a significant increase in stress/anxiety in the 4 weeks following Hurricane Ida for the impacted group compared to the control group. There was a significant increase in conversations regarding thoughts of suicide and stress/anxiety in the 3 months post‐storm and an increase in substance use (4 weeks, 3 months, and 4 months) post‐storm for impacted communities. Other significant increases were observed for bereavement (3 months) and any conversation (4 months). After accounting for temporal changes in local crisis text patterns, we concluded that the increase in the average daily volume of crisis‐texts post‐disaster across all temporal periods observed is likely reflective of the mental health experience of impacted individuals in Louisiana associated with Hurricane Ida complicated by the strain of the pandemic.
Limited research has examined the shorter‐term impacts of climate disasters on mental health. In a study concerning preschool‐aged children's mental health following Hurricane Florence, researchers found that high hurricane impact predicted a significant increase in post‐traumatic stress disorder (PTSD) symptoms 1 year after the storm (Naudé et al., 2022). Similar to our study using CTL data, Runkle, Michael, et al., 2021 observed a 23% increase in thoughts of suicide and a 17% increase in stress/anxiety in the first 6 weeks after Hurricane Florence to in youth populations directly exposed in North and South Carolina. Our ITS results are comparable with a 24.3% increase in thoughts of suicide and a 28.4% increase in stress/anxiety in the first 4 weeks following the storm. However, Hurricane Ida impacted a different region (Louisiana) and co‐occurred with the COVID‐19 pandemic, which may explain higher rates of crisis events in our four‐week post‐impact period.
Following Hurricane Sandy in New York, there was an increase in reported instances of depression and stress for the first 6 months and a continuous increase in reported cases of PTSD in the first year of recovery (He et al., 2016; Lieberman‐Cribbin et al., 2017; Schneider et al., 2019; Schwartz et al., 2017). In both cases, areas that experienced flooding had a significantly higher increase in reported instances of mental health concerns compared to sites that experienced no flooding. Although our analysis did not incorporate a 6‐month time period, we did note increases in crisis events for anxiety/stress up to 4 months in areas directly impacted by the storm.
Researchers interviewing Hurricane Katrina adult survivors 5–8 months after the storm determined that severe and moderate‐mild forms of mental illness were 5.2% and 10.2% higher, respectively, compared to the pre‐Katrina period (Kessler, 2006). Conversely, participants with a preexisting mental illness exposed to Katrina reported a decline of 7.7% in suicidal ideation and a 2.9% reduction in suicidal plans post‐Katrina. A sample of the initial interviewees participated in a follow‐up interview 1 year after the storm, and PTSD symptoms, severe mental illness, suicidal ideation, and suicidal plans were all significantly higher, 6%, 3.1%, 3.6%, and 1.5%, respectively, than pre‐Katrina reported numbers (Kessler et al., 2008). Our ITS and DID results showed a similar trend in overall mental health, but we detected an earlier peak in daily text volume for thoughts of suicide in the first 3 months following Hurricane Ida. Future work is needed to examine if suicidal behaviors remained elevated across longer time spans during recovery efforts.
Unlike previous work, we also included the use of counterfactual or control regions, to assess if changes in conversation volumes were unique to impacted regions. Our control regions experienced a significant increase in overall crisis texts for any reason in the 4 weeks and 4 months following Hurricane Ida. Additionally, there was a significant increase in conversation volume regarding bereavement in the three and 4 months after Hurricane Ida. Our finding might imply “spillover” effects from Hurricane Ida (e.g., via media exposure) or continued mental health concerns from the concurrent COVID‐19 pandemic. One study showed that media‐based exposure to hurricanes in Florida residents repeatedly exposed to Hurricanes Irma and Michael were associated with ongoing psychological distress (Garfin et al., 2022). Another panel survey study in Florida determined that exposure to storm‐related media accounts of the impending storm were associated with adverse psychological distress post‐Irma (Thompson et al., 2019). Similar to earlier studies, a noteworthy increase was observed for crisis outcomes related to bereavement in both ITS analysis for impacted and non‐impacted areas, as well as, the DID analysis (Maguen et al., 2012). Prior research relying on CTL data has also identified an important association between the COVID‐19 pandemic and increased text volume for stress/anxiety, thoughts of suicide, substance use, and bereavement in vulnerable US populations (Harden et al., 2021; Runkle, Michael, et al., 2021; Runkle, Sugg, et al., 2021; Ryan et al., 2022; Sugg et al., 2021).
Community and individual mental health responses to natural disasters are influenced by the size and magnitude of the disaster event, visibility of impact, the degree of personal exposure (e.g., loss of loved ones, home, the fabric of the community), and the probability of recurrence (DeWolfe & Nordboe, 2000). In general, the results of our study align with previous research indicating a rise in mental health concerns regarding stress/anxiety in the first 6 months following a hurricane (Lieberman‐Cribbin et al., 2017; Runkle, Michael, et al., 2021; Runkle, Sugg, et al., 2021), despite the occurrence of an ongoing disaster (i.e., COVID‐19 pandemic) during our study period.
Our findings are also similar to the first stage of the model proposed by DeWolfe and utilized by the US Substance Abuse and Mental Health Administration (SAMHSA) for community disaster response, which states that the survivors' emotions generally become more difficult to manage around the time of a disaster warning with feelings of distress and uncertainty increasing until the impact of the disaster (DeWolfe & Nordboe, 2000). Yet, our findings contrast with the model once we move further from the disaster event. The SAMSHA model shows improvement in emotions and mental health response during the early “heroic and honeymoon phase” of the community disaster response (e.g., up to 5 or 6 months post‐disaster), a time when community residents are bonding together through the shared experience of the disaster and are typically able to manage their stress (DeWolfe & Nordboe, 2000). Interestingly, results from the DID and ARIMA analysis show a peak in anxiety/stress texts in the 1 month after the storm, followed by a sustained increase in stress/anxiety and significantly higher text volume for thoughts of suicide and substance use in the 3 months post‐storm. Our results suggest that the hurricane may have worsened or amplified the effect of the ongoing pandemic characterized by an already elevated volume of crisis response in LA, which may have served to shorten the heroic or honeymoon period and ushered in disillusionment more quickly.
Our study contrasts with previous work that suggests an improvement in mental health in the early months of the recovery period following a natural disaster (DeWolfe & Nordboe, 2000), a drop in suicidality during the honeymoon phase (Kõlves et al., 2013), or as much as a 6‐month to 1‐year delay in the appearance of more adverse mental health symptoms, including PTSD, depression, or suicidal ideation (Galea et al., 2007; Kessler et al., 2008; Naudé et al., 2022). These differences might be attributable to the variability in methodological approaches, given the majority of the existing literature is based on surveys collected on impacted residents several months post event compared to near real‐time data passively collected from the CTL crisis response platform. Further, a large portion of CTL users are under 24 years of age; prior studies have typically focused on adult populations. Lastly, we relied on the use of a counterfactual group to confirm our findings. Our focused analysis of data from a text‐based platform, provides a more immediate method of capturing the psychological response of individuals compared to traditional survey methodologies and has the added advantage of including pre‐intervention texter patterns, which may, in part, explain differences in the timing of mental health consequences post‐storm between our work compared to previous studies.
4.1. Recommendations for Post‐Disaster Mental Health Response
The majority of communities impacted by Ida in Louisiana were characterized as health professional shortage areas, suggesting that these areas likely had insufficient mental health care services before the storm (Dodgen et al., 2016). Ensuring access to and availability of professional counselors for impacted communities in the immediate wake (two to 4 weeks) of a climate disaster has been shown to reduce the risk of long‐term mental health concerns, even in extreme cases such as Katrina, and expanding access to mental health support early has a continuing health promoting effect across the recovery period (Bui et al., 2021; Weems et al., 2016). Contact with sources of social support outside of the family predicted lower levels of self‐reported symptoms of PTSD, anxiety, and depression post‐Katrina (Pina et al., 2008). The Committee on Post‐Disaster Recovery of a Community's Public Health, Medical, and Social Services indicates the need for counseling among victims goes beyond the immediate aftermath of a natural disaster and emphasized the need for longer‐term mental health services for mental health symptoms that develop 6 months to several years post‐event (Makwana, 2019). For these reasons, it is encouraging that our results suggest individuals are willing to seek help during an acutely vulnerable time through a text‐based crisis counseling platform (i.e., CTL). The use of digital platforms, like CTL, during these climate disasters has significant potential to serve as a low‐cost and scalable mental health intervention to help alleviate the mental health consequences following population‐exposure to climate disasters.
4.2. Strengths and Limitations
This study contributes to the existing literature in several significant ways. First, unlike previous mental health research (Galea et al., 2007; Kessler et al., 2008; Naudé et al., 2022), which focused on survey responses, psychometric screening scales, and clinical interviews, our study uses a quasi‐experimental design to account for pre‐event trends in help‐seeking behaviors to better characterized the post‐impact of the disaster (i.e., level, slope, and changing pattern) on crisis response help‐seeking (Hudson et al., 2019). Additional strengths included the analysis of daily counts for texting behavior for a large array of mental health concerns, from a nationally available crisis text platform, compared to weekly or monthly counts of hospital or emergency department use data that will not be readily available to the research community for at least a year after the event. Third, the validity of CTL data as a representation of the mental health impact on a community is consistent with emergency department visits for mental health outcomes (Runkle, Michael, et al., 2021). Lastly, the DID analysis addressed the potential for uncontrolled confounding by adding a control group that allows for a comparison of how the impacted group differed had they not been directly exposed to the storm (Wing et al., 2018).
The study had a few limitations. The ecological nature of the anonymized CTL data was limited to area code of the texter. Because disaster exposure was based on where FEMA‐designated public and individual assistance occurred at the county scale and the use of texter area code, exposure misclassification of hurricane exposure may have occurred. As a result, a few of the parishes that were not directly impacted by the storm were included in the impacted group due to the large spatial extent of the area code boundaries. Additionally, we assumed that an individual's area code served as a proxy for their physical location; however, individuals who have relocated or traveled during the storm, but utilized CTL during the study period may have been incorrectly grouped into the exposure group. However, analysis from CTL based on the texter's current state of residence found 70% of texters reside in their assigned state of residence (CTL, 2022). Further, due to the use of aggregated and de‐identified crisis text data, we were unable to discern the effect of preexisting mental health conditions (e.g., previous diagnosis of anxiety or depression) on changes in post‐Ida conversation volume. Research has shown that the mental health consequences of a disaster among survivors with a pre‐existing mental health condition are more severe compared to individuals with new and emergent psychological sequelae (SAMHSA 2019a, 2019b; Storch et al., 2018). The data set used for this analysis does not make a distinction between first‐time users or repeat users but instead looks at all conversations; this means that a few individuals who utilized the service at a high frequency for a smaller sample size of conversation concerns (e.g., substance use or bereavement) could lead to a misinterpretation of the events taking place across the impacted area. Lastly, the post‐intervention periods in our analysis were defined over a short period of time, 4 weeks, 3 months, and 4 months post‐intervention. Previous studies have found a sustained increase in mental health concerns as long as 24 months after the hurricane (Olteanu et al., 2011; Roberts et al., 2010). Future work is needed across longer time scales to assess the mental health impacts of hurricanes as well as concurrent disasters.
Additional research is needed to confirm our findings in the context of other hurricanes impacting the Southeast and consider the mental health impacts of other climate and social disasters co‐occurring with each other (e.g., COVID‐19, heatwave, and wildfires). Analysis of the health impacts from concurrent disasters is still an emerging research priority and requires expansion beyond the traditional single‐hazard approach. Continued reliance on models that only explain how individuals are impacted by a single hazard will not be sufficient as the climate continues to change, ushering in the need to be able to model the more frequent incidence of multiple and co‐occurring hazard events in quick succession (Potutan & Arakida, 2021).
5. Conclusions
This study is amongst the first to examine the concurrent effects of the 2021 hurricane season and the ongoing COVID‐19 pandemic on mental health. Our study leveraged a real‐time anonymized data set of national crisis texts in the U.S. that allowed us to examine pre‐and post‐event crisis response to both Hurricane Ida and the COVID‐19 pandemic. We implemented a quasi‐experimental framework to investigate the trends in crisis events using an interrupted time series analysis and difference‐in‐difference modeling approach. Our results showed increases in several CTL‐crisis events in the four‐week, three‐month, and four‐month scenarios following Hurricane Ida. More research is needed to understand the complex time‐varying mental health effects of concurrent and cascading climate disasters across different populations and regions, and for concurrent disasters.
Conflict of Interest
Devyani Singh is employed by Crisis Text Line. However, the authors declare that they have no known competing financial interests or personal relationships that could have appeared to influence the work reported in this paper.
Supporting information
Figure S1
Acknowledgments
We thank our external funders and collaborators for supporting this work. This work is made possible through the collaboration with Crisis Text Line and the funded support of the National Institute of Environmental Health Sciences (NIEHS)'s R15grant (#1R15ES033817‐01) and the National Science Foundation CAREER Award (Grant #2044839). The content is solely the authors' responsibility and does not represent the official views of Crisis Text Line, or the National Institute of Environmental Health Sciences.
Wertis, L. , Runkle, J. D. , Sugg, M. M. , & Singh, D. (2023). Examining Hurricane Ida's impact on mental health: Results from a quasi‐experimental analysis. GeoHealth, 7, e2022GH000707. 10.1029/2022GH000707
Data Availability Statement
The CTL data is not available for public use and requires a lengthy application review process and data use agreement. Readers interested in obtaining this data can visit https://www.crisistextline.org/data-philosophy/research-collaborations/, and explore CTL's Research Collaboration Program. The application to gain access to CTL data is located on the page you are directed to from the above link.
References
- Babu, S. C. , & Hallam, A. (2017). Chapter 11—Methods of program evaluation: An analytical review and implementation strategies. In Gajanan S. N. (Ed.), Nutrition economics (pp. 205–230). Academic Press. [Google Scholar]
- Bui, B. K. , Anglewicz, P. , & VanLandingham, M. J. (2021). The impact of early social support on subsequent health recovery after a major disaster: A longitudinal analysis. SSM ‐ Population Health, 14, 100779. 10.1016/j.ssmph.2021.100779 [DOI] [PMC free article] [PubMed] [Google Scholar]
- Callaway, B. , & Sant'Anna, P. (2021b). “did: Difference in Differences.” R package version 2.1.1. Retrieved from https://bcallaway11.github.io/did/
- Callaway, B. , & Sant'Anna, P. H. C. (2021a). Difference‐in‐differences with multiple time periods. Journal of Econometrics, 225(2), 200–230. 10.1016/j.jeconom.2020.12.001 [DOI] [Google Scholar]
- Cao, Z. , & Song, X. (2011). SB1 comparison of difference‐in‐difference, propensity score matching and instrumental variables in estimating cost differences between two cohorts. Value in Health, 14(3). 10.1016/j.jval.2011.02.025 [DOI] [Google Scholar]
- Collins, J. , Polen, A. , McSweeney, K. , Colón‐Burgos, D. , & Jernigan, I. (2021). Hurricane risk perceptions and evacuation decision‐making in the age of COVID‐19. Bulletin of the American Meteorological Society, 102(4), E836–E848. 10.1175/bams-d-20-0229.1 [DOI] [Google Scholar]
- Comstock, O. (2021). Hurricane Ida caused at least 1.2 million electricity customers to Lose Power. In Homepage—U.S. Energy information administration (EIA). Retrieved from https://www.eia.gov/todayinenergy/detail.php?id=49556#:∼:text=Hurricane%20Ida%20resulted%20in%20service,and%20Emergency%20Response%20 [Google Scholar]
- Costa, N. M. , Weems, C. F. , & Pina, A. A. (2009). Hurricane Katrina and youth anxiety: The role of perceived attachment beliefs and parenting behaviors. Journal of Anxiety Disorders, 23(7), 935–941. 10.1016/j.janxdis.2009.06.002 [DOI] [PubMed] [Google Scholar]
- Crisis Text Line . (2022). Crisis Text Line | text HOME to 741741 free, 24/7 crisis counseling. Crisis Text Line. Retrieved from https://www.crisistextline.org/
- Cunsolo, A. , & Ellis, N. R. (2018). Ecological grief as a mental health response to climate change‐related loss. Nature Climate Change, 8(4), 275–281. 10.1038/s41558-018-0092-2 [DOI] [Google Scholar]
- David Stoffer (2021). astsa: Applied statistical time series analysis. R package version 1.14. Retrieved from https://CRAN.R-project.org/package=astsa
- DeWolfe, D. J. , & Nordboe, D. (2000). Training manual for mental health and human service workers in major disasters. U.S. Department of Health and Human Services, Substance Abuse and Mental Health Services Administration, Center for Mental Health Services. [Google Scholar]
- Dodgen, D. , Donato, D. , Kelly, N. , La Greca, A. , Morganstein, J. , Reser, J. , et al. (2016). Ch. 8: Mental health and well‐being (pp. 217–246). US Global Change Research Program. [Google Scholar]
- Domingue, S. J. , & Emrich, C. T. (2019). Social vulnerability and procedural equity: Exploring the distribution of disaster aid across counties in the United States. The American Review of Public Administration, 49(8), 897–913. 10.1177/0275074019856122 [DOI] [Google Scholar]
- FEMA . (2022). Designated areas: Disaster 3574. Designated areas | FEMA.gov. Retrieved from https://www.fema.gov/disaster/3574/designated-areas
- Fitzpatrick, K. M. , & Spialek, M. L. (2020). Suicide ideation and a post‐disaster assessment of risk and protective factors among hurricane Harvey survivors. Journal of Affective Disorders, 277, 681–687. 10.1016/j.jad.2020.08.072 [DOI] [PubMed] [Google Scholar]
- Galea, S. , Brewin, C. R. , Gruber, M. , Jones, R. T. , King, D. W. , King, L. A. , et al. (2007). Exposure to hurricane‐related stressors and mental illness after Hurricane Katrina. Archives of General Psychiatry, 64(12), 1427. 10.1001/archpsyc.64.12.1427 [DOI] [PMC free article] [PubMed] [Google Scholar]
- Garfin, D. R. , Thompson, R. R. , Holman, E. A. , Wong‐Parodi, G. , & Silver, R. C. (2022). Association between repeated exposure to hurricanes and mental health in a representative sample of Florida residents. JAMA Network Open, 5(6), e2217251. 10.1001/jamanetworkopen.2022.17251 [DOI] [PMC free article] [PubMed] [Google Scholar]
- Harden, S. R. , Runkle, J. D. , Weiser, J. , Green, S. , & Sugg, M. M. (2021). Spatial clustering of adolescent bereavement in the United States during the COVID‐19 pandemic. Journal of Adolescent Health, 69(1), 140–143. 10.1016/j.jadohealth.2021.04.035 [DOI] [PubMed] [Google Scholar]
- He, F. T. , Lundy De La Cruz, N. , Olson, D. , Lim, S. , Levanon Seligson, A. , Hall, G. , et al. (2016). Temporal and spatial patterns in utilization of mental health services during and after Hurricane Sandy: Emergency department and Inpatient Hospitalizations in New York City. Disaster Medicine and Public Health Preparedness, 10(3), 512–517. 10.1017/dmp.2016.89 [DOI] [PubMed] [Google Scholar]
- Hersche, M. , & Moor, E. (2020). Identification and estimation of intensive margin effects by difference‐in‐difference methods. Journal of Causal Inference, 8(1), 272–285. 10.1515/jci-2019-0035 [DOI] [Google Scholar]
- Ho, S. L. , & Xie, M. (1998). The use of Arima models for reliability forecasting and analysis. Computers & Industrial Engineering, 35(1–2), 213–216. 10.1016/s0360-8352(98)00066-7 [DOI] [Google Scholar]
- Hudson, J. , Fielding, S. , & Ramsay, C. R. (2019). Methodology and reporting characteristics of studies using interrupted time series design in Healthcare. BMC Medical Research Methodology, 19(1), 137. 10.1186/s12874-019-0777-x [DOI] [PMC free article] [PubMed] [Google Scholar]
- Hyndman, R. , Athanasopoulos, G. , Bergmeir, C. , Caceres, G. , Chhay, L. , O'Hara‐Wild, M. , et al. (2022). forecast: Forecasting functions for time series and linear models. R package version 8.16. Retrieved from https://pkg.robjhyndman.com/forecast/
- Kessler, R. (2006). Mental illness and suicidality after Hurricane Katrina. Bulletin of the World Health Organization, 84(12), 930–939. 10.2471/blt.06.033019 [DOI] [PMC free article] [PubMed] [Google Scholar]
- Kessler, R. C. , Galea, S. , Gruber, M. J. , Sampson, N. A. , Ursano, R. J. , & Wessely, S. (2008). Trends in mental illness and suicidality after Hurricane Katrina. Molecular Psychiatry, 13(4), 374–384. 10.1038/sj.mp.4002119 [DOI] [PMC free article] [PubMed] [Google Scholar]
- Knutson, T. , Camargo, S. J. , Chan, J. C. , Emanuel, K. , Ho, C.‐H. , Kossin, J. , et al. (2019). Tropical cyclones and climate change assessment: Part I: Detection and attribution. Bulletin of the American Meteorological Society, 100(10), 1987–2007. 10.1175/bams-d-18-0189.1 [DOI] [Google Scholar]
- Kõlves, K. , Kõlves, K. E. , & De Leo, D. (2013). Natural disasters and suicidal behaviours: A systematic literature review. Journal of Affective Disorders, 146(1), 1–14. 10.1016/j.jad.2012.07.037 [DOI] [PubMed] [Google Scholar]
- Kossin, J. P. , Camargo, S. J. , & Sitkowski, M. (2010). Climate modulation of North Atlantic Hurricane tracks. Journal of Climate, 23(11), 3057–3076. 10.1175/2010jcli3497.1 [DOI] [Google Scholar]
- Kossin, J. P. , Knapp, K. R. , Olander, T. L. , & Velden, C. S. (2020). Global increase in major tropical cyclone exceedance probability over the past four decades. Proceedings of the National Academy of Sciences of the United States of America, 117(22), 11975–11980. 10.1073/pnas.1920849117 [DOI] [PMC free article] [PubMed] [Google Scholar]
- Lieberman‐Cribbin, W. , Liu, B. , Schneider, S. , Schwartz, R. , & Taioli, E. (2017). Self‐reported and FEMA flood exposure assessment after Hurricane Sandy: Association with mental Health outcomes. PLoS One, 12(1), e0170965. 10.1371/journal.pone.0170965 [DOI] [PMC free article] [PubMed] [Google Scholar]
- Louisiana Department of Health . (2021). Hurricane Ida Storm‐related death toll rises to 26. LDH. Retrieved from https://ldh.la.gov/news/6308 [Google Scholar]
- Maguen, S. , Neria, Y. , Conoscenti, L. M. , & Litz, B. T. (2012). Depression and prolonged grief in the wake of disasters. In Neria Y., Galea S., & Norris F. H. (Eds.), Mental health and disasters (pp. 116–130). Cambridge University Press. [Google Scholar]
- Makwana, N. (2019). Disaster and its impact on mental Health: A narrative review. Journal of Family Medicine and Primary Care, 8(10), 3090. 10.4103/jfmpc.jfmpc_893_19 [DOI] [PMC free article] [PubMed] [Google Scholar]
- Malmin, N. P. (2020). Historical disaster exposure and household preparedness across the United States. Disaster Medicine and Public Health Preparedness, 15(1), 58–64. 10.1017/dmp.2019.123 [DOI] [PubMed] [Google Scholar]
- Melillo, J. M. , Richmond, T. C. , & Yohe, G. W. , (Eds.), (2014). Climate change impacts in the United States: The third national climate assessment. U.S. Global Change Research Program. (p. 841). 10.7930/J0Z31WJ2 [DOI] [Google Scholar]
- National Centers for Environmental Information . (2022). In Billion‐dollar weather and climate disasters: Events archived from the original on January 11, 2022. National Centers for Environmental Information. [Google Scholar]
- Naudé, A. R. , Machlin, L. , Furlong, S. , & Sheridan, M. A. (2022). Threat responsivity predicts posttraumatic stress disorder hyperarousal symptoms in children after Hurricane Florence. Cognitive, Affective, & Behavioral Neuroscience, 22(4), 690–702. 10.3758/s13415-022-00984-3 [DOI] [PMC free article] [PubMed] [Google Scholar]
- NOAA . (2022). Daily global 5km satellite sea surface temperature anomaly. In NOAA Coral Reef Watch Daily Global 5km satellite coral bleaching heat stress SST anomaly product (version 3.1). Retrieved from https://www.coralreefwatch.noaa.gov/product/5km/index_5km_ssta.php [Google Scholar]
- Olteanu, A. , Arnberger, R. , Grant, R. , Davis, C. , Abramson, D. , & Asola, J. (2011). Persistence of mental health needs among children affected by Hurricane Katrina in New Orleans. Prehospital and Disaster Medicine, 26(1), 3–6. 10.1017/s1049023x10000099 [DOI] [PubMed] [Google Scholar]
- Pei, S. , Dahl, K. A. , Yamana, T. K. , Licker, R. , & Shaman, J. (2020). Compound risks of hurricane evacuation amid the COVID‐19 pandemic in the United States. GeoHealth, 4(12), e2020GH000319. 10.1029/2020gh000319 [DOI] [PMC free article] [PubMed] [Google Scholar]
- Pina, A. A. , Villalta, I. K. , Ortiz, C. D. , Gottschall, A. C. , Costa, N. M. , & Weems, C. F. (2008). Social Support, discrimination, and coping as predictors of posttraumatic stress reactions in youth survivors of Hurricane Katrina. Journal of Clinical Child and Adolescent Psychology, 37(3), 564–574. 10.1080/15374410802148228 [DOI] [PubMed] [Google Scholar]
- Potutan, G. , & Arakida, M. (2021). Evolving disaster response practices during COVID‐19 pandemic. International Journal of Environmental Research and Public Health, 18(6), 3137. 10.3390/ijerph18063137 [DOI] [PMC free article] [PubMed] [Google Scholar]
- Quigley, M. C. , Attanayake, J. , King, A. , & Prideaux, F. (2020). A multi‐hazards Earth science perspective on the COVID‐19 pandemic: The potential for concurrent and cascading crises. Environment Systems and Decisions, 40(2), 199–215. 10.1007/s10669-020-09772-1 [DOI] [PMC free article] [PubMed] [Google Scholar]
- R Core Team . (2021). R: A language and environment for statistical computing. R Foundation for Statistical Computing. Retrieved from https://www.R-project.org/ [Google Scholar]
- Roberts, Y. H. , Mitchell, M. J. , Witman, M. , & Taffaro, C. (2010). Mental health symptoms in youth affected by Hurricane Katrina. Professional Psychology: Research and Practice, 41(1), 10–18. 10.1037/a0018339 [DOI] [Google Scholar]
- Rosenthal, Z. (2021). True scope of Ida's destruction becoming clearer in wake of storm. In AccuWeather. Archived from the original on August 31, 2021. [Google Scholar]
- Rowe, C. L. , & Liddle, H. A. (2008). When the levee breaks: Treating adolescents and families in the aftermath of Hurricane Katrina. Journal of Marital and Family Therapy, 34(2), 132–148. 10.1111/j.1752-0606.2008.00060.x [DOI] [PMC free article] [PubMed] [Google Scholar]
- Runkle, J. D. , Michael, K. D. , Stevens, S. E. , & Sugg, M. M. (2021). Quasi‐experimental evaluation of text‐based crisis patterns in youth following Hurricane Florence in the Carolinas, 2018. Science of the Total Environment, 750, 141702. 10.1016/j.scitotenv.2020.141702 [DOI] [PubMed] [Google Scholar]
- Runkle, J. D. , Sugg, M. M. , Yadav, S. , Harden, S. , Weiser, J. , & Michael, K. (2021). Real‐time mental health crisis response in the United States to COVID‐19. Crisis, 0. 10.1027/0227-5910/a000826 [DOI] [PubMed] [Google Scholar]
- Ryan, S. C. , Runkle, J. D. , Sugg, M. M. , Singh, D. , Green, S. , & Wertis, L. (2022). Spatio‐temporal clustering of adolescent bereavement in the United States during the extended response to COVID‐19: A follow‐up study. Journal of Adolescent Health, 72(1), 156–159. 10.1016/j.jadohealth.2022.08.021 [DOI] [PMC free article] [PubMed] [Google Scholar]
- SAMHSA . (2019a). Disaster preparedness, response, and recovery. SAMHSA. Retrieved from https://www.samhsa.gov/disaster-preparedness [Google Scholar]
- SAMHSA . (2019b). Disasters and people with serious mental illness. In Disaster technical assistance center supplemental research bulletin. Retrieved from https://www.samhsa.gov/sites/default/files/disasters-people-with-serious-mental-illness.pdf [Google Scholar]
- Schaffer, A. L. , Dobbins, T. A. , & Pearson, S. A. (2021). Interrupted time series analysis using autoregressive integrated moving average (ARIMA) models: A guide for evaluating large‐scale health interventions. BMC Medical Research Methodology, 21(1), 58. 10.1186/s12874-021-01235-8 [DOI] [PMC free article] [PubMed] [Google Scholar]
- Schmidtlein, M. C. , Finch, C. , & Cutter, S. L. (2008). Disaster declarations and major hazard occurrences in the United States∗. The Professional Geographer, 60(1), 1–14. 10.1080/00330120701715143 [DOI] [Google Scholar]
- Schneider, S. , Rasul, R. , Liu, B. , Corry, D. , Lieberman‐Cribbin, W. , Watson, A. , et al. (2019). Examining posttraumatic growth and mental health difficulties in the aftermath of Hurricane Sandy. Psychological Trauma: Theory, Research, Practice, and Policy, 11(2), 127–136. 10.1037/tra0000400 [DOI] [PMC free article] [PubMed] [Google Scholar]
- Schwartz, R. M. , Gillezeau, C. N. , Liu, B. , Lieberman‐Cribbin, W. , & Taioli, E. (2017). Longitudinal impact of Hurricane Sandy exposure on mental health symptoms. International Journal of Environmental Research and Public Health, 14(9), 957. 10.3390/ijerph14090957 [DOI] [PMC free article] [PubMed] [Google Scholar]
- Shear, M. K. , McLaughlin, K. A. , Ghesquiere, A. , Gruber, M. J. , Sampson, N. A. , & Kessler, R. C. (2011). Complicated grief associated with Hurricane Katrina. Depression and Anxiety, 28(8), 648–657. 10.1002/da.20865 [DOI] [PMC free article] [PubMed] [Google Scholar]
- Shultz, J. M. , Trapido, E. J. , Kossin, J. P. , Fugate, C. , Nogueira, L. , Apro, A. , et al. (2022). Hurricane Ida's impact on Louisiana and Mississippi during the COVID‐19 delta surge: Complex and compounding threats to Population Health. The Lancet Regional Health ‐ Americas, 12, 100286. 10.1016/j.lana.2022.100286 [DOI] [PMC free article] [PubMed] [Google Scholar]
- Singh, J. , Ashfaq, M. , Skinner, C. B. , Anderson, W. B. , Mishra, V. , & Singh, D. (2022). Enhanced risk of concurrent regional droughts with increased ENSO variability and warming. Nature Climate Change, 12(2), 163–170. 10.1038/s41558-021-01276-3 [DOI] [Google Scholar]
- Storch, E. A. , Gregory, S. , Salloum, A. , & Quast, T. (2018). Psychopharmacology utilization among children with anxiety and obsessive–compulsive and related disorders following Hurricane Katrina. Child Psychiatry and Human Development, 49(4), 632–642. 10.1007/s10578-017-0779-z [DOI] [PMC free article] [PubMed] [Google Scholar]
- Stuart, E. A. , Huskamp, H. A. , Duckworth, K. , Simmons, J. , Song, Z. , Chernew, M. E. , & Barry, C. L. (2014). Using propensity scores in difference‐in‐differences models to estimate the effects of a policy change. Health Services & Outcomes Research Methodology, 14(4), 166–182. 10.1007/s10742-014-0123-z [DOI] [PMC free article] [PubMed] [Google Scholar]
- Sugg, M. M. , Dixon, P. G. , & Runkle, J. D. (2019). Crisis support‐seeking behavior and temperature in the United States: Is there an association in Young Adults and adolescents? Science of the Total Environment, 669, 400–411. 10.1016/j.scitotenv.2019.02.434 [DOI] [PubMed] [Google Scholar]
- Sugg, M. M. , Runkle, J. D. , Andersen, L. , Weiser, J. , & Michael, K. D. (2021). Crisis response among essential workers and their children during the COVID‐19 pandemic. Preventive Medicine, 153, 106852. 10.1016/j.ypmed.2021.106852 [DOI] [PMC free article] [PubMed] [Google Scholar]
- Sugg, M. M. , Runkle, J. D. , Hajnos, S. N. , Green, S. , & Michael, K. D. (2022). Understanding the concurrent risk of mental health and dangerous wildfire events in the COVID‐19 pandemic. Science of the Total Environment, 806, 150391. 10.1016/j.scitotenv.2021.150391 [DOI] [PMC free article] [PubMed] [Google Scholar]
- Thompson, R. R. , Holman, E. A. , & Silver, R. C. (2019). Media coverage, forecasted posttraumatic stress symptoms, and psychological responses before and after an approaching hurricane. JAMA Network Open, 2(1), e186228. 10.1001/jamanetworkopen.2018.6228 [DOI] [PMC free article] [PubMed] [Google Scholar]
- Treisman, R. (2021). Louisiana and Mississippi were overwhelmed by Covid‐19 cases. In Then Ida struck. NPR. Retrieved from https://www.npr.org/2021/08/30/1032441006/storm-ida-covid-19-surge-louisiana-mississippi-hospitals-vaccines [Google Scholar]
- Turner, S. L. , Karahalios, A. , Forbes, A. B. , Taljaard, M. , Grimshaw, J. M. , Cheng, A. C. , et al. (2020). Design characteristics and statistical methods used in interrupted time series studies evaluating public health interventions: A review. Journal of Clinical Epidemiology, 122, 1–11. 10.1016/j.jclinepi.2020.02.006 [DOI] [PubMed] [Google Scholar]
- Walsh, J. , Wuebbles, D. , Hayhoe, K. , Kossin, J. , Kunkel, K. , Stephens, G. , et al. (2014). Ch. 2: Our changing climate. Climate change impacts in the United States: The third national climate assessment. 10.7930/j0kw5cxt [DOI]
- Weems, C. F. , Russell, J. D. , Neill, E. L. , Berman, S. L. , & Scott, B. G. (2016). Existential anxiety among adolescents exposed to disaster: Linkages among level of exposure, PTSD, and depression symptoms. Journal of Traumatic Stress, 29(5), 466–473. 10.1002/jts.22128 [DOI] [PubMed] [Google Scholar]
- Welty, C. (2021). “Levee overtops in Braithwaite”. WGNO. Archived from the original on August 29, 2021. Retrieved from https://www.ncei.noaa.gov/access/monitoring/billions/events
- Wing, C. , Simon, K. , & Bello‐Gomez, R. A. (2018). Designing difference in difference studies: Best practices for public health policy research. Annual Review of Public Health, 39(1), 453–469. 10.1146/annurev-publhealth-040617-013507 [DOI] [PubMed] [Google Scholar]
Associated Data
This section collects any data citations, data availability statements, or supplementary materials included in this article.
Supplementary Materials
Figure S1
Data Availability Statement
The CTL data is not available for public use and requires a lengthy application review process and data use agreement. Readers interested in obtaining this data can visit https://www.crisistextline.org/data-philosophy/research-collaborations/, and explore CTL's Research Collaboration Program. The application to gain access to CTL data is located on the page you are directed to from the above link.