

Summary
Pyramidal neurons are a major cell type of the forebrain, consisting of a pyramidally shaped soma with axonal and apicobasal dendritic processes. It is poorly understood how the neuronal soma develops its pyramidal morphology, while generating neurites of the proper shape and orientation. Here, we discovered that the spherical somata of immature neurite-less neurons possess a circumferential wreath-like network of septin filaments, which promotes neuritogenesis by balancing the protrusive activity of lamellipodia and filopodia. In embryonic rat hippocampal and mouse cortical neurons, the septin wreath network consists of curvilinear filaments that contain the septins 5, 7 and 11 (Sept5/7/11). The Sept5/7/11 wreath network demarcates a zone of myosin II enrichment and Arp2/3 diminution at the base of filopodial actin bundles. In Sept7-depleted neurons, cell bodies are enlarged with hyperextended lamellae and abnormally shaped neurites that originate from lamellipodia. This phenotype is accompanied by diminished myosin II and filopodia lifetimes, and an increase in Arp2/3 levels and lamellipodial activity. Inhibition of Arp2/3 activity rescues soma and neurite phenotypes, indicating that the septin wreath network suppresses the extension of lamellipodia, facilitating the formation of neurites from the filopodia of a consolidated soma. We show that this septin function is critical for developing a pyramidally shaped soma with properly distributed and oriented dendrites in cultured rat hippocampal neurons, and in vivo in mouse perinatal cortical neurons. Therefore, the somatic septin cytoskeleton provides a key morphogenetic mechanism for neuritogenesis and the development of pyramidal neurons.
Graphical Abstract

eTOC Summary
Radler et al. report a septin wreath-like cytoskeleton in the soma of immature neurons that promotes neurite formation by balancing the protrusive activity of lamellipodia and filopodia. The septin network is critical for developing a pyramidally shaped soma with properly distributed and oriented dendrites.
Introduction
In the forebrain, excitatory neurons have pyramidally shaped cell bodies (somata) with axonal and apicobasal dendritic processes, which originate from the apex and base of their pyramidal shapes.1,2 Understanding how pyramidal neurons generate and maintain their specialized morphology is critical for tackling neurodevelopmental and neurodegenerative disorders, and devising neuroregenerative strategies.3–6
Neurites, the precursors of axons and dendrites, originate from the membrane protrusions of the neuronal soma.7–9 In the developing brain, neurites develop from the leading and trailing processes of migrating neurons.10,11 However, neurite outgrowth also occurs prior to migration, resembling the stochastic formation and differentiation of multiple neurites in cultured neurons.12–14 In vitro, morphogenesis of pyramidal neurons initiates from spherically shaped cells, which intrinsically break their radial symmetry and extend neurites that differentiate into axonal and apicobasal-like dendritic processes.9,15
Neurite formation is mechanistically executed by the actin and microtubule cytoskeleton 7,8,16. Polymerization of branched actin, which is nucleated by the Arp2/3 machinery of actin assembly, extends lamellipodia protrusions from the peripheral lamellae of spherical neurons 7,17,18. Neurites develop from filopodia which form by reorganization of the lamellipodial actin network and/or actin polymerization at microdomains of the cortical membrane.17,19–23 Neurites can also emerge from microtubule-driven protrusions, or the collapse and consolidation of lamellipodia into cylindrical structures, which is facilitated by microtubule entry and concomitant suppression of actin-based protrusion along the neurite shaft.24–28 Despite advances in our mechanistic understanding of neurite formation, it is unknown how the neuronal soma develops from a sphere into a pyramid, while generating neurites of the right shape and orientation. This morphogenetic development requires spatial regulation and coordination of the lamellipodial and filopodial protrusion of the soma, but the underlying mechanisms are little understood.
Septins are GTP-binding proteins, which assemble into non-polar filamentous oligomers and polymers that associate with membranes and the cytoskeleton.29,30 Septins have evolutionarily conserved roles in cellular morphogenesis and the spatial organization of membrane and cytoskeletal proteins.29,31 In neurons, septins have been functionally linked to axodendritic growth and branching, dendritic spine maturation and polarized membrane traffic.32,33 Septin 7 (Sept7), a ubiquitous and obligate subunit of heteromeric septin complexes, was notably found to provide a spatial memory for the post-mitotic reemergence of neurites in neural crest cells.34 How Sept7 controls neuritogenesis, however, is unknown, and septin functions in the early stages of neuronal morphogenesis have not been explored. Here, we have discovered that the soma of neurite-less spherical neurons contains a novel network of Sept7-containing filaments, which biases membrane protrusive activity toward filopodia by promoting and suppressing myosin II and Arp2/3, respectively. Through this mechanism, Sept7 promotes the formation of properly shaped neurites while maintaining a compact soma, which is critical for the formation of a pyramidally shaped soma with axodendritic processes of proper morphology and orientation.
Results
Spherical stage 1 neurons possess a circumferential septin wreath-like network that demarcates a zone of myosin II enrichment and Arp2/3 diminution.
Septins have been implicated in neuritogenesis, but it is unknown how they function in neurite formation.35 We therefore set out to examine septin localization and function in the early stages of neurite formation in pyramidal neurons. We focused on septin 7 (Sept7), as a ubiquitous subunit of mammalian complexes, in embryonic stage 1 (DIV0) rat hippocampal (E18) and mouse cortical (E15) neurons. Using super-resolution confocal and structured illumination microscopy (SIM), we observed a circumferential wreath-like network of Sept7 filaments which was positioned at the interface of the central microtubule meshwork and the actin network of the peripheral lamellae (Figure 1A). The circumferential septin network consisted of linear and curved filaments of variable lengths and thicknesses (Figure 1A). While devoid of a regular pattern, the septin network contained an array of spoke-like curvilinear fibers, which are positioned orthogonally to the inner perimeter of the cell body (Figure 1A, arrowheads). Consistent with previous reports of Sept5/11/7 complexes in the soma of hippocampal neurons36, Sept5 and Sept11 had similar localization and Sept7 depletion diminished Sept5 expression (Figure S1A–C). A perinuclear network of curvilinear Sept7 filaments was also present in mouse cortical neurons in vitro and in vivo (Figure S1D–E). In cultured cortical neurons, Sept5 and Sept11 colocalized with the Sept7 network (Figure S1F–G).
Figure 1. A novel septin wreath-like cytoskeleton demarcates a zone of myosin II enrichment and Apr2 diminution at the base of filopodial actin bundles.
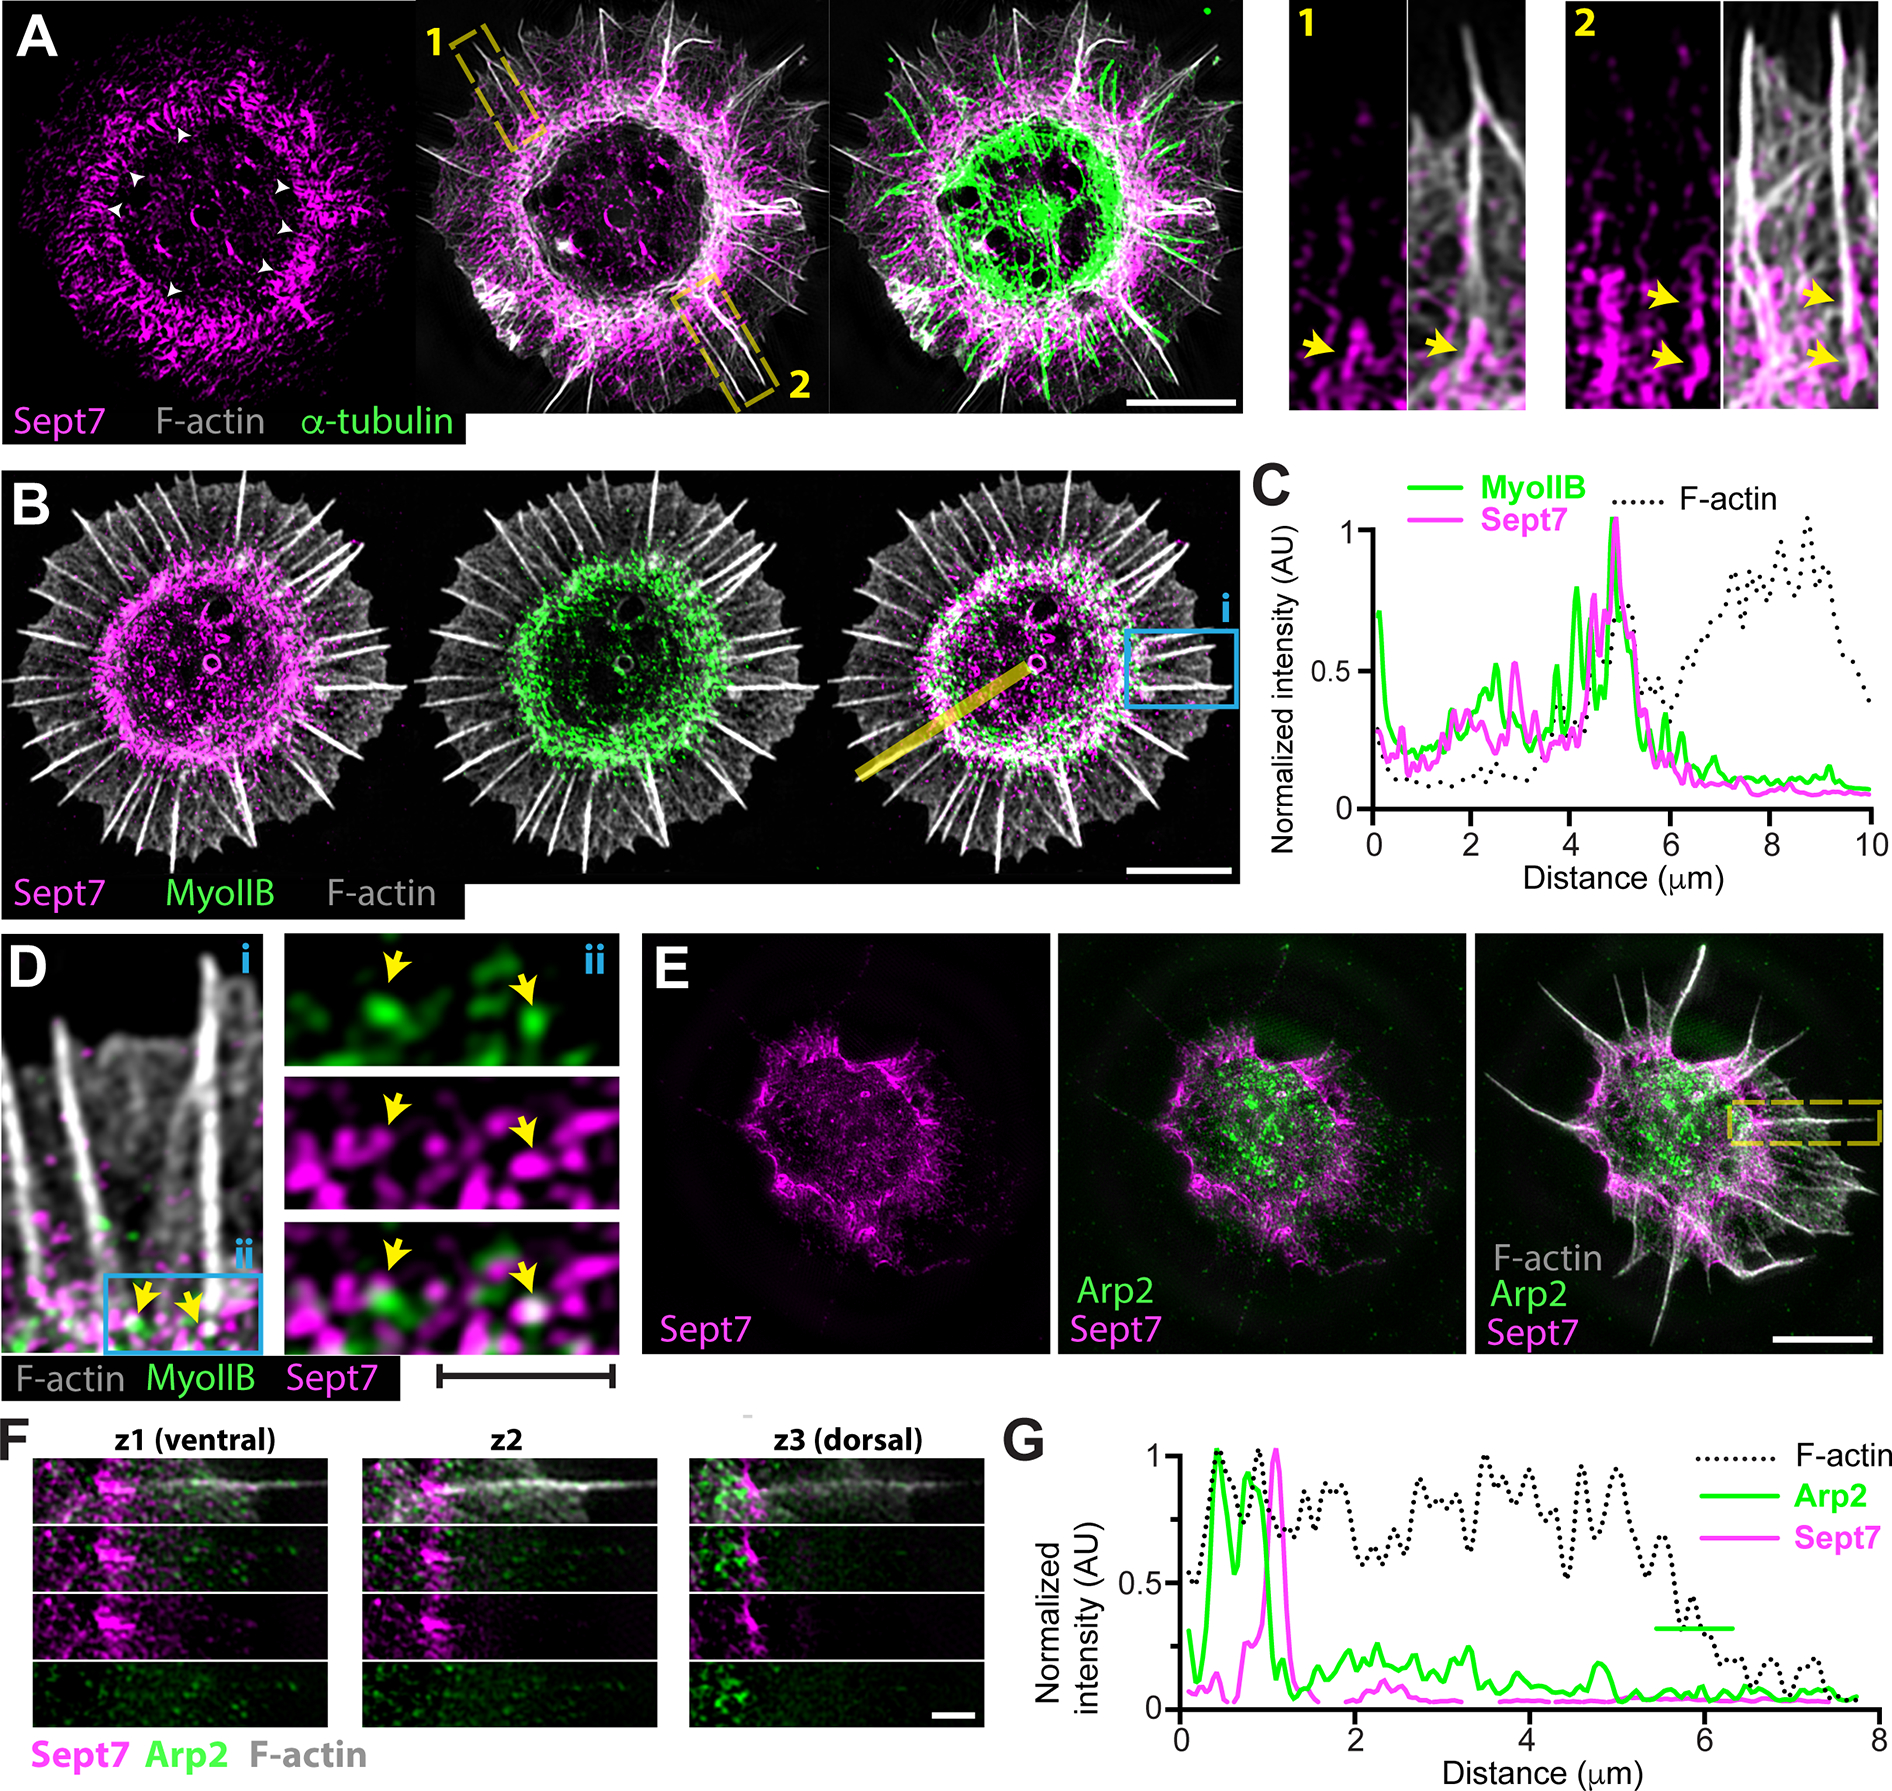
(A) Structured illumination microscopy (SIM) images of rat hippocampal neuron (DIV0) stained for Sept7, F-actin (phalloidin) and α-tubulin. White arrowheads point to spoke-like curve linear fibers with an orthogonal orientation to the inner perimeter of the soma. Insets show in higher magnification the localization of Sept7 (arrows) at the base of filopodial actin bundles. Scale bar, 5 μm.
(B-C) Super-resolution SIM images (B) of rat hippocampal neuron (DIV0) stained for Sept7, myosin IIB, and F-actin (phalloidin). Intensity profile plot (C) shows the fluorescence intensity levels of Sept7, myosin IIB and F-actin across the yellow line from the center to the periphery of the neuron. Scale bar, 5 μm.
(D) A selected region (i) from panel B is shown in higher magnification, and outlined area (ii) shows myosin IIB and Sept7 overlap at the base of filopodial actin bundles. Scale bar, 1 μm.
(E-G) SIM image of rat hippocampal neuron (DIV0) stained for Arp2, Sept7 and F-actin (phalloidin; E). Optical sections from the ventral, medial and dorsal sides of an outlined filopodial actin bundle are shown in higher magnification (F). Fluorescence intensity plot (G) shows diminution of Arp2 fluorescence at the region of Sept7 localization at the base of filopodial actin. Line-scan quantification was performed in the optical section (z3) with the highest enrichment of Arp2 at the base of the outlined filopodial actin bundle. Scale bars, 5 μm (E) and 1 μm (F).
See also Figure S1.
In contrast to hitherto known mammalian septin networks, which are largely integrated with the microtubule and actin cytoskeleton, the circumferential septin was positionally and structurally distinct (Figure 1A). We observed, however, regions of Sept7 colocalization with the proximal ends of filopodial actin bundles (Figure 1A, arrows). To determine whether the circumferential septin network demarcated or colocalized with any actin-binding proteins, we stained for the non-muscle myosin II, which is a known septin-interacting protein, and Arp2/3 which nucleates the actin filaments of the peripheral lamellae. Strikingly, myosin IIB localized as a circumferential band of short fibers and puncta, which overlapped with the septin network (Figure 1B). The myosin IIB and septin networks were interwoven, and myosin IIB overlapped and partially colocalized with Sept7 at the base of filopodial actin bundles (Figure 1C–D). In contrast to myosin II, Arp2 did not have a circumferential pattern. Patches of Arp2 puncta localized to the posterior of the septin network and along the central area of the soma (Figure 1E). In the circumferential septin network, Arp2 puncta were sparse and largely absent from or to the posterior of Sept7 accumulations at the base of filopodial actin bundles (Figure 1F–G). Thus, prior to neurite formation, immature neurons contain a circumferential septin network, which demarcates a zone of myosin II enrichment and Arp2 diminution at the base of the filopodial actin bundles of peripheral lamellae.
Sept7-depleted neurons have an enlarged soma with hyperextended lamellae and defective neurite outgrowth
To test whether the circumferential septin network has a role in neurite initiation and the morphogenesis of pyramidal neurons, we knocked down Sept7 expression by transfecting rat hippocampal neurons (DIV1) with Sept7-specific shRNAs for 48 h (Figure S2A–B). Sept7 depletion resulted in a dramatic enlargement of the soma without altering the size of the nucleus (Figure 2A–C, and S2C–E). The soma of Sept7-depleted neurons was characterized by hyper-extended spread-out lamellae, which contained multiple lamellipodia, indicative of unrestrained lamellipodial activity (Figure 2A). This phenotype was accompanied by aberrant neurite outgrowth. Neurites emerged mainly from the edges of lamellipodia that stretched out from the soma (Figure 2A; red colored neurites) instead of originating directly from the narrowing edges of a compact soma, which is the main mode of neurite outgrowth in control cells (Figure 2A, D). The lamellipodia-derived neurites of Sept7-depleted neurons were thinner than the somatic neurites of control cells, resulting in an overall decrease in the mean neurite width, which was measured at 5 μm from from the point of origin (Figure 2E). Although neurite length was not affected (Figure S2F), the total number of neurites per cell and the number of neurite branches increased in Sept7-depleted cells, which was consistent with an enhanced protrusive activity (Figure 2F–G). Sept7 knock-down phenotypes were rescued upon expression of GFP-Sept7, which was not targeted by the shRNA against the 3’ untranslated region of Sept7 (Figure S2D–E, and S2G–J). As predicted by its colocalization and co-depletion with Sept7, Sept5 knock-down resulted in similar phenotypes (Figure S3A–E), while Sept9 knock-down had no effect (Figure S3F–J).
Figure 2. Neurite morphology requires septin-dependent suppression of the lamellipodial protrusive activity of the soma.

(A) Rat hippocampal neurons (DIV1) were transfected with plasmids that co-express GFP and shRNAs (Sept7 3’-UTR or scrambled control) for 48 h, and stained for endogenous Sept7 (inset). An outlined region with neurites originating from hyperextended lamellipodia (pseudo-colored in red) is shown in higher magnification. Scale bars, 10 μm.
(B-C) Bar graphs show mean (± SEM) surface area of the soma (B) and the nucleus (C) of rat hippocampal neurons (n = 18) transfected with control and Sept7 shRNAs for 48 h. Data were analyzed with the Mann-Whitney U test.
(D) Quantification of percent of neurites per neuron (n = 40–46 neurons) that emerge from extended lamellipodial protrusions of the soma. Data were analyzed with a student’s test.
(E-G) Mean (± SEM) neurite width (E; n = 80–137), neurite number per neuron (F; n = 13–15), and neurite branches per neuron (G; n = 82–115). Data were analyzed from 13–16 neurons that were transfected with scrambled control or Sept7 shRNAs for 48 h, and were analyzed with the Mann-Whitney U test.
(H-L) Still frames from overnight phase-contrast (H, I; see also Videos S1 and S2) and DIC (J, K, L; see also Videos S3 and S4) time-lapse microscopy of living hippocampal neurons that were replated after transfection with scrambled control shRNAs for 48 h. Insets show GFP as a reporter of control (H-J) and Sept7 shRNA (K-L) expression. Lamellipodia (J, K) and dactylopodia-like (L) protrusions are outlined with a dashed line. Arrows point to the generation of a neurite from the tapered ends of a lamellipodium (J) and the conversion of a filopodium into a lamellipodium-like protrusion (K). Arrowhead points to a lamellipodium which does not resolve into a neurite. Scale bars, 10 μm.
(M) Rat hippocampal neurons (DIV1) were transfected with shRNAs for 48 h, trypsinized, replated and imaged live in 5 minute intervals with phase contrast or differential interference contrast (DIC) microscopy. Stacked bar graph shows the percentage of the protrusions of the soma, which were categorized into: i) stable and/or continuously growing neurites, ii) transient (growing/shrinking) neurites, which originate from the soma, iii) lamellipodia or lamellipodia with tapered ends (tapered lamellipodia), and iv) dactylopodia-shaped protrusions. The morphology of 93–125 neurites from 16–18 neurons was analyzed, and statistical significance was calculated with a chi squared test.
Statistics. *p<0.05, **p<0.01, ***p<0.001, ****p<0.0001, ns: non-significant
Using phase contrast or differential interference contrast (DIC) time-lapse microscopy, we imaged living neurons overnight to capture the generation and dynamics of nascent neurites. Consistent with previous studies, neurites originated from filopodia-shaped protrusions, which emerge directly from the soma, and underwent bouts of growth and shrinkage (transient neurites; Figure 2H, Video S1) or remained stable with an overall growth (Figure 2I, Video S2). Neurites also formed from tapering ends of lamellipodial protrusions (Figure 2J). In Sept7-depleted neurons, lamellipodial protrusions often did not resolve to neurites and nascent filopodia-shaped neurites converted to wider lamellipodia-like protrusions (Figure 2K, Video S3). In addition, we observed the formation of elongated protrusions with a lamellipodia-like width that resembled dactylopodia (Figure 2L; Video S4), the invasive lamellipodia-related protrusions of endothelial cells.37 Quantification of neurite phenotypes showed that Sept7 depletion reduced dramatically the percentage of stably growing neurites from 46% to 10%, and increased lamellipodia-like protrusion by more than two-fold (Figure 2M). These results indicated an amplification of lamellipodial activity in the somata of Sept7-depleted neurons. Therefore, the circumferential Sep7-containing network of septins provides a key function in balancing the activity of filopodial and lamellipodial protrusions for the formation of neurites of the right shape and origin.
The circumferential septin cytoskeleton promotes neurite formation by promoting myosin IIB localization and Arp2/3 exclusion at the base of filopodial actin bundles
Given that the circumferential septin network demarcates a zone of myosin II enrichment and Arp2/3 diminution at the base of the filopodial actin bundles of the soma, we hypothesized that it promotes neurite formation by spatially controlling myosin II and Arp2/3. We predicted that Sept7 knock-down may decrease myosin II localization and concomitantly increase Apr2/3 levels, which would result in engorgement of filopodia with branched actin and their widening into lamellipodia- or dactylopodia-like protrusions.38–41
Using super-resolution SIM, we examined myosin IIB and Arp2 localization in the lamellae of neurons, which were replated after a 48 h treatment with shRNAs (DIV3) to reinitiate neurite formation. Quantification of myosin IIB at the proximal end of filopodial actin bundles showed a reduction in the percentage of myosin IIB-positive filopodia in Sept7-depleted neurons (Figure 3A–B). In contrast to this reduction of myosin IIB, Arp2 levels were visibly elevated at the base of filopodial actin bundles (Figure 3C). In control neurons, Arp2 was predominately concentrated at lamellipodial protrusions (Figure 3C, arrowhead), and exhibited a sparse punctate localization at the basal regions and along the length of filopodia (Figure 3C, arrows). In Sept7 knock-down neurons, however, Arp2 accumulated at the proximal segments of filopodia, and was more abundantly present in filopodia (Figure 3C). This Arp2 enrichment was evident not only at filopodia that originate directly from the soma (Figure 3C), but also in filopodia that extend from the edges of lamellipodial protrusions (Figure 3D, arrow) and dactylopodia-like protrusions (Figure 3D, arrowhead), resembling the aberrant neurites of the enlarged somata (Figure 2A). Quantification of Arp2 levels in filopodia also showed an increase in Sept7-depleted neurons (Figure 3E).
Figure 3. Sept7 biases somatic protrusions toward filopodia by controlling myosin II and Apr2 levels at the base of filopodial actin bundles.

(A) SIM images of rat hippocampal neurons, which were transfected at DIV0 with plasmids that co-express GFP (inset) and scrambled control or Sept7 shRNAs for 48 h, trypsinized and replated for 2 h (scale bar, 5 μm). Outlined areas are shown in higher magnification (scale bar, 1 μm)
(B) Bar graph shows mean (± SEM) percentage of filopodial actin bundles (n > 40) per neuron with myosin IIB at their proximal basal ends. Filopodial actin bundles were analyzed from 10–11 neurons and statistical significance was derived using the unpaired t-test.
(C-D) SIM images of rat hippocampal neurons (DIV0), which were transfected with plasmids that co-express GFP (inset) and scrambled control (C) or Sept7 shRNAs (C, D) for 48 h, trypsinized and replated for 2 h. Outlined areas are shown in higher magnification. Arrows point to the base of filopodial protrusions with paucity and enrichment of Arp2 in control and Sept7-depletd neurons, respectively. Arrowhead points to a lamellipodial protrusion, which is enriched with Arp2. Examples of Arp2 accumulation in filopodia (D), which extend from hyper-extended lamellae (arrow), and a dactylopodia-like protrusion (arrowhead) is shown in higher magnification.
(E) Bar graph shows the mean fluorescence intensity per filopodial surface area (± SEM). Filopodia (n = 50) were quantified from ten different neurons and analyzed with the Mann-Whitney U-test.
(F-G) Still frames from TIRF time-lapse imaging of GFP-F-tractin in hippocampal neurons transfected with control scrambled (F; see also Video S5) and Sept7 shRNAs (G; see also Video S6). Inset images (grayscale) show the mCherry that co-expressed with shRNAs. Red arrowheads point to lamellipodial veil protrusions that extend over filopodia, which subsequently disassemble (G).
(H) Stacked bar graph shows the percentage of filopodia (n = 106–172) with lifetimes between 1–20, 21–40, 41–60, 61–120 and 121–300 seconds, which were quantified from 5 minute-long time-lapse movies of GFP-F-tractin in rat hippocampal neurons transfected with scrambled control and Sept7 shRNAs. Quantifications were performed in five neurons.
(I-J) Bar graphs show the mean (± SEM) lifetime of somatic filopodia (I; n = 106–172) and mean (± SEM) percentage of buckling filopodia per neuronal soma (J; n = 5). Quantifications were performed in five neurons from each condition, which co-expressed GFP-F-tractin and shRNAs, and imaged for 5 minutes by time-lapse TIRF microscopy. Data were analyzed with the Mann-Whitney U test (I) and unpaired t-test (J).
Statistics. **p<0.01, ***p<0.001, ****p<0.0001
We next used time-lapse TIRF imaging of living neurons, which expressed shRNAs and GFP-F-tractin, to analyze the dynamics of actin-based protrusions and determine how they are impacted by the effects of Sept7 depletion on myosin IIB and Arp2. Control neurons had well-defined and persistent filopodia (Figure 3F; Video S5), while Sept7-depleted neurons were characterized by filopodia, which overlapped with and/or were engulfed by veils of dynamic lamellipodia (Figure 3G, Video S6). The filopodia of Sept7-depleted neurons were more transient and often dissipated in the wake of veil-shaped lamellipodia (Figure 3G, arrowhead). In Sept7-depleted neurons, the number of veils extending over a filopodium was twice more (1.92 ± 0.23 vs. 0.88 ± 0.18 veils per filopodium; p = 0.004) and three-fold more frequent (0.72 ± 0.16 vs 0.23 ± 0.06 veil per filopodium per minute; p = 0.006). Sept7 depletion reduced the percentage of long-lived filopodia (61–120 s, 121–300 s) and increased filopodia with shorter lifetimes (1–20 s, 21–40 s; Figure 3H). Consistent with an overall reduction in the stability of filopodia, the mean life-time of filopodia decreased and a higher percentage of filopodia bent or buckled (Figure 3I–J). Because myosin II association with the base of filopodia augments their stability 40, these phenotypes were in agreement with myosin IIB reduction and Arp2/3 increase, which enhances lamellipodia activity at the edge of the neuronal soma.18,38,42
We reasoned that if the soma and neurite phenotypes were indeed due to elevated Arp2/3 and suppressed myosin II activities, they might be reversible by inhibiting Arp2/3-mediated actin polymerization or boosting myosin II contractility. We first targeted Arp2/3 activity by treating Sept7-depleted neurons for 24 h with low concentrations (1 μm) of the Arp2/3 inhibitor CK666.43 CK666 reversed the enlargement of the soma, the surface area of which was reduced to the levels of control neurons (Figure 4A–B). In addition, CK666 rescued neurite morphology as well as neurite number and branching (Figure 4C–E). Neurites emerged directly from a compact soma rather than the edges of hyperextend lamellipodia, and had similar levels of arborization with control neurons. We also targeted Arp2/3 activity with a non-pharmacological approach using a dominant-negative cortactin construct (DN-cortactin-GFP), which consists of the N-terminal Arp3-binding domain of cortactin.44 This construct has been previously shown to promote neurite consolidation by suppressing protrusive activity along the shaft of nascent neurites.26 Similar to CK666, DN-cortactin rescued the soma and neurite phenotypes of Sept7-depleted neurons (Figure 4F–J).
Figure 4. Inhibition of Arp2/3 activity rescues the morphology of the soma and neurites of Sept7-depleted hippocampal neurons.

(A) Images show filamentous actin (phalloidin) in rat hippocampal neurons, which were transfected with plasmids that co-express mCherry (inset) and shRNAs for 48 h, and treated with CK666 (1 μM) for 24 h.
(B-E) Bar graphs show the mean (± SEM) surface area of the soma (B), mean (± SEM) percentage of neurites per neuron which originate from hyperextended lamellipodia (C), mean (± SEM) number of neurites per neuron (D), and mean (± SEM) number of total neurite branches per neuron (E). All quantifications were performed in 15–17 rat hippocampal neurons, which were transfected with shRNAs on DIV1 for 48 h, and subsequently treated with CK666 (1 μM) for 24 h. Data were analyzed with one-way ANOVA and Tukey post-hoc test for pairwise comparisons.
(F) Images show MAP2 in rat hippocampal neurons, which were co-transfected with a plasmid that co-expresses mCherry and Sept7 shRNA, and GFP or GFP-tagged dominant negative cortactin (DN-cortactin-GFP).
(G-J) Bar graphs show the mean (± SEM) surface area of the soma (G), mean (± SEM) percentage of neurites per neuron which originate directly from the soma (H), mean (± SEM) number of neurites per neuron (I), and mean (± SEM) number of neurite branches per neuron (J). Quantifications were performed in neurons that expressed control scrambled shRNAs and GFP (n = 21), Sept7 shRNAs and GFP (n = 31), Sept7 shRNAs and DN-cortactin-GFP (n = 30). Data were analyzed with one-way ANOVA and Tukey post-hoc test for pairwise comparisons.
(K) Images show rat hippocampal neurons that express GFP or GFP-tagged constitutively active myosin II regulatory light chain (MRLC1-DD-GFP), and stained with phalloidin. Neurons were co-transfected with a plasmid that co-expresses mCherry and Sept7 shRNA, and GFP or GFP-tagged constitutively active myosin RLC (MRLC1-DD-GFP).
(L-M) Bar graphs show the mean (± SEM) surface area of the soma (L), and mean (± SEM) percentage of neurites per neuron (M) that originated directly from the soma. Quantifications were performed in rat hippocampal neurons that were transfected with control scrambled shRNA and GFP (n = 30–39), Sept7 shRNA and GFP (n = 81–83) and Sept7 shRNA and MRLC1-DD-GFP (n = 59–67). Data were analyzed with one-way ANOVA and Tukey post-hoc test for pairwise comparisons.
Statistics. *p<0.05, **p<0.01, ***p<0.001, ****p<0.0001, ns: non-significant
See also Figure S2.
We then tested if expression of the constitutively active di-phosphomimetic myosin regulatory light chain (MRLC1-DD-GFP) could rescue the phenotypes of Sept7 knock-down by enhancing myosin II contractility. MRLC1-DD did not reverse the hyperextended lamellae of the soma (Figure 4K–L), and the number of aberrant neurites that originate from the edges of spread out lamellipodia was marginally reduced (Figure 4M). Neurite numbers and branching, however, were reduced to control levels (Figure S2J–K). These data indicated that MRLC1-DD expression was not sufficient to reverse the growing lamellipodia of the soma, which is likely due to the reduction of myosin II heavy chains from the circumferential lamellae of the soma, but it was more effective in other regions of neurite growth where myosin II heavy chains were more abundant.
Collectively, these results indicate that during neuritogenesis, the circumferential septin cytoskeleton minimizes lamellipodial formation by Arp2/3-driven polymerization, and promotes the stability of filopodia by scaffolding myosin II at the base of their actin bundles. Thus, septins promote the generation and maturation of filopodia into neurites from a consolidated compact soma.
Septin function in early neuritogenesis is required for the development of a pyramidal soma with proper axodendritic orientation in vitro and in vivo.
Our results reveal that early neurite formation requires regulation of the balance of filopodial and lamellipodial protrusions by a somatic network of septins. However, is this regulation critical for the morphogenesis of a pyramidally shaped neuron with an apicobasal dendritic tree? To answer this question, we examined the morphology of neurons that were allowed to develop for nine days after transfection with shRNAs (Figure 5A). We first analyzed the shape of the soma. In control neurons, ~90% of somata were either triangular or quadrilateral, which are the predominate two-dimensional shapes of a pyramidal soma (Figure 5B). By contrast, only ~50% of somata had a triangular or quadrilateral in Sept7-depleted neurons (Figure 5B). The rest of the neurons had pentagonal and other irregular multi-angular shapes (Figure 5B). Consistent with this phenotype, the surface area and complexity factor of the soma (ratio of perimeter length to surface area) were higher in Sept7-depleted neurons (Figure 5C–D). Hence, the enlargement and spreading of Sept7-depleted neuronal somata, which takes place in the early stage of neurite formation, persists throughout morphogenesis, leading to neurons with non-pyramidal somata.
Figure 5. Septin-mediated control of early neuritogenesis is required for the development of a pyramidally shaped soma with proper axodendritic orientation.

(A) Images of rat hippocampal neurons (DIV10), which were stained for MAP2 and GM130 after transfection with plasmids expressing GFP and scrambled control or Sept7 shRNAs at DIV1. Arrow points to the principal dendrite (apical dendrite).
(B) Images show examples of GFP-expressing somata and their corresponding geometrical outlines in rat hippocampal neurons (DIV10), which were transfected with scrambled control shRNAs (triangle, quadrilateral) and Sept7 shRNAs (pentagonal, irregular) at DIV1. Stacked bar graph shows the percentage of neurons (n = 23–27) with triangular, quadrilateral or pentagonal/irregular somata. Data were analyzed with a chi-square test.
(C-D) Bar graphs show the mean (± SEM) surface area and complexity factor (ratio of perimeter length to surface area) of the soma in DIV10 neurons (n = 23–28), which were transfected with shRNAs at DIV1. Data were analyzed with the Mann-Whitney U test.
(E) Schematic shows the area, which is demarcated by a 45° angle left and right of the principal dendrite (apical dendrite), and was used for scoring dendrites proximal to the apical dendrite. Bar graph shows the mean (± SEM) percentage of total dendrites per neuron (n = 20) within a 45° angle from the principal dendrite of neurons, which expressed shRNAs/GFP for 9 days and stained for MAP2 at DIV10. Data were analyzed with the Mann-Whitney U test.
(F) Images of rat hippocampal neurons (DIV9), which were stained for MAP2 (dendrites) and ankyrin 3 (axon initial segment) after transfection with plasmids expressing GFP (inset) and scrambled control or Sept7 shRNAs at DIV1.
(G) Bar graph shows the mean (± SEM) degree of the angle between the axon and principal dendrite in neurons (DIV9; n = 15–16) which were transfected with scrambled control or Sept7 shRNAs at DIV1 for 9 days. Schematic shows axon positioning with respect to the principal apical dendrite in control (blue) and Sept7-depleted neurons (red). Data were analyzed with the Mann-Whitney U test.
Statistics. *p<0.05, **p<0.01, ****p<0.0001, ns: non-significant
See also Figure S4.
Given that the pyramidal soma generates a dendritic tree with an apical dendrite, which extends from the pyramidal apex, and basal dendrites that originate from the pyramidal base, we analyzed the morphology and orientation of dendrites. In 2D cell culture, pyramidal neurons possess a principal apical-like dendrite, which is characterized by a wider shaft and presence of the Golgi complex at the base of its shaft (Figure 5A, arrow).45 Using these criteria to identity the principal dendrite, we analyzed the spatial distribution of dendrites and the position of the axon. We measured the number of dendrites as the percentage of total dendrites localizing within a 45° angle clockwise and counter-clockwise of the principal dendrite (Figure 5E). Sept7 knock-down resulted in a ~30% increase in the percentage of dendrites, which are positioned within a 45° angle of the principal dendrite (Figure 5E). Thus, Sept7-depletion alters the spatial distribution of the dendritic tree.
We next examined whether Sept7 depletion impacts axon development and positioning. We quantified axon specification by analyzing the formation of a tau-1 positive neurite which has twice the length of any other neurite at 48, 72 and 96 h after transfection of DIV1 neurons with shRNAs. Although Sept7 depletion delayed axon specification, all neurons developed an axon after 96 h (DIV5; Figure S4A). However, and as previously reported,46,47 axons were shorter (Figure S4B). In addition, axons were positioned closer to the apical dendrite (Figure 5F). Quantification of the angle of axon orientation in neurons (DIV10) showed that the axon was oriented closer to the apical dendrite of Sept7-depleted neurons. Axons originated from the soma at a 64° angle from the apical dendrite, which was ~50% narrower than the axon-dendrite angle (134°) in control neurons. Collectively, these data show that in Sept7-depleted hippocampal neurons, defective neuritogenesis impairs the development of pyramidally shaped somata and the proper orientation of their axodendritic processes.
The phenotypes of Sept7 depletion in cultured hippocampal neurons indicate that Sept7 plays an important role in the early stages of neuronal morphogenesis in the developing brain. Because Sept7 knock-out causes early embryonic lethality in mice,48 we sought to test whether Sept7 depletion affects the development of cortical pyramidal neurons by knocking down Sept7 expression in mouse embryos. Using in utero electroporation, we delivered shRNAs into the layer II/III of the developing neocortex of murine E15.5 embryos, and analyzed the effects after seven days in the cortex of P3 animals. At this stage, cortical pyramidal neurons have migrated from the ventricular zone to the cortical plate (CP), and developed apical dendrites and axons, which are oriented toward and away from the CP, respectively (Figure 6A–B). Consistent with the phenotype of enlarged somata in cultured hippocampal neurons, we found Sept7 depletion altered the in vivo morphology of mouse cortical neurons, which exhibited enlarged lamellipodia- and dactylopodia-like protrusions (Figure 6B; see arrowheads in regions I and II). The mean surface area of these neurons was markedly increased (Figure 6C), and their shape was more contorted and irregular in comparison to control neurons which had primarily triangular or quadrilateral shapes (Figure 6D). In Sept7-depleted neurons, apical dendrites often emanated from wider lamellar extensions, which increased their width (Figure 6E), and were characterized by a higher incidence of kinks and bends (Figure 6F; see also arrow in Figure 6, region III). In addition to these morphological phenotypes, Sept7-depleted neurons were abnormally oriented, assuming positions that were more in parallel than orthogonal to the CP (Figure 6B, see arrow in region I). We quantified this phenotype by measuring the angle between the axis, which is orthogonal to the pial surface, and the long axis of the neuronal soma or the linear vector that is best aligned with the proximal segment of the apical process (Figure 6G). In Sept7-depleted neurons, neuronal somata and apical dendrites were less orthogonally oriented to the pial surface (Figure 6H–I). Analysis of neuronal distribution in earlier stages of cortical development (E18.5) did not reveal any defects in neuronal migration (Figure S5A–B). However, migrating neurons had larger cell bodies with leading processes, which were morphologically altered (Figure S5C–E). Similar to the apical dendrites of the cortical neurons in P3 mice, leading processes were wider and more kinked (Figure S5F–G). These in vivo defects in the morphology and orientation of mouse cortical neurons, which resembled the phenotypic deficits of Sept7 depletion in rat hippocampal neurons, demonstrate that the septin cytoskeleton has a conserved function in the morphogenesis of pyramidal neurons independently of species and brain region.
Figure 6. Sept7 depletion alters the morphology and orientation of pyramidal cortical neurons in the developing mouse neocortex.

(A-B) Images show GFP, a marker of shRNA expression, in cortical brain sections of mice (P3) after in utero electroporation of plasmids encoding for GFP and scrambled control (A) or Sept7 shRNAs (B) into layer II/III of E15.5 embryo brains. Selected regions (I, II, III) are shown in higher magnification. Arrowheads (B, regions I and II) point to enlarged somata with extended lamellipodia-like protrusions. Pial surfaces are outlined with dotted lines. Arrows point to a neuron with its soma oriented parallel to the pial surface (B, region I) and with a bend in its apical dendrites (B, region III). Scale bar, 50 μm.
(C-D) Bar graphs show the mean (± SEM) surface area of the soma (C) and the percentage of distribution of neurons (D) with somata of triangular/oval, quadrilateral, and pentagonal or irregular shapes. Analysis was performed in neurons (n = 26) from the brains of three P3 mice, which were in utero electroporated (E15.5) with scrambled control or Sept7 shRNAs. Statistical analysis was performed with an unpaired t-test (C) and chi-squared test (D).
(E-F) Bar graphs show the mean (± SEM) width of apical dendrite (E; n = 26) and number of apical dendrite bends per μm length in neurons (F; n = 25) from brains of P3 mice, which were transfected with scrambled control or Sept7 shRNAs at E15.5. Quantifications were performed from three different mice and data were analyzed with the Mann-Whitney U-test (E) and unpaired t-test (F).
(G) Schematic depicts the quantification of the orientation of the apical dendritic process with respect to the orthogonal apicobasal axis of the mouse neocortex. Using the horizontal axis of the pial surface as a reference, an orthogonal line (red) was drawn to define the 0° degree point from which the angle with the axis of the apical dendrite is measured. Orientation of the soma was similarly quantified by measuring the angle between the long axis of the soma and the orthogonal axis of the neocortex.
(H-I) Polar histograms show the distribution of the orientation of the long axis of neuronal somata (H) and apical dendrites (I) with respect to the orthogonal axis of the neocortex – angle between the long axis of the soma and the apicobasal orthogonal axis. Negative and positive values correspond to angles left and right of the orthogonal axis, respectively. Bar graphs show the mean (± SEM) angle of deviation from the orthogonal axis irrespective of left/right orientation. Quantifications were performed from the brains of three different mice (n = 25 neurons). Data were analyzed with an unpaired t-test.
Statistics. *p<0.05, ***p<0.001, ****p<0.001
See also Figure S5.
Discussion
Neuronal morphogenesis and the establishment of neuronal circuits begins with the formation of neurite processes and their differentiation into axons and dendrites. Elucidating the mechanisms of neurite initiation is key for understanding and treating a variety of neurodevelopmental and mental health disorders (e.g, autism, schizophrenia), which arise from aberrations in neurite abundance, morphology and distribution.3–6 Despite advances in the formation of filopodia, which are the precursors of neurites, it is poorly understood how neuronal somata develop a pyramidally shaped organization with neurites that emerge from the vertices of narrowing cell edges.
Spatial control and tuning of the contractile and protrusive activities of the actin cytoskeleton is of key importance to neuritogenesis. In early stages of neurite formation, the yin and yang of filopodia and lamellipodia is evident by the shift of balance between these two protrusion types in phenotypes of proteins with roles in actin polymerization and organization.7,16 It is poorly understood, however, how filopodial and lamellipodial activities are balanced - a problem that is compounded by filopodia forming within the actin networks of lamellipodia.49 Suppression of protrusive activity along the length of growing neurites, and a competition between myosin II and Arp2/3 activity in growth cones suggests that protrusion and contractility are similarly balanced in the soma during neurite budding.26,38,39,42 Here, we discovered a novel cytoskeletal network, a circumferential septin wreath-like meshwork, which controls contractility and protrusion in the soma by differentially regulating the localization of myosin II and Arp2/3 at the base of nascent neurites.
Septins are essential components of neuronal morphogenesis with roles in axodendritic development and the formation of axon branches, and dendritic spines.32,33 In differentiating neural crest cells, septins determine the cortical sites of neurite re-emergence after mitosis, but how septins function in neurite initiation is not understood.34 In pyramidal neurons, previous work showed that Sept7 depletion stunts axodendritic growth and arborization, but Sept7 was targeted after neurite formation (DIV4, stage 3 neurons).36,46,50 In our studies of stage 1 (DIV0) neurons, we found a filamentous Sept5/7/11 network, which is the first of its kind in overall organization and position with respect to the microtubule and actin networks. Positionally, it bears some similarity to septins localizing along the contractile transverse actin arcs of contact-naïve and migrating epithelia.51 The network consists of discontinuous curvilinear filaments of variable size and orientation. Preferential association of septins with domains micron-scale membrane curvature raises the possibility that the filaments of the wreath-like network assemble on the curvatures of the nuclear and ER membranes, and the base-neck of plasma membrane protrusions.36,47,50,52
Septins have evolutionarily conserved functions as scaffolds and barriers that selectively regulate the localization of a diversity of proteins.29,53 In the early stages of neurite formation, the septin network demarcates and overlaps with a meshwork of myosin IIB filaments and puncta, which are tightly interwoven with septins. Our results indicate that the circumferential septin network provides a scaffolding function for the localization of myosin IIB at the base of filopodia, which is in agreement with previous findings of Sept7 and Sept2 interaction with the myosin II heavy chain.54,55 Partial overlap of the septin and myosin II networks, however, suggests that the scaffolding function of septins is through intermittent contacts, which provide a long-range support in the position and contraction of the actomyosin network by enhancing its overall connectivity. In Sept7-depeleted neurons, reduction of myosin II from the base of filopodia is also consistent with diminished filopodia stability.39–41 The latter might be due to diminished crosslinking of filopodial actin filaments and/or weaker adhesion of filopodia to the extracellular matrix (ECM), which could result from a defective actin clutch at focal adhesions due to reduced myosin II-dependent actin flow and mechanotransduction.40,56
In Sept7-depleted neurons, reduction of myosin II from the base of filopodial actin could impact the localization and function of other actin-binding proteins such as cofilin, which associates with the proximal ends of filopodia and competes with myosin II for actin binding.57–59 Loss of myosin II may increase the levels of cofilin at the base of filopodia, which could be responsible for the higher incidence of neurite bending or buckling at the cofilactin/actin boundary.57,60 In migrating cells, Sept7 over-expression correlates with increased levels of phosphorylated cofilin, suggesting that Sept7 knock-down may reduce the phosphorylation of cofilin and enhance its severing activity.61 However, F-actin severing by cofilin promotes neuritogenesis by enabling retrograde actin flow and microtubule protrusion.24
The circumferential septin network appears to suppress Arp2/3 localization and activity at the base of filopodia. Septin recruitment to internalized Shigella flexneri bacteria and budding vaccinia viruses correlates spatiotemporally with lack of actin tail formation,62,63 which depends on Arp2/3, but hitherto there is no evidence for direct inhibition of Arp2/3 activity or Arp2/3-actin binding by septins. On the contrary, Sept6 promotes the Arp2/3-mediated transition of actin patches to filopodia by aiding the recruitment of cortactin in the axons of sensory neurons.47 We were unable to detect Sept6 at the Sept5/7/11 circumferential network, which is likely due to Sept11 being the predominate subunit of the Sept6 family and therefore, taking the position of Sept6 in the septin protomers.64 We posit that Sept7 functions differently in complex with Sept5/11 in murine pyramidal neurons than its previous role with Sept6 in chick dorsal root ganglia. It is plausible that Sept5/7/11 complexes compete with Arp2/3 for binding to actin filaments, inhibit the binding of Arp2/3 activators and/or spatially control the levels of profilin-actin, which inhibits the Arp2/3 complex.65,66 Alternatively, Sept7 may indirectly suppress Arp2/3 through myosin II as recently proposed for the formation of dactylopodia in endothelial cells.37 In this scenario, downregulation of Arp2/3 would be the result of feedback loop inhibition by the β-PIX/Rac pathway, which is triggered by an upregulation of focal adhesion maturation due to the enhanced mechanotransduction by myosin II at the base of filopodia.37,40
Neurite morphogenesis is accompanied by microtubule sliding and entry into membrane protrusions.8,16,27 In sensory neurons, Sept7 promotes microtubule entry into axonal filopodia,47 and in pyramidal neurons, Sept7 scaffolds the α-tubulin deacetylase HDAC6 controlling the levels of microtubule acetylation, which impacts axodendritic growth.46 The circumferential septin network localizes at the periphery of the microtubule network of the soma, and overlaps only with “pioneering microtubules” that enter into the peripheral lamellae. Although we cannot exclude the possibility that Sept5/7/11 has a role in microtubule targeting to nascent neurites, our findings are most consistent with a function in the consolidation of the soma through suppression of Arp2/3 and lamellipodial activity.
Septin-mediated control of protrusive activity is critical not only for a pyramidally shaped soma, but also for the spatial orientation of neurites. In cultured rat hippocampal neurons, Sept7 depletion altered the distribution of dendrites with respect to the principal apical-like dendrite. The distribution of the dendritic tree shifted closer to the principal dendrite, which might be due to the emergence of multiple neurites from a hyper-extended lamellipodial protrusion. In the developing cortex of mouse embryos, neuronal somata were similarly enlarged with an apically-oriented neurite, which was altered in morphology and orientation. Despite this phenotype, neuronal migration was not ostensibly impacted. We posit that translocation of neuronal somata along radial glia compensates for and/or is not affected by the morphology of the leading process. Alternatively, morphogenesis of the apical dendrite might be mechanistically independent of neuronal migration.
In sum, the somata of pyramidal neurons contain a hitherto unknown cytoskeletal network of septins (Sept5/7/11), which controls the balance of lamellipodial and filopodial protrusions during neurite initiation – a crucial morphogenetic step in the development of pyramidal neurons. Our results have implications for the pathology of autism spectrum and mental health disorders. Sept7 is directly phosphorylated by the thousand and one amino acid protein kinase 2 (TAOK2), an autism susceptibility and schizophrenia risk factor.67 Sept5 maps to the 22q11.2, a chromosomal locus with deletions in autism spectrum disorders and schizophrenia, and both SEPT5 and SEPT11 are upregulated in the brains of patients with schizophrenia and bipolar disorder.68–70 Thus, aberrations in the septin network and its functions may underlie the developmental deficits of neuritogenesis. Future work will explore this link, offering new insights into the pathogenesis and treatment of autism spectrum disorders and/or schizophrenia.
STAR Methods
Resource availability
Lead contact
Requests for further information, resources and/or reagents should be made to the lead contact: Dr. Elias Spiliotis (ets33@drexel.edu)
Materials availability
Plasmids generated in this study will be made available on request, if not available at Addgene, but we may require a payment and/or a completed materials transfer agreement if there is potential for commercial application.
Data and code availability
All data reported in this paper will be shared by the lead contact upon request.
This paper does not report original code.
Any additional information required to reanalyze the data reported in this paper is available from the lead contact upon request.
Experimental models and subject details
Primary neuronal cultures and mouse lines
Primary rat embryonic hippocampal neurons were derived from hippocampi that were isolated from the brains of mixed sex embryos, which were taken from timed pregnant Sprague-Dawley rats at 18 days of gestation. Fresh hippocampi were purchased from Transnetyx Tissue (BrainBits) or neurons were purchased in culture from the Neuron Culture Service Center (University of Pennsylvania). Neurons from whole hippocampi were obtained using 2 mg/mL Neuropapain in Hibernate minus Calcium media (Transnetyx Tissue) according to BrainBits neuron dissociation protocol. Neurons were cultured on surfaces coated with 1 mg/mL poly-L-Lysine (Peptides International) in Neurobasal medium supplemented with 2% B27 (ThermoFischer), and maintained at 37°C in a incubator supplemented with 5% CO2. Neurons were plated on 12 mm round glass coverslips (Belco Glass), which were placed in 24-well polystyrene dishes (Corning), at a density of 60,000 cells per well. For time-lapse microscopy, neurons were plated on 35 mm polystyrene dishes (VWR) at a density of 0.75–1.5 million cells per dish.
ICR mice were obtained from Taconic Inc, and timed pregnant mice were obtained by setting up the mating in the animal facility. Primary mouse cortical neurons were isolated at stage E15 as previously described.71 Following euthanasia of the dam, the embryos were quickly removed from the pregnant mouse. Embryos were then transferred to 1x Ca2+/Mg2+-free Dulbecco’s PBS (Cenesee Sci., D-PBS). Dissection of the cerebral cortex was followed by treatment with 0.01% Trypsin in D-PBS for 5 minutes at room temperature. The trypsin was then inactivated by adding 100 μm of 50 mg/ml bovine serum albumin. Dissociated neurons were seeded onto coverslips coated with 100 ng/ml poly-D-lysine hydrobromide (MW 52 kDa; Alamanda Polymers) and 100 ng/ml mouse laminin (Corning 354232) in NeuroBasal medium containing 1% penicillin/streptomycin (Corning), 1% GlutaMAX (Gibco), and 1x B27.
Method Details
Transfection and in utero electroporation
Cultured neurons were transfected at DIV0 or DIV1 using Lipofectamine 3000 (ThermoFisher). All DNAs used for transfection were prepared using an Endotoxin-free plasmid isolation kit (Omega Bio-tek). Unless otherwise noted, cells were transfected for 48 hours before fixation or imaging. To reinitiate neurite formation, neurons were detached from their culture dish after 48 h of transfection using 0.25% Trypsin in sterile PBS, and replated in 4-chamber glass bottom 35 mm dishes (Cellvis) coated with 1 mg/mL poly-L-lysine at a density of 60,000 cells per well.
In utero electroporation was performed as described previously.72 Following anesthesia of pregnant dams, the uterine horns were exposed, and one to two microliters of plasmid (1–2 μg/μl) was injected into the lateral ventricle of the E15.5 embryo brain using a pulled-glass micropipette. Using a Nepa GENE CUY21 electroporator, three pulses of 32 V were applied to the embryonic brain using tweezers electrodes. The uterine horns were placed within the abdomen, and pups were allowed to recover and mature. E18.5 or P3 brains were dissected for morphological analysis.
Plasmids and Cloning
To deplete embryonic rat hippocampal neurons of Sept7, an shRNA was generated to target the 3’ UTR of the rat Sept7 mRNA. Primers encoding the shRNA sequence were ordered from IDT (Forward:5’-GATCCCCGGAAAGTCGACATTAATCATTCAAGAGATGATTAATGTCGACTTTCCTTTTTA-3’, Reverse: 5’-AGCTTAAAAAGGAAAGTCGACATTAATCATCTCTTGAATGATTAATGTCGACTTTCCGGG-3’) and were ligated and inserted to the p-Super EGFP backbone purchased from Addgene using the BglII and HindIII cloning sites. The rat Sept7 3’UTR shRNA scramble GFP construct was made using a scrambled version of the shRNA sequence, Forward: 5’-GATCCCCATGACTAGATTGATTACAATTCAAGAGATTGTAATCAATCTAGTCATTTTTTA-3’, Reverse: 5’-AGCTTAAAAAATGACTAGATTGATTACAATCTCTTGAATTGTAATCAATCTAGTCATGGG-3’. The mCherry version of these rat Sept7 3’UTR shRNA constructs was made by removing the GFP tag using the AgeI and BsrG1 cloning sites, and isolating and inserting the mCherry tag digested similarly into the pSuper backbone. Plasmid sequences were confirmed by sequencing (Genewiz).
For in vivo mouse experiments, shRNAs were cloned into the PSCV2-venus plasmid.71,73 The plasmid was digested with HindIII and BamHI, and the oligonucleotides containing the Sept7 3’ UTR shRNA targeting sequence, (Forward: 5’-GATCCGATAAATTGCCATAATATGTTCAAGAGACATATTATGGCAATTTATCTTTTTGGAAA-3’, Reverse: 5’-AGCTTTTCCAAAAAGATAAATTGCCATAATATGTCTCTTGAACATATTATGGCAATTTATCG-3’), or the scramble targeting sequence, (Forward: 5’-GATCCATGACTAGATTGATTACAATTCAAGAGATTGTAATCAATCTAGTCATTTTTTGGAAA-3’, Reverse: 5’-AGCTTTTCCAAAAAATGACTAGATTGATTACAATCTCTTGAATTGTAATCAATCTAGTCATG-3’) were synthesized and purchased by Integrated DNA Technologies. ShRNA oligos were annealed and then ligated to the digested pSCV2-venus plasmid. Plasmids purified with a miniprep kit (Zippy Plasmid Miniprep, Zymo Research) and were evaluated by sequencing (ASENTA).
Sept5 knock-down was performed with GFP-expressing pSUPER vectors, which were the kind gift of Dr. Matthew Rasband74 and contained an shRNA sequence for Sept5 (5ʹ-GCGGTGAACAACTCTGAATGT-3ʹ) or P. pyralis luciferase (control; 5ʹ-CGCTGAGTACTTCGAAATGTC-3ʹ). Sept9 (isoform 1) was targeted with pSUPER vectors with scramble (5’-AGAACGACCGTATGTAATC-3’) or Sept9 shRNA (5’-GACCGACTGGTGAACGAGAAGTT-3’) which were previously constructed and used.75
The plasmid encoding a dominant negative cortactin, DN-Cortactin-HA,44 was created using only the N-terminal acidic domain sequence as a G-Block (IDT) with the sequence: 5’-TAATACGACTCACTATAGGGAGACCCAAGCTGGCTAGCGATGTATCCATATGATGTTCCAGATTATGCTATGTGGAAAGCTTCTGCAGGCCATGCTGTGTCCATCACCCAGGATGATGGGGGAGCCGATGACTGGGAGACTGACCCTGATTTTGTGAACGATGTGAGTGAAAAGGAACAGAGATGGGGCGCCAAAACCGTGCAGGGATCGGGGCACCAGGAACACATCAACATACACAAGCTTCGAGAGAATGTCTTCCAAGAACACCAGACACTCAAGGAGAAGGAGCTGGAAACGGGACCCAAGGCTTCCCATGGCTATTAAGGATCCACTAGTCCAGTGTGGTGGAATTCTGCAGATATCCAG −3’, which was inserted into pcDNA3.1(+) IRES GFP (Addgene) by digesting the backbone using NheI and BamHI.
The plasmid encoding EGFP-F-Tractin (EGFP-ITPKA) was a kind gift from Dr. Tanya Svitkina and was created as described previously.76 The plasmid encoding human constitutively active myosin regulatory light chain (pEGFP-MRLC1 T18D, S19D) was purchased from Addgene (plasmid # 35682).77 Rat EGFP-Sept7 was the kind gift of Dr. Smita Yadav, and was made as previously described.67
Fixation and staining
Rat hippocampal neurons were fixed for 10 minutes with PBS buffer containing 4% paraformaldehyde (PFA) and 4% sucrose, permeabilized with GDB (30 mM sodium phosphate pH 7.4, 0.2% gelatin, 450 mM NaCI) containing 0.01–0.05% Triton X-100 for 10 min, and blocked with GDB for an additional 20 minutes. Primary antibodies were diluted in GDB and spun at 50,000×g for 10 min at 4°C before adding on neurons. Primary antibodies were incubated at 4°C overnight. Secondary antibodies were also diluted in GDB, spun at 50,000×g before adding to neurons for 1 h at room temperature. Samples were mounted with FluorSave hard mounting medium (EMD Millipore). Mouse cortical neurons were fixed after 2 hours in culture with 4% paraformaldehyde at room temperature for 15 minutes, and washed with PBS. Subsequently, they were permeabilized and stained as aforementioned for the rat hippocampal neurons.
Electroporated mouse brains were fixed in 4% PFA in PBS overnight at 4°C, then cryoprotected in 25% sucrose in PBS for 48 hours at 4°C. The brains were embedded with an O.C.T. compound (Sakura). Cryosections of 60 μm thickness were cut using a cryostat (Microm HM 505N) and air-dried. The sections were washed three times in Tris-buffered saline, and stained with 600 nM 4’, 6-diamidino-2-phenylindole, dihydrochloride (DAPI). The sections were mounted on glass slides using 90% glycerol in PBS.
Imaging of Sept7 in brain cortical slices was performed by cryosectioning P0 wild-type (WT) mice brains at a thickness of 30 μm. After three washes in Tris-buffered saline (TBS), the sections were processed for antigen retrieval in 1X sodium citrate buffer at 95°C for 10 min. After permeabilization with 1% Triton X-100 in TBS, the brain sections were blocked with Block Ace (BUF029, Bio-Rad). The brain sections were then incubated with rabbit anti-Sept7 antibody (1:50, IBL) overnight at 4 °C, followed by FITC-conjugated donkey anti-rabbit IgG (Jackson ImmunoResearch Laboratories, 715-096-151) for 30 min at room temperature. Mouse anti-Tuj1 (1:200, 66375, Proteintech) and Cy5 conjugated donkey-anti-mouse IgG (705-095-147, Jackson ImmunoResearch Laboratories) were used to identify neurons. The sections were stained with 4’, 6-diamidino-2-phenylindole (DAPI, 600 nM), followed by embedding using 90% glycerol/phosphate buffered saline.
Antibodies and Reagents
See also the Keynote Resources Table. Neurons were immunostained with the following antibodies: mouse anti-α-tubulin (DM1α, 1:500; SIGMA), rabbit anti-SEPT7 (1:500; IBL America), rabbit anti-Myosin IIB (1:500, Covance), rabbit anti-Arp2 (1:100, ECM Biosciences), chicken anti-MAP2 (1:2000; EMD Millipore), mouse anti-Tau1 (1:500, EMD Millipore), mouse anti-GM130 (Golgi, 1:200, BD Transduction), mouse anti-Ankryn 3 (1:100, Novus Biologicals), mouse anti-SEPT5 (1:500, Santa Cruz), rabbit anti-SEPT11 (1:500, Millipore), mouse anti-TUJ1 (Proteintech). F(ab’)2 fragment affinity-purified secondary antibodies (1:200) were purchased from Jackson ImmunoResearch Laboratories and included donkey anti-mouse, -rabbit, and -chicken antibodies conjugated with AMCA, Alexa488, Alexa594 or Alexa647. To co-stain for Sept7 and MyoIIB and Arp2, rabbit anti-MyoIIB or Arp2 primary antibody was conjugated with anti-rabbit Alexa Fluor 594 using the Zenon Rabbit IgG Labeling Kit (Thermo Fisher Scientific). To stain actin, phalloidin conjugated with iFluor 647 (1:200, Abcam) was used.
KEY RESOURCES TABLE – Radler et al.
| REAGENT or RESOURCE | SOURCE | IDENTIFIER |
|---|---|---|
| Antibodies | ||
| Rabbit anti-Septin 7 | IBL | 18991 |
| Mouse anti-alpha tubulin | Sigma | T6199 |
| Chicken anti-Map2 | Millipore | AB5543 |
| Mouse anti-Tau1 | EMD Millipore | MAB3420 |
| Rabbit anti-Myosin IIB | Covance | PRB-445P |
| Rabbit anti-Arp2 | ECM Biosciences | AP3861 |
| Mouse anti-Sept5 | Santa Cruz | Sc-20040 |
| Rabbit anti-Sept11 | Millipore | ABN1342 |
| Mouse anti-GM130 | BD Transduction | 610823 |
| Mouse anti-Ankryn3 | Novus Biologicals | NBP2-59310 |
| Mouse anti-Tuj1 | Proteintech | 66375 |
| Fluorescein (FITC) AffiniPure F(ab’)2 Fragment Donkey Anti-Mouse IgG (H+L) | Jackson ImmunoResearch | 715-096-151 |
| Cy5 AffiniPure Donkey Anti-Mouse (H+L) | Jackson ImmunoResearch | 715-175-150 |
| Alexa Fluor 488 AffiniPure F(ab’)2 Fragment Donkey Anti-Mouse IgG (H+L) | Jackson ImmunoResearch | 715-546-150 |
| Alexa Fluor 488 AffiniPure F(ab’)2 Fragment Donkey Anti-Rabbit IgG (H+L) | Jackson ImmunoResearch | 711-546-152 |
| Alexa Fluor 594 AffiniPure F(ab’)2 Fragment Donkey Anti-Mouse IgG (H+L) | Jackson ImmunoResearch | 715-586-150 |
| Alexa Fluor 594 AffiniPure F(ab’)2 Fragment Donkey Anti-Rabbit IgG (H+L) | Jackson ImmunoResearch | 711-586-152 |
| Alexa Fluor 647 AffiniPure F(ab’)2 Fragment Donkey Anti-Mouse IgG (H+L) | Jackson ImmunoResearch | 715-606-151 |
| Alexa Fluor 647 AffiniPure F(ab’)2 Fragment Donkey Anti-Rabbit IgG (H+L) | Jackson ImmunoResearch | 711-606-152 |
| AMCA AffiniPure F(ab’)2 Fragment Donkey Anti-Mouse IgG (H+L) | Jackson ImmunoResearch | 715-156151 |
| AMCA AffiniPure F(ab’)2 Fragment Donkey Anti-Chicken IgY (IgG) (H+L) | Jackson ImmunoResearch | 703-156-155 |
| Alexa647 AffiniPure F(ab’)2 Fragment Donkey Anti-Chicken IgY (IgG) (H+L) | Jackson ImmunoResearch | 703-606-155 |
| Bacterial and virus strains | ||
| Dh5alpha competent cells | Made in Spiliotis lab | N/A |
| Chemicals, peptides, and recombinant proteins | ||
| CK666 | Sigma-Aldrich | SML0006-5MG |
| NeuroPapain | Fisher Scientific | NM100200 |
| Poly-L-Lysine | Peptides international | OKK-3056 |
| Poly-D-Lysine hydrobromide, MW=52,000 Da | Alamanda Polymers | N/A |
| 4’, 6-diamidino-2-phenylindole, dihydrochloride (DAPI) | Invitrogen | D1306 |
| Block Ace | Bio-Rad | BUF029 |
| Phalloidin-iFluor647 | Abcam | ab176759 |
| FluorSave | Millipore-SIGMA | 345789 |
| Critical commercial assays | ||
| Zenon Alexa Fluor 594 Rabbit IgG Labeling Kit | Thermo Fisher Scientific | Z25307 |
| E.Z.N.A. Endo-Free Plasmid DNA Midi Kit | Omega Bio-Tek | D6915-03 |
| Deposited data | ||
| Experimental models: Cell lines | ||
| Primary E18 rat hippocampal neurons | “Neurons R Us”: the neuron culture service center at the University of Pennsylvania | N/A |
| Primary E18 hippocampal neurons | E18 rat hippocampi from Transnetyx Tissue (BrainBits) | SDEHP |
| Primary E15.5 mouse cortical neurons | Brains from Taconic ICR mice | IcrTac:ICR |
| Experimental models: Organisms/strains | ||
| ICR mouse | Taconic | IcrTac:ICR |
| Oligonucleotides | ||
| shRNA for target sequence Sept7: GATAAATTGCCATAATATG | IDT | N/A |
| Non-targeting scrambled shRNA for target sequence Sept7: ATGACTAGATTGATTACAA | IDT | N/A |
| Truncated cortactin for dominant-negative effect: TAATACGACTCACTATAGGGAGACCCAAGCTGGCTA GCGATGTATCCATATGATGTTCCAGATTATGCTATG TGGAAAGCTTCTGCAGGCCATGCTGTGTCCATCAC CCAGGATGATGGGGGAGCCGATGACTGGGAGACT GACCCTGATTTTGTGAACGATGTGAGTGAAAAGGAA CAGAGATGGGGCGCCAAAACCGTGCAGGGATCGG GGCACCAGGAACACATCAACATACACAAGCTTCGA GAGAATGTCTTCCAAGAACACCAGACACTCAAGGA GAAGGAGCTGGAAACGGGACCCAAGGCTTCCCATG GCTATTAAGGATCCACTAGTCCAGTGTGGTGGAATT CTGCAGATATCCAG |
IDT | N/A |
| Recombinant DNA | ||
| Rat Sept7 3’ UTR shRNA GFP | This paper | N/A |
| Rat Sept7 3’ UTR shRNA scramble control GFP | This paper | N/A |
| Sept7 3’ UTR shRNA mCherry | This paper | N/A |
| Sept7 3’ UTR shRNA scramble control mCherry | This paper | N/A |
| Rat EGFP-SEPT7WT | Yadav et al.67 | N/A |
| DN-Cortactin-GFP | This paper | N/A |
| Mouse Sept7 3’UTR shRNA | This paper | N/A |
| Mouse Sept7 3’UTR shRNA scramble control | This paper | N/A |
| Mouse GFP Sept5 shRNA | Hamdan et al.74 | N/A |
| GFP-Luciferase control shRNA | Hamdan et al.74 | N/A |
| Rat Sept9 shRNA 2 GFP | Karasmanis et al.75 | N/A |
| Rat Sept9 shRNA scramble GFP | Karasmanis et al.75 | N/A |
| EGFP-F-tractin | Johnson et al.76 | N/A |
| Human pEGFP-MRLC1 T18D, S19D | Beach et al.77 | Addgene_35682 |
| Software and algorithms | ||
| Fiji (ImageJ) | NIH | https://imagej.nih.gov/ij/; RRID: SCR_002285 |
| Slidebook | 3i | https://www.intelligent-imaging.com/; RRID: SCR_014300 |
| GraphPad Prism | GraphPad | https://www.graphpad.com/scientific-software/prism/; RRID: SCR_0021798 |
Microscopy
Super resolution 3D structured illumination microscopy (SIM) imaging was performed with the OMX V4 microscope (GE Healthcare) using a 60X/1.42 NA objective, a z-step size of 0.125 μm and immersion oil with refractive index 1.514 (GE Healthcare).
Total internal reflection fluorescence (TIRF) imaging (20–60 frames per min) of live neurons was performed at 37°C using the TIRF module on the DeltaVision OMX V4 inverted microscope equipped with an Olympus 60x/1.49 objective and a temperature-controlled stage-top incubator. Images were acquired with sCMOS pco.edge cameras (PCO) and reconstructed with softWoRx software (Applied Precision).
Unless otherwise specified, neuronal images were obtained with a wide-field Zeiss AxioObserver Z1 inverted microscope equipped with a Zeiss 20X/0.8 dry objective, a 40X/1.2 NA water objective, a 63x/1.4 NA oil objective, a Hamamatsu Orca-R2 CCD camera and the Slidebook 6.0 software.
Overnight phase contrast or differential interference contrast microscopy (Figure 2J–N) was performed at 37°C, 5% CO2 using the Zeiss LSM700 or the Leica Stellaris 5 confocal microscopes, respectively.
Mouse brain sections were imaged using Leica TCS SP8 (Figure 6 and S5) or Leica Stellaris (Figure S1E) confocal microscopes. On the Leica TCS SP8 microscope, images were taken with a zoom in of 1.5X and a 20X objective. The 40–80 stacks were taken at an interval of 1.04 microns in the z-direction. On the Leica Stellaris microscope, images were taken with a zoom in of 2.5X and a 63X/1.4 NA oil objective. 10–20 stacks were taken at an interval of 0.2 microns in the z-direction.
Time-Lapse Imaging
Hippocampal neurons were transfected at DIV0 for 48 hours, trypsinized, and replated at a density of 60,000 cells per well on 4-chamber glass bottom 35 mm cell culture dishes (Cellvis) containing phenol red-free neurobasal media supplemented with 2% B27 (Invitrogen). Samples were placed on the microscope within 1 hour of plating and imaged for up to 12 hours to capture early neurite formation events.
For time-lapse TIRF microscopy (Figures 3F–G), neuronal medium was supplemented with 30 mM HEPES, and dishes were sealed using parafilm. Cells were imaged at 20 frames per second for 5 minutes.
For overnight phase contrast and DIC imaging (Figure 2H–L), samples were kept in an imaging chamber set to 37°C, 5% CO2. Neurons transfected with Sept7 shRNA or scrambled control were identified by fluorescence microscopy, and transfected cells were imaged using phase contrast (LSM700) or DIC (Leica Stellaris) at 5-minute intervals for 12 hours.
Quantification and statistical analysis
Quantifications of the surface areas of neuronal somata and nuclei
The area of neuronal somata was meausured in Fiji using the polygon selection tool, and manually drawing along the perimeter of the neuronal cell body. Selection of the cell body was guided by expression of GFP or mCherry fill from shRNA vectors. Cell bodies included all soma areas up to the neurite hillocks. Polygon selections were saved as ROIs, and the area and total length of the periphery was measured and recorded. Complexity factors were calculated by dividing the length of the perimeter by the total surface area. Nuclear areas were measured in Fiji using the Polygon selection tool and manually outlining nuclei guided by DAPI staining. Polygon selections were saved as ROIs, and the area was measured and recorded.
Neurite origin analysis and quantification
Neurite growth origin was used to determine whether neurites were growing from a tightly consolidated soma or from unconsolidated protrusions (e.g., hyperextended lamellipodia) of the soma. Neurites that originated from a consolidated soma were identified as those that emerged from smoothly curved regions of the soma, which were outlined by a compact actin (phalloidin) stain and sharp edges under phase contrast or DIC microscopy. Neurites that originated from lamellipodial protrusion or hyper-extended lamellae were identified as those that came from regions of the cell body with irregular and jagged curvatures, and protruded from cortical areas that lacked compact actin. Neurites bases were marked using the oval (compact somata) or rectangular (lamellipodial protrusions) selection tools in Fiji and saved as ROIs. The number of each type of neurite was recorded, and percentages for each were calculated based on the total neurites per cell.
Neurite number, width and branch quantification
Neurites were identified as any finger-like protrusions that originated from the neuronal soma or its lamellipodia and in fixed neurons contained microtubules. Neurites were counted by tracing them using the segmented line selection tool in Fiji and adding each neurite as an ROI. The total number of neurites per cell were counted and recorded.
Neurite branches were defined as any branch point on a neurite, and included primary, secondary, and tertiary branches. Branch points were counted manually and marked using the oval selection tool in Fiji and saved as ROIs. The total number of branch points was recorded for each neurite of a neuron, and the average number of branch points per neurite per neuron was derived by adding the total number of branches of all neurites and dividing by the number of neurites of a single neuron.
Neurite widths were measured using GFP or mCherry fill as a guide of membrane width. Using the straight line tool in Fiji, a 5 μm line was drawn from the neuronal cell body (base of the neurite hillock) distally along the neurite. Neurite width was measured using the straight line tool and drawing it orthogonally to the 5 μm marker. Width measurements were saved as ROIs, and their measurements were recorded.
Line scan quantifications
Line scans (Figure 1C, G) were used to generate plot profiles of the fluorescence intensity of Sept7 in relation to myosin IIB, Arp2, and actin (phalloidin) by drawing a 10 pixel-wide line from the center of the cell and saved as an ROI in the Fiji software. To export fluorescence intensity measurements, a plot profile was generated in Fiji using the Plot Profile plugin, which showed raw fluorescence intensity (measured as gray value) at increments of 0.4 microns. These measurements for generated for each channel in an image and exported to Excel. Fluorescence intensities were normalized to the maximum intensity of their respective protein by dividing each gray value by the maximum gray value. Ratio values were graphed using Graphpad/Prism 9.0.
In Figure 3E, Arp2 fluorescence intensity was quantified by drawing a 5-pixel width straight line along the length of the actin bundle of a filopodium from base to apex, and saved as ROIs. Fluorescence intensity of Arp2 and the area of the line were exported. Arp2 fluorescence intensity was divided by the surface area, and the values were plotted in GraphPad/Prism 9.0. Quantifications were performed in filopodia from ten different neurons.
Quantification of filopodia lifetime and buckling, myosin IIB levels and lamellipodial dynamics
Filopodia lifetime analysis (Figure 3H–I) was done manually using Fiji. Moving frame by frame, the segmented line tool was used to mark filopodia when they first appeared in movies, and saving those segmented lines as ROIs. After recording the collection of filopodia ROIs, each filopodia ROI was tracked for the entire duration of the movie (100 frames, 5 minutes), and we marked the frame at which a filopodium was no longer present as a distinct finger-like structure due to collapsing, retraction, engulfment, merging, or fanning. The frames of filopodial appearance and disappearance were used to calculate the lifetime in seconds for each filopodia. The buckling rate of filopodia (Figure 3J) was calculated by using the filopodia birth ROIs generated during filopodia lifetime analysis. A buckling event was defined as the bending and/or folding of a filopodium onto itself, followed by catastrophic collapse or resorption into the lamellipodial veils or ruffles of the neuronal cell edge. Filopodia with buckling events were calculated as the percentage of total filopodia of each neuron.
Localization myosin IIB at the base of filopodia (Figure 3B) was quantified in the Fiji software by first generating ROIs of filopodial actin bundles in images of phalloidin-stained neurons. This provided the total count of filopodia per cell. Using the oval selection tool, ROIs of myosin IIB densities that overlapped with the filopodia ROIs were generated and saved. The myosin IIB ROIs, which overlapped with filopodia, were then counted and divided by the total number of filopodia ROIs to derive the percentage of myosin IIB-positive filopodia.
Quantification of lamellipodial edge dynamics was performed from movies of neurons that expressed GFP-F-tractin (e.g., Videos S5–6). Individual filopodia were marked with the line tool as ROIs, and edge dynamics were tracked for each ROI. The number of events during which a lamellipodial edge or veil advanced along the length of a filopodial ROI were counted for the duration of the filopodium’s lifetime. The frequency of lamellipodial extensions per filopodium was derived by dividing the number of extension events by the lifetime of the corresponding filopodium. Quantification of lamellipodial extension events was performed for 6–13 filopodia per neuron, and the average number and frequency of extensions was derived for the filopodia of a single neuron. The mean (± SEM) number and frequency of lamellipodial extensions was calculated for six different neurons, statistical significance was derived with the Mann-Whitney U-test.
Quantification of axon specification, length and orientation
Axon specification and length (Figure S4) was quantified by first, identifying and marking axons as neurites which contained tau-1 and were at least twice as long as the length of any other neurites. The percentage of neurons with and without an axons was plotted (Figure S4A), and axon length (Figure S4B) was measured manually using the segmented line selection tool in Fiji. Selections were saved as ROIs, and the length was measured and recorded.
To determine the angle between the apical dendrite and axon (Figure 5F), DIV10 hippocampal neurons were stained with antibodies against MAP2, which was used to identify the apical dendrite, and Ankyrin 3 for identifying the axon initial segment. The apical dendrite was identified as the MAP2-positive dendrite with the widest shaft. After marking the center of the soma with the oval selection tool in Fiji, the angle tool of Fiji was used to draw a line from the distal end of the apical dendrite and the center of the soma. From there, the second vector of the angle was drawn to the distal portion of the marked AIS. This angle was saved as an ROI, measured and recorded.
Quantification of soma morphology and dendrite distribution in DIV10 hippocampal neurons
The soma of DIV10 neurons was outlined using the polygon selection tool in Fiji and the fluorescence of GFP, which was co-expressed with the shRNAs; GFP levels were adjusted to fully visualize the edges of the soma. Polygonal shapes were drawn over somata by drawing lines along the edges of the GFP fluorescence fill. Shapes were sorted based on the number of sides of each polygon (3, triangular; 4, quadrilateral; 5, pentagonal, >5, irregular) and somata were binned into each shape category. The percentage of each category was calculated by dividing the number somata per each category by the total number of neurons counted. The area of each soma and complexity factor were calculated as described above.
Hippocampal neurons were stained with antibodies against MAP2 and GM130 to identify apical dendrites. The apical dendrite was identified by the position of the Golgi (GM130), which localizes at the base of apical dendrites, and as the dendrite with the highest MAP2 intensity and widest proximal shaft.45 Using the angle tool in the Fiji software, a line was drawn from the apical dendritic shaft to the center of the soma, and an area was demarcated by drawing lines at 45° angles clockwise and counterclockwise from the apical dendrite axis line (see Figure 5E). The total number of dendrites and dendrites within the demarcated area were counted and recorded. The number of dendrites within a 45° angle from the apical dendrite was calculated and divided by the total number of neurites per neuron, and calculated as percentage.
Quantification of cortical neuron morphology in P0 brain slices
All analyses of in vivo data were done on layer 2/3 cortical neurons from P3 mice using confocal microscopy images, which were projected from z-stack data. The surface areas and shapes of neuronal somata (Figure 6C–D) were quantified as described above using the fluorescence fill from the transfection with the plasmids encoding for shRNA constructs. Polygonal selections were saved as ROIs, and the area was measured and recorded. Apical dendrite widths (Figure 6E) were measured by using the straight-line tool in Fiji. A 5 μm-long line was drawn from the base of the hillock of the apical dendrite into its shaft in order to define the point, at which the width of the dendrite is measured. Neurite width was measured using the straight-line tool. Width measurements were saved as ROIs, and their measurements were recorded.
An analysis of the bends per micron of the apical dendrite (Figure 6F) was conducted by measuring the length of the dendrite and counting the turns. The number of bends per micron was calculated by dividing the number of bends per apical dendrite by the length of the corresponding apical dendrite.
Apical dendrite and soma orientations were calculated as illustrated in Figure 6G. A straight line perpendicular to the pial surface of the brain slice was drawn as a reference line. Apical dendrites skewed to the right from the perpendicular line were defined as positive angles, and those skewed to the left were defined as negative angles. For statistical calculations, absolute values were used. The orientation of the soma was also measured based on its long axis using the perpendicular line as a reference as described above.
Quantification of neuronal migration and morphology in embryonic (E18.5) brain slices
Neuronal migration in slices from mouse brains that were collected at E18.5 after in utero electroporation at E15.5 was performed as describe previously 78. In slice images, ten zones were set from the ventricular zone to the marginal zone using the Grid tools in Fiji (ImageJ). The number of cells expressing fluorescence protein was counted in each zone. Based on the total number of fluorescence protein positive cells in each zone, the percentage of cells in each zone was calculated. The surface areas of neuronal somata and width of leading processes were quantified in zones 3–7 as described above using the fluorescence fill from the transfection with the plasmids encoding for shRNA constructs. Quantification of neuronal morphologies was performed by grouping neurons in zones 3–7 into two distinct categories: 1) cells with a single leading/ascending process and a short trailing/descending process, 2) cells with an abnormal leading process – cells with branching or more than one ascending leading process, and cells with a short ascending process and a longer descending process. The percentage of each group was calculated as percentage of the total number of neurons counted in zones 3–7. The leading processes of neurons in zones 3–7 were also inspected for bends – kinks in the linear continuity of a leading process – and the number of bends per the leading process of each neuron was quantified.
Fluorescence Intensity Quantifications
Neurons were identified as transfected based on the fluorescence of GFP or mCherry, which were expressed from the plasmids that encoded shRNAs. Using the GFP or mCherry fluorescence fill, neuronal areas were outlined using the segmented mask tool in Slidebook 6.0, and Mask Statistics were used to measure the sum intensity of each fluorescent channel and the overall area of the outlined neuron. The sum intensity was divided by the area to generate fluorescence intensities per area unit.
To determine the fluorescence intensity of Sept5 in replated Sept7 KD neurons (Figure S1B), the entire cell was outlined using the polygon selection tool in imageJ, and saved as an ROI along with 3 other small circular selections from the image away from any cells. Fluorescence intensity measurements were exported as Integrated Density from Fiji, and normalized fluorescence intensity was calculated by subtracting the averaged 3 background samples from the calculated Integrated Density divided by the total cell area.
Statistical Analysis
In vitro data were collected from neurons that were isolated from the brains of at least two different animals and cultured independently on 2–3 different coverslips/dishes. In vivo data were obtained from three different animals. Statistical analysis of data was done using GraphPad Prism 9.0 software. Each data set was tested for normal distribution of variance using the D’Agostino and Pearson, Shapiro-Wilk and Kolmogorov-Smirnov tests. For data that were normally distributed, p-values were derived using an unpaired t-test, if they had the same SD, or unpaired t-test with Welch correction. Data that were not normally distributed were analyzed with the Mann-Whitney U-test. Data that were binned into two categories were analyzed with a Fisher’s exact test (Figure S4A) and data that were binned into more than two categories were analyzed with the chi-squared test. In Figure 6F–I, outliers were identified using the ROUT method using the ‘Identify Outliers’ feature in Prism 7 (GraphPad). Data graphs were plotted in GraphPad Prism using the scatter dot plot function showing the mean and standard error of the mean (SEM). N values and p values for each experiment are denoted in the corresponding figure and/or figure legend. Statistical significance was set at 0.05.
Supplementary Material
Video S1. Growing and shrinking neurites in control neurons, related to Figure 2. Rat hippocampal neurons were transfected with scrambled control shRNAs for 48 h, trypsinized, re-plated and imaged overnight with phase contrast confocal microscopy. GFP, which is co-expressed with shRNAs, was used to identify transfected neurons. Movie shows the neuron in Figure 2H (see inset for GFP expression). Timer is in minutes, and video playback rate is 20 frames per second. Scale bar, 10 μm.
Video S2. Stable and growing neurites in control neurons, related to Figure 2. Rat hippocampal neurons (were transfected with scrambled control shRNAs for 48 h, trypsinized, re-plated and imaged overnight with phase contrast confocal microscopy. Transfected neurons were identified by the fluorescence of GFP, which is co-expressed with shRNAs. Movie shows the neuron in Figure 2I (see inset for GFP expression). Timer is in minutes, and video playback rate is 15 frames per second. Scale bar, 10 μm.
Video S3. Filopodium-to-lamellipodium conversion, and spreading lamellipodia in Sept7-depleted neurons, related to Figure 2. Rat hippocampal neurons were transfected with Sept7 shRNAs for 48 h, trypsinized, re-plated and imaged overnight with DIC confocal microscopy. GFP, which is co-expressed with shRNAs, was used to identify transfected neurons. Movie shows the neuron in Figure 2K (see inset for GFP expression). Timer is in minutes, and video playback rate is 20 frames per second. Scale bar, 10 μm.
Video S4. Formation of a dactylopodium-like protrusion in Sept7-depleted neuron, related to Figure 2. Rat hippocampal neurons were transfected with Sept7 shRNAs for 48 h, trypsinized, re-plated and imaged overnight with DIC confocal microscopy. GFP, which is co-expressed with shRNAs, was used to identify transfected neurons. Movie shows the neuron in Figure 2L (see inset for GFP expression). Timer is in minutes, and video playback rate is 20 frames per second. Scale bar, 10 μm.
Video S5. Filopodia dynamics in control neurons, related to Figure 3. Rat hippocampal neurons were transfected with GFP-F-tractin and scrambled control shRNAs for 48 h, trypsinized, replated and imaged with TIRF microscopy. GFP-F-tractin is shown in inverted monochrome, and mCherry, which is co-expressed with shRNAs, is shown in cyan. Movie shows neuron in Figure 3F. Timer is in minutes:seconds (00:00), and video playback rate is 20 frames per second. Scale bar, 10 μm.
Video S6. Filopodia dynamics and engulfment by lamellipodial veils in Sept7-depleted neurons, related to Figure 3. Rat hippocampal neurons were transfected with GFP-F-tractin and Sept7 shRNAs for 48 h, trypsinized, replated and imaged with TIRF microscopy. GFP-F-tractin is shown in inverted monochrome, and mCherry, which is co-expressed with shRNAs, is shown in cyan and fades out over time. Movie shows neuron in Figure 3G. Timer is in minutes:seconds (00:00), and video playback rate is 20 frames per second. Scale bar, 10 μm.
Highlights.
A septin wreath-like network controls the shape of neuronal somata and neurites
Septins promote and suppress filopodial and lamellipodial protrusions, respectively
Septins scaffold myosin II and exclude Arp2/3 at the base of filopodial actin
Development of pyramidally shaped neurons requires septins in vitro and in vivo
Acknowledgments
We thank Drs. Timothy O’Connor (University of British Columbia), Tanya Svitkina (University of Pennsylvania), Smita Yadav (University of Washington) and Matthew Rasband (Baylor College of Medicine) for constructs. We are also grateful to Drs. Harini Sreenivasappa (Drexel University) and Anthony Choo (Leica Microsystems) for help with microscopy, Joshua Okletey for technical help with neuronal cultures and Shae Padrick for helpful discussions. All microscopy was performed at Drexel University’s Cell Imaging Center. The work was supported by National Institutes of Health grants 5R35 GM136337-02 to ETS and 5R01 NS098096-05 to KT, and Commonwealth Universal Research Enhancement Formula (CURE) grants SAP 4100085747 from the Pennsylvania Department of Health to ETS and KT.
Footnotes
Declaration of interests
The authors declare no competing interests.
Publisher's Disclaimer: This is a PDF file of an unedited manuscript that has been accepted for publication. As a service to our customers we are providing this early version of the manuscript. The manuscript will undergo copyediting, typesetting, and review of the resulting proof before it is published in its final form. Please note that during the production process errors may be discovered which could affect the content, and all legal disclaimers that apply to the journal pertain.
References
- 1.Mohan H, Verhoog MB, Doreswamy KK, Eyal G, Aardse R, Lodder BN, Goriounova NA, Asamoah B, AB BB, Groot C, et al. (2015). Dendritic and Axonal Architecture of Individual Pyramidal Neurons across Layers of Adult Human Neocortex. Cereb Cortex 25, 4839–4853. 10.1093/cercor/bhv188. [DOI] [PMC free article] [PubMed] [Google Scholar]
- 2.Spruston N (2008). Pyramidal neurons: dendritic structure and synaptic integration. Nat Rev Neurosci 9, 206–221. 10.1038/nrn2286. [DOI] [PubMed] [Google Scholar]
- 3.Kulkarni VA, and Firestein BL (2012). The dendritic tree and brain disorders. Mol Cell Neurosci 50, 10–20. 10.1016/j.mcn.2012.03.005. [DOI] [PubMed] [Google Scholar]
- 4.Copf T (2016). Impairments in dendrite morphogenesis as etiology for neurodevelopmental disorders and implications for therapeutic treatments. Neurosci Biobehav Rev 68, 946–978. 10.1016/j.neubiorev.2016.04.008. [DOI] [PubMed] [Google Scholar]
- 5.Liu HH, and Jan YN (2020). Mechanisms of neurite repair. Curr Opin Neurobiol 63, 53–58. 10.1016/j.conb.2020.02.010. [DOI] [PMC free article] [PubMed] [Google Scholar]
- 6.Prem S, Millonig JH, and DiCicco-Bloom E (2020). Dysregulation of Neurite Outgrowth and Cell Migration in Autism and Other Neurodevelopmental Disorders. Adv Neurobiol 25, 109–153. 10.1007/978-3-030-45493-7_5. [DOI] [PubMed] [Google Scholar]
- 7.Sainath R, and Gallo G (2015). Cytoskeletal and signaling mechanisms of neurite formation. Cell Tissue Res 359, 267–278. 10.1007/s00441-014-1955-0. [DOI] [PMC free article] [PubMed] [Google Scholar]
- 8.Miller KE, and Suter DM (2018). An Integrated Cytoskeletal Model of Neurite Outgrowth. Front Cell Neurosci 12, 447. 10.3389/fncel.2018.00447. [DOI] [PMC free article] [PubMed] [Google Scholar]
- 9.da Silva JS, and Dotti CG (2002). Breaking the neuronal sphere: regulation of the actin cytoskeleton in neuritogenesis. Nat Rev Neurosci 3, 694–704. 10.1038/nrn918. [DOI] [PubMed] [Google Scholar]
- 10.Takano T, Funahashi Y, and Kaibuchi K (2019). Neuronal Polarity: Positive and Negative Feedback Signals. Front Cell Dev Biol 7, 69. 10.3389/fcell.2019.00069. [DOI] [PMC free article] [PubMed] [Google Scholar]
- 11.Barnes AP, and Polleux F (2009). Establishment of axon-dendrite polarity in developing neurons. Annu Rev Neurosci 32, 347–381. 10.1146/annurev.neuro.31.060407.125536. [DOI] [PMC free article] [PubMed] [Google Scholar]
- 12.Namba T, Kibe Y, Funahashi Y, Nakamuta S, Takano T, Ueno T, Shimada A, Kozawa S, Okamoto M, Shimoda Y, et al. (2014). Pioneering axons regulate neuronal polarization in the developing cerebral cortex. Neuron 81, 814–829. 10.1016/j.neuron.2013.12.015. [DOI] [PubMed] [Google Scholar]
- 13.Dotti CG, Sullivan CA, and Banker GA (1988). The establishment of polarity by hippocampal neurons in culture. J Neurosci 8, 1454–1468. [DOI] [PMC free article] [PubMed] [Google Scholar]
- 14.Hatanaka Y, and Yamauchi K (2013). Excitatory cortical neurons with multipolar shape establish neuronal polarity by forming a tangentially oriented axon in the intermediate zone. Cereb Cortex 23, 105–113. 10.1093/cercor/bhr383. [DOI] [PubMed] [Google Scholar]
- 15.Banker G (2018). The Development of Neuronal Polarity: A Retrospective View. J Neurosci 38, 1867–1873. 10.1523/JNEUROSCI.1372-16.2018. [DOI] [PMC free article] [PubMed] [Google Scholar]
- 16.Flynn KC (2013). The cytoskeleton and neurite initiation. Bioarchitecture 3, 86–109. 10.4161/bioa.26259. [DOI] [PMC free article] [PubMed] [Google Scholar]
- 17.Svitkina TM (2013). Ultrastructure of protrusive actin filament arrays. Curr Opin Cell Biol 25, 574–581. 10.1016/j.ceb.2013.04.003. [DOI] [PMC free article] [PubMed] [Google Scholar]
- 18.Gautreau AM, Fregoso FE, Simanov G, and Dominguez R (2022). Nucleation, stabilization, and disassembly of branched actin networks. Trends Cell Biol 32, 421–432. 10.1016/j.tcb.2021.10.006. [DOI] [PMC free article] [PubMed] [Google Scholar]
- 19.Wit CB, and Hiesinger PR (2022). Neuronal filopodia: From stochastic dynamics to robustness of brain morphogenesis. Semin Cell Dev Biol. 10.1016/j.semcdb.2022.03.038. [DOI] [PubMed] [Google Scholar]
- 20.Saengsawang W, Mitok K, Viesselmann C, Pietila L, Lumbard DC, Corey SJ, and Dent EW (2012). The F-BAR protein CIP4 inhibits neurite formation by producing lamellipodial protrusions. Curr Biol 22, 494–501. 10.1016/j.cub.2012.01.038. [DOI] [PMC free article] [PubMed] [Google Scholar]
- 21.Guerrier S, Coutinho-Budd J, Sassa T, Gresset A, Jordan NV, Chen K, Jin WL, Frost A, and Polleux F (2009). The F-BAR domain of srGAP2 induces membrane protrusions required for neuronal migration and morphogenesis. Cell 138, 990–1004. 10.1016/j.cell.2009.06.047. [DOI] [PMC free article] [PubMed] [Google Scholar]
- 22.Dent EW, Kwiatkowski AV, Mebane LM, Philippar U, Barzik M, Rubinson DA, Gupton S, Van Veen JE, Furman C, Zhang J, et al. (2007). Filopodia are required for cortical neurite initiation. Nat Cell Biol 9, 1347–1359. 10.1038/ncb1654. [DOI] [PubMed] [Google Scholar]
- 23.Kwiatkowski AV, Rubinson DA, Dent EW, Edward van Veen J, Leslie JD, Zhang J, Mebane LM, Philippar U, Pinheiro EM, Burds AA, et al. (2007). Ena/VASP Is Required for neuritogenesis in the developing cortex. Neuron 56, 441–455. 10.1016/j.neuron.2007.09.008. [DOI] [PubMed] [Google Scholar]
- 24.Flynn KC, Hellal F, Neukirchen D, Jacob S, Tahirovic S, Dupraz S, Stern S, Garvalov BK, Gurniak C, Shaw AE, et al. (2012). ADF/cofilin-mediated actin retrograde flow directs neurite formation in the developing brain. Neuron 76, 1091–1107. 10.1016/j.neuron.2012.09.038. [DOI] [PubMed] [Google Scholar]
- 25.Dehmelt L, Smart FM, Ozer RS, and Halpain S (2003). The role of microtubule-associated protein 2c in the reorganization of microtubules and lamellipodia during neurite initiation. J Neurosci 23, 9479–9490. [DOI] [PMC free article] [PubMed] [Google Scholar]
- 26.Mingorance-Le Meur A, and O’Connor TP (2009). Neurite consolidation is an active process requiring constant repression of protrusive activity. EMBO J 28, 248–260. 10.1038/emboj.2008.265. [DOI] [PMC free article] [PubMed] [Google Scholar]
- 27.Lu W, Fox P, Lakonishok M, Davidson MW, and Gelfand VI (2013). Initial neurite outgrowth in Drosophila neurons is driven by kinesin-powered microtubule sliding. Curr Biol 23, 1018–1023. 10.1016/j.cub.2013.04.050. [DOI] [PMC free article] [PubMed] [Google Scholar]
- 28.Rao AN, and Baas PW (2018). Polarity Sorting of Microtubules in the Axon. Trends Neurosci 41, 77–88. 10.1016/j.tins.2017.11.002. [DOI] [PMC free article] [PubMed] [Google Scholar]
- 29.Spiliotis ET, and Nakos K (2021). Cellular functions of actin- and microtubule-associated septins. Curr Biol 31, R651–R666. 10.1016/j.cub.2021.03.064. [DOI] [PMC free article] [PubMed] [Google Scholar]
- 30.Woods BL, and Gladfelter AS (2021). The state of the septin cytoskeleton from assembly to function. Curr Opin Cell Biol 68, 105–112. 10.1016/j.ceb.2020.10.007. [DOI] [PMC free article] [PubMed] [Google Scholar]
- 31.Caudron F, and Barral Y (2009). Septins and the lateral compartmentalization of eukaryotic membranes. Dev Cell 16, 493–506. 10.1016/j.devcel.2009.04.003. [DOI] [PubMed] [Google Scholar]
- 32.Radler MR, and Spiliotis ET (2022). Right place, right time - Spatial guidance of neuronal morphogenesis by septin GTPases. Curr Opin Neurobiol 75, 102557. 10.1016/j.conb.2022.102557. [DOI] [PMC free article] [PubMed] [Google Scholar]
- 33.Ageta-Ishihara N, and Kinoshita M (2021). Developmental and postdevelopmental roles of septins in the brain. Neurosci Res 170, 6–12. 10.1016/j.neures.2020.08.006. [DOI] [PubMed] [Google Scholar]
- 34.Boubakar L, Falk J, Ducuing H, Thoinet K, Reynaud F, Derrington E, and Castellani V (2017). Molecular Memory of Morphologies by Septins during Neuron Generation Allows Early Polarity Inheritance. Neuron 95, 834–851 e835. 10.1016/j.neuron.2017.07.027. [DOI] [PubMed] [Google Scholar]
- 35.Falk J, Boubakar L, and Castellani V (2019). Septin functions during neurodevelopment, a yeast perspective. Curr Opin Neurobiol 57, 102–109. 10.1016/j.conb.2019.01.012. [DOI] [PubMed] [Google Scholar]
- 36.Xie Y, Vessey JP, Konecna A, Dahm R, Macchi P, and Kiebler MA (2007). The GTP-binding protein Septin 7 is critical for dendrite branching and dendritic-spine morphology. Curr Biol 17, 1746–1751. 10.1016/j.cub.2007.08.042. [DOI] [PubMed] [Google Scholar]
- 37.Figueiredo AM, Barbacena P, Russo A, Vaccaro S, Ramalho D, Pena A, Lima AP, Ferreira RR, Fidalgo MA, El-Marjou F, et al. (2021). Endothelial cell invasion is controlled by dactylopodia. Proc Natl Acad Sci U S A 118. 10.1073/pnas.2023829118. [DOI] [PMC free article] [PubMed] [Google Scholar]
- 38.Yang Q, Zhang XF, Pollard TD, and Forscher P (2012). Arp2/3 complex-dependent actin networks constrain myosin II function in driving retrograde actin flow. J Cell Biol 197, 939–956. 10.1083/jcb.201111052. [DOI] [PMC free article] [PubMed] [Google Scholar]
- 39.Lin CH, Espreafico EM, Mooseker MS, and Forscher P (1996). Myosin drives retrograde F-actin flow in neuronal growth cones. Neuron 16, 769–782. 10.1016/s0896-6273(00)80097-5. [DOI] [PubMed] [Google Scholar]
- 40.Alieva NO, Efremov AK, Hu S, Oh D, Chen Z, Natarajan M, Ong HT, Jegou A, Romet-Lemonne G, Groves JT, et al. (2019). Myosin IIA and formin dependent mechanosensitivity of filopodia adhesion. Nat Commun 10, 3593. 10.1038/s41467-019-10964-w. [DOI] [PMC free article] [PubMed] [Google Scholar]
- 41.Medeiros NA, Burnette DT, and Forscher P (2006). Myosin II functions in actin-bundle turnover in neuronal growth cones. Nat Cell Biol 8, 215–226. 10.1038/ncb1367. [DOI] [PubMed] [Google Scholar]
- 42.Lin CH, and Forscher P (1995). Growth cone advance is inversely proportional to retrograde F-actin flow. Neuron 14, 763–771. 10.1016/0896-6273(95)90220-1. [DOI] [PubMed] [Google Scholar]
- 43.Hetrick B, Han MS, Helgeson LA, and Nolen BJ (2013). Small molecules CK-666 and CK-869 inhibit actin-related protein 2/3 complex by blocking an activating conformational change. Chem Biol 20, 701–712. 10.1016/j.chembiol.2013.03.019. [DOI] [PMC free article] [PubMed] [Google Scholar]
- 44.Weed SA, Karginov AV, Schafer DA, Weaver AM, Kinley AW, Cooper JA, and Parsons JT (2000). Cortactin localization to sites of actin assembly in lamellipodia requires interactions with F-actin and the Arp2/3 complex. J Cell Biol 151, 29–40. 10.1083/jcb.151.1.29. [DOI] [PMC free article] [PubMed] [Google Scholar]
- 45.Wu YK, Fujishima K, and Kengaku M (2015). Differentiation of apical and basal dendrites in pyramidal cells and granule cells in dissociated hippocampal cultures. PLoS One 10, e0118482. 10.1371/journal.pone.0118482. [DOI] [PMC free article] [PubMed] [Google Scholar]
- 46.Ageta-Ishihara N, Miyata T, Ohshima C, Watanabe M, Sato Y, Hamamura Y, Higashiyama T, Mazitschek R, Bito H, and Kinoshita M (2013). Septins promote dendrite and axon development by negatively regulating microtubule stability via HDAC6-mediated deacetylation. Nat Commun 4, 2532. 10.1038/ncomms3532. [DOI] [PMC free article] [PubMed] [Google Scholar]
- 47.Hu J, Bai X, Bowen JR, Dolat L, Korobova F, Yu W, Baas PW, Svitkina T, Gallo G, and Spiliotis ET (2012). Septin-driven coordination of actin and microtubule remodeling regulates the collateral branching of axons. Curr Biol 22, 1109–1115. 10.1016/j.cub.2012.04.019. [DOI] [PMC free article] [PubMed] [Google Scholar]
- 48.Menon MB, Sawada A, Chaturvedi A, Mishra P, Schuster-Gossler K, Galla M, Schambach A, Gossler A, Forster R, Heuser M, et al. (2014). Genetic deletion of SEPT7 reveals a cell type-specific role of septins in microtubule destabilization for the completion of cytokinesis. PLoS Genet 10, e1004558. 10.1371/journal.pgen.1004558. [DOI] [PMC free article] [PubMed] [Google Scholar]
- 49.Yang C, and Svitkina T (2011). Filopodia initiation: focus on the Arp2/3 complex and formins. Cell Adh Migr 5, 402–408. 10.4161/cam.5.5.16971. [DOI] [PMC free article] [PubMed] [Google Scholar]
- 50.Tada T, Simonetta A, Batterton M, Kinoshita M, Edbauer D, and Sheng M (2007). Role of Septin cytoskeleton in spine morphogenesis and dendrite development in neurons. Curr Biol 17, 1752–1758. 10.1016/j.cub.2007.09.039. [DOI] [PMC free article] [PubMed] [Google Scholar]
- 51.Dolat L, Hu Q, and Spiliotis ET (2014). Septin functions in organ system physiology and pathology. Biol Chem 395, 123–141. 10.1515/hsz-2013-0233. [DOI] [PMC free article] [PubMed] [Google Scholar]
- 52.Bridges AA, Jentzsch MS, Oakes PW, Occhipinti P, and Gladfelter AS (2016). Micron-scale plasma membrane curvature is recognized by the septin cytoskeleton. J Cell Biol 213, 23–32. 10.1083/jcb.201512029. [DOI] [PMC free article] [PubMed] [Google Scholar]
- 53.Spiliotis ET, and McMurray MA (2020). Masters of asymmetry - lessons and perspectives from 50 years of septins. Mol Biol Cell 31, 2289–2297. 10.1091/mbc.E19-11-0648. [DOI] [PMC free article] [PubMed] [Google Scholar]
- 54.Joo E, Surka MC, and Trimble WS (2007). Mammalian SEPT2 is required for scaffolding nonmuscle myosin II and its kinases. Dev Cell 13, 677–690. 10.1016/j.devcel.2007.09.001. [DOI] [PubMed] [Google Scholar]
- 55.Wasik AA, Dumont V, Tienari J, Nyman TA, Fogarty CL, Forsblom C, Lehto M, Lehtonen E, Groop PH, and Lehtonen S (2017). Septin 7 reduces nonmuscle myosin IIA activity in the SNAP23 complex and hinders GLUT4 storage vesicle docking and fusion. Exp Cell Res 350, 336–348. 10.1016/j.yexcr.2016.12.010. [DOI] [PMC free article] [PubMed] [Google Scholar]
- 56.Case LB, and Waterman CM (2015). Integration of actin dynamics and cell adhesion by a three-dimensional, mechanosensitive molecular clutch. Nat Cell Biol 17, 955–963. 10.1038/ncb3191. [DOI] [PMC free article] [PubMed] [Google Scholar]
- 57.Hylton RK, Heebner JE, Grillo MA, and Swulius MT (2022). Cofilactin filaments regulate filopodial structure and dynamics in neuronal growth cones. Nat Commun 13, 2439. 10.1038/s41467-022-30116-x. [DOI] [PMC free article] [PubMed] [Google Scholar]
- 58.Wiggan O, Shaw AE, DeLuca JG, and Bamburg JR (2012). ADF/cofilin regulates actomyosin assembly through competitive inhibition of myosin II binding to F-actin. Dev Cell 22, 530–543. 10.1016/j.devcel.2011.12.026. [DOI] [PMC free article] [PubMed] [Google Scholar]
- 59.Elam WA, Kang H, and De La Cruz EM (2013). Competitive displacement of cofilin can promote actin filament severing. Biochem Biophys Res Commun 438, 728–731. 10.1016/j.bbrc.2013.07.109. [DOI] [PMC free article] [PubMed] [Google Scholar]
- 60.Suarez C, Roland J, Boujemaa-Paterski R, Kang H, McCullough BR, Reymann AC, Guerin C, Martiel JL, De la Cruz EM, and Blanchoin L (2011). Cofilin tunes the nucleotide state of actin filaments and severs at bare and decorated segment boundaries. Curr Biol 21, 862–868. 10.1016/j.cub.2011.03.064. [DOI] [PMC free article] [PubMed] [Google Scholar]
- 61.Hou M, Liu X, Cao J, and Chen B (2016). SEPT7 overexpression inhibits glioma cell migration by targeting the actin cytoskeleton pathway. Oncol Rep 35, 2003–2010. 10.3892/or.2016.4609. [DOI] [PubMed] [Google Scholar]
- 62.Mostowy S, Bonazzi M, Hamon MA, Tham TN, Mallet A, Lelek M, Gouin E, Demangel C, Brosch R, Zimmer C, et al. (2010). Entrapment of intracytosolic bacteria by septin cage-like structures. Cell Host Microbe 8, 433–444. 10.1016/j.chom.2010.10.009. [DOI] [PubMed] [Google Scholar]
- 63.Pfanzelter J, Mostowy S, and Way M (2018). Septins suppress the release of vaccinia virus from infected cells. J Cell Biol 217, 2911–2929. 10.1083/jcb.201708091. [DOI] [PMC free article] [PubMed] [Google Scholar]
- 64.Cavini IA, Leonardo DA, Rosa HVD, Castro D, D’Muniz Pereira H, Valadares NF, Araujo APU, and Garratt RC (2021). The Structural Biology of Septins and Their Filaments: An Update. Front Cell Dev Biol 9, 765085. 10.3389/fcell.2021.765085. [DOI] [PMC free article] [PubMed] [Google Scholar]
- 65.Suarez C, Carroll RT, Burke TA, Christensen JR, Bestul AJ, Sees JA, James ML, Sirotkin V, and Kovar DR (2015). Profilin regulates F-actin network homeostasis by favoring formin over Arp2/3 complex. Dev Cell 32, 43–53. 10.1016/j.devcel.2014.10.027. [DOI] [PMC free article] [PubMed] [Google Scholar]
- 66.Rotty JD, Wu C, Haynes EM, Suarez C, Winkelman JD, Johnson HE, Haugh JM, Kovar DR, and Bear JE (2015). Profilin-1 serves as a gatekeeper for actin assembly by Arp2/3-dependent and -independent pathways. Dev Cell 32, 54–67. 10.1016/j.devcel.2014.10.026. [DOI] [PMC free article] [PubMed] [Google Scholar]
- 67.Yadav S, Oses-Prieto JA, Peters CJ, Zhou J, Pleasure SJ, Burlingame AL, Jan LY, and Jan YN (2017). TAOK2 Kinase Mediates PSD95 Stability and Dendritic Spine Maturation through Septin7 Phosphorylation. Neuron 93, 379–393. 10.1016/j.neuron.2016.12.006. [DOI] [PMC free article] [PubMed] [Google Scholar]
- 68.Pennington K, Beasley CL, Dicker P, Fagan A, English J, Pariante CM, Wait R, Dunn MJ, and Cotter DR (2008). Prominent synaptic and metabolic abnormalities revealed by proteomic analysis of the dorsolateral prefrontal cortex in schizophrenia and bipolar disorder. Mol Psychiatry 13, 1102–1117. 10.1038/sj.mp.4002098. [DOI] [PubMed] [Google Scholar]
- 69.Harper KM, Hiramoto T, Tanigaki K, Kang G, Suzuki G, Trimble W, and Hiroi N (2012). Alterations of social interaction through genetic and environmental manipulation of the 22q11.2 gene Sept5 in the mouse brain. Hum Mol Genet 21, 3489–3499. 10.1093/hmg/dds180. [DOI] [PMC free article] [PubMed] [Google Scholar]
- 70.Suzuki G, Harper KM, Hiramoto T, Sawamura T, Lee M, Kang G, Tanigaki K, Buell M, Geyer MA, Trimble WS, et al. (2009). Sept5 deficiency exerts pleiotropic influence on affective behaviors and cognitive functions in mice. Hum Mol Genet 18, 1652–1660. 10.1093/hmg/ddp086. [DOI] [PMC free article] [PubMed] [Google Scholar]
- 71.Liu X, Blazejewski SM, Bennison SA, and Toyo-Oka K (2021). Glutathione S-transferase Pi (Gstp) proteins regulate neuritogenesis in the developing cerebral cortex. Hum Mol Genet 30, 30–45. 10.1093/hmg/ddab003. [DOI] [PMC free article] [PubMed] [Google Scholar]
- 72.Cornell B, Wachi T, Zhukarev V, and Toyo-Oka K (2016). Regulation of neuronal morphogenesis by 14-3-3epsilon (Ywhae) via the microtubule binding protein, doublecortin. Hum Mol Genet 25, 4405–4418. 10.1093/hmg/ddw270. [DOI] [PMC free article] [PubMed] [Google Scholar]
- 73.Hand R, and Polleux F (2011). Neurogenin2 regulates the initial axon guidance of cortical pyramidal neurons projecting medially to the corpus callosum. Neural Dev 6, 30. 10.1186/1749-8104-6-30. [DOI] [PMC free article] [PubMed] [Google Scholar]
- 74.Hamdan H, Lim BC, Torii T, Joshi A, Konning M, Smith C, Palmer DJ, Ng P, Leterrier C, Oses-Prieto JA, et al. (2020). Mapping axon initial segment structure and function by multiplexed proximity biotinylation. Nat Commun 11, 100. 10.1038/s41467-019-13658-5. [DOI] [PMC free article] [PubMed] [Google Scholar]
- 75.Karasmanis EP, Phan CT, Angelis D, Kesisova IA, Hoogenraad CC, McKenney RJ, and Spiliotis ET (2018). Polarity of Neuronal Membrane Traffic Requires Sorting of Kinesin Motor Cargo during Entry into Dendrites by a Microtubule-Associated Septin. Dev Cell 46, 204–218 e207. 10.1016/j.devcel.2018.06.013. [DOI] [PMC free article] [PubMed] [Google Scholar]
- 76.Johnson HW, and Schell MJ (2009). Neuronal IP3 3-kinase is an F-actin-bundling protein: role in dendritic targeting and regulation of spine morphology. Mol Biol Cell 20, 5166–5180. 10.1091/mbc.E09-01-0083. [DOI] [PMC free article] [PubMed] [Google Scholar]
- 77.Beach JR, Licate LS, Crish JF, and Egelhoff TT (2011). Analysis of the role of Ser1/Ser2/Thr9 phosphorylation on myosin II assembly and function in live cells. BMC Cell Biol 12, 52. 10.1186/1471-2121-12-52. [DOI] [PMC free article] [PubMed] [Google Scholar]
- 78.Wachi T, Cornell B, Marshall C, Zhukarev V, Baas PW, and Toyo-oka K (2016). Ablation of the 14-3-3gamma Protein Results in Neuronal Migration Delay and Morphological Defects in the Developing Cerebral Cortex. Dev Neurobiol 76, 600–614. 10.1002/dneu.22335. [DOI] [PubMed] [Google Scholar]
Associated Data
This section collects any data citations, data availability statements, or supplementary materials included in this article.
Supplementary Materials
Video S1. Growing and shrinking neurites in control neurons, related to Figure 2. Rat hippocampal neurons were transfected with scrambled control shRNAs for 48 h, trypsinized, re-plated and imaged overnight with phase contrast confocal microscopy. GFP, which is co-expressed with shRNAs, was used to identify transfected neurons. Movie shows the neuron in Figure 2H (see inset for GFP expression). Timer is in minutes, and video playback rate is 20 frames per second. Scale bar, 10 μm.
Video S2. Stable and growing neurites in control neurons, related to Figure 2. Rat hippocampal neurons (were transfected with scrambled control shRNAs for 48 h, trypsinized, re-plated and imaged overnight with phase contrast confocal microscopy. Transfected neurons were identified by the fluorescence of GFP, which is co-expressed with shRNAs. Movie shows the neuron in Figure 2I (see inset for GFP expression). Timer is in minutes, and video playback rate is 15 frames per second. Scale bar, 10 μm.
Video S3. Filopodium-to-lamellipodium conversion, and spreading lamellipodia in Sept7-depleted neurons, related to Figure 2. Rat hippocampal neurons were transfected with Sept7 shRNAs for 48 h, trypsinized, re-plated and imaged overnight with DIC confocal microscopy. GFP, which is co-expressed with shRNAs, was used to identify transfected neurons. Movie shows the neuron in Figure 2K (see inset for GFP expression). Timer is in minutes, and video playback rate is 20 frames per second. Scale bar, 10 μm.
Video S4. Formation of a dactylopodium-like protrusion in Sept7-depleted neuron, related to Figure 2. Rat hippocampal neurons were transfected with Sept7 shRNAs for 48 h, trypsinized, re-plated and imaged overnight with DIC confocal microscopy. GFP, which is co-expressed with shRNAs, was used to identify transfected neurons. Movie shows the neuron in Figure 2L (see inset for GFP expression). Timer is in minutes, and video playback rate is 20 frames per second. Scale bar, 10 μm.
Video S5. Filopodia dynamics in control neurons, related to Figure 3. Rat hippocampal neurons were transfected with GFP-F-tractin and scrambled control shRNAs for 48 h, trypsinized, replated and imaged with TIRF microscopy. GFP-F-tractin is shown in inverted monochrome, and mCherry, which is co-expressed with shRNAs, is shown in cyan. Movie shows neuron in Figure 3F. Timer is in minutes:seconds (00:00), and video playback rate is 20 frames per second. Scale bar, 10 μm.
Video S6. Filopodia dynamics and engulfment by lamellipodial veils in Sept7-depleted neurons, related to Figure 3. Rat hippocampal neurons were transfected with GFP-F-tractin and Sept7 shRNAs for 48 h, trypsinized, replated and imaged with TIRF microscopy. GFP-F-tractin is shown in inverted monochrome, and mCherry, which is co-expressed with shRNAs, is shown in cyan and fades out over time. Movie shows neuron in Figure 3G. Timer is in minutes:seconds (00:00), and video playback rate is 20 frames per second. Scale bar, 10 μm.
Data Availability Statement
All data reported in this paper will be shared by the lead contact upon request.
This paper does not report original code.
Any additional information required to reanalyze the data reported in this paper is available from the lead contact upon request.