

Abstract
Prioritizing treatments for individual cancer patients remains challenging, and performing co-clinical studies using patient-derived models in real-time is often unfeasible. To circumvent these challenges, we introduce OncoLoop, a precision medicine framework that predicts drug sensitivity in human tumors and their pre-existing high-fidelity (cognate) model(s) by leveraging drug perturbation profiles. As proof-of-concept, we applied OncoLoop to prostate cancer (PCa) using genetically-engineered mouse models (GEMMs) that recapitulate a broad spectrum of disease states, including castration-resistant, metastatic, and neuroendocrine prostate cancer. Interrogation of human PCa cohorts by Master Regulator (MR) conservation analysis revealed that most advanced PCa patients were represented by at least one cognate GEMM-derived tumor (GEMM-DT). Drugs predicted to invert MR activity in patients and their cognate GEMM-DTs were successfully validated in allograft, syngeneic, and patient-derived xenograft (PDX) models of tumors and metastasis. Furthermore, Oncoloop-predicted drugs enhanced the efficacy of clinically-relevant drugs, namely the PD1 inhibitor, nivolumab, and the AR-inhibitor, enzalutamide.
Keywords: Prostate cancer, interactome, mouse models, PDX models, precision oncology
Introduction
Systematic prediction of drug efficacy in vivo remains a major clinical challenge for most cancer types due, in part, to tumor heterogeneity, which makes it difficult to optimize treatments on an individual basis. This is further compounded by difficulties in establishing patient-derived models that recapitulate the biology and complexity of an individual patient’s tumor for co-clinical validation. Indeed, for some tumor types, establishment of patient-derived xenograft (PDX) models can take more than one year (1,2), thus compromising their usefulness for evaluating drug efficacy within a time-frame compatible with patient care, especially in the metastatic setting. Patient-derived organoid (PDO) models have become increasingly more accessible and representative; however, these may not effectively model the tumor microenvironment (3,4). Although human tumor cell lines are widely available for many cancer types, they rarely represent the full spectrum of tumor phenotypes observed in patients and often have idiosyncratic dependencies, as a result of alterations they accrue to survive in vitro. In principle, genetically-engineered mouse models (GEMMs), which are now widely available for many cancer types (5), may be valuable for studying drug response in the whole organism in the context of the native tumor microenvironment. However, their effective use in co-clinical studies requires accurate assessment of their fidelity to their human counterparts, in terms of recapitulating the biology and drug sensitivity of patient tumors (6).
These challenges are exemplified in prostate cancer (PCa), which remains the most prevalent form of cancer and a leading cause of cancer-related death in men (7). PCa is characterized by its wide range of disease outcomes; indeed, while men with locally-invasive disease—accounting for the vast majority of new diagnoses—have a 5-year survival of >90%, those who progress to advanced PCa have a 5-year survival of < 30%. The first line treatment for advanced PCa is androgen deprivation therapy (ADT), which initially leads to tumor regression but ultimately to the emergence of castration-resistant prostate cancer (CRPC), which is often metastatic (mCRPC) (8–10). Standard-of-care second line treatments include taxane-based chemotherapy, such as Cabazitaxel, and second-generation anti-androgens, such as Enzalutamide; while these may be initially effective, many patients fail treatment, leading to the emergence of highly aggressive disease variants, including neuroendocrine prostate cancer (NEPC) (11,12). Challenges in treating advanced PCa include its inherent heterogeneity, the infrequency of driver mutations, and its long mutational tail (13), which make it difficult to determine a priori whether specific treatments are likely to effective for any given patient. Furthermore, while there are an abundance of mouse models of PCa (14), it has proven difficult to model human PCa since the establishment of PDX and PDO models has been low yield, especially for advanced disease (15–19).
To overcome these challenges, we developed OncoLoop, a framework that integrates experimental and computational data to first identify high-fidelity models for a given human tumor (cognate model, hereafter), then to predict optimal drug treatments for the patient and its cognate model based on large-scale drug perturbation profiles, and lastly to validate drug efficacy using the cognate model. The rationale for OncoLoop is based on previous studies where we have shown that Master Regulator (MR) proteins represent mechanistic determinants of a tumor’s transcriptional state and that MR-activity inversion effectively abrogates tumor viability (20–22). Thus, cognate models for a given patient are identified by assessing the conservation of MR protein activity for a patient and potential cognate models (23,24); conversely, optimal drugs are prioritized based on their ability to invert the MR-activity signature of both a patient tumor and its cognate model(s) (21). Hence, OncoLoop identifies the most statistically significant three-way relationships encompassing a tumor, its highest-fidelity cognate model(s), and one or more drugs predicted to invert the MR-activity signature of both tumor and cognate model(s) (hereafter, MR-inverter drugs).
As proof-of-concept, we established OncoLoop in the context of PCa, for which both large-scale human patient cohorts—comprising both primary tumors and metastases (25,26)—and an extensive repertoire of GEMMs ((14) and this report) are available. Indeed, MR-conservation analysis revealed that a majority of patients in these cohorts was represented by at least one cognate GEMM-derived tumor (GEMM-DT). To identify MR-inverter drugs, we leveraged PanACEA (27), a large collection of drug perturbation profiles in cell lines matched to 23 tumor subtypes, including PCa cell lines. Three out of four predicted drugs prioritized by our analyses induced highly significant growth inhibition of tumor allografts from cognate GEMM-DTs in vivo. We further show that the predicted drugs are active in the castration-resistant contexts and enhanced the efficacy of the 2nd-generation anti-androgen, enzalutamide. Notably, we assessed the contribution of MR-inverter drugs towards rescuing inflammatory pathway activity and immunosensitivity—especially in the challenging and translationally relevant metastatic setting—by further validating predicted drugs in a cognate syngeneic model of metastasis, in combination with a PD1 inhibitor, nivolumab. Finally, to confirm relevance to a human context, we further validated the predicted drugs in a cognate PCa PDX tumor model. Taken together our findings show that OncoLoop provides an effective framework for the rapid identification and evaluation of patient-relevant drugs in pre-existing cognate models, thus supporting its co-clinical application. OncoLoop is a highly generalizable framework that can be extended to other cancers and potentially other diseases.
Results
Conceptual overview of OncoLoop:
We developed OncoLoop for the purpose of identifying drugs poised to benefit patients, whose response could be evaluated in pre-existing co-clinical models (Fig. 1A). OncoLoop leverages regulatory networks—reverse-engineered from large, tumor-specific RNA-seq profile datasets to first identify cognate models (i.e., GEMM-DTs) based on conservation of their MR-activity signature with a human tumor. In a second step, candidate MR-inverter drugs are prioritized by assessing their ability to invert the MR activity signature of both the human tumor and its cognate GEMM-DTs, based on drug perturbation profiles of MR-matched tumor cell lines. Finally, the efficacy of predicted drugs is validated in vivo, using the cognate models. We have established OncoLoop based on PCa, for which we have generated a comprehensive series of GEMMs; however, for other cancer types PDX models may be used if large, representative collections are available.
Figure 1: The OncoLoop conceptual framework.

A. Conceptual overview: OncoLoop was designed to identify high-fidelity (cognate) models—in this study, GEMM-derived tumors (GEMM-DTs)— of a patient’s tumor as well as drugs capable of inverting the MR protein activity for both the patient and their cognate GEMM-DT. To accomplish this, OncoLoop performs integrative analysis of transcriptomic (RNA-seq) profiles from a patient’s tumor, their cognate model, and drug perturbation assays. B. Regulatory network analysis: Gene expression profiles generated from each data source are used to reverse-engineer species- and cohort-specific regulatory networks, which are then used to transform differential gene expression signature into differential protein activity profiles. C. OncoLoop analysis: Gene Set Enrichment Analysis (GSEA) is used to assess the overlap in differentially active MR proteins between a human tumor and its cognate GEMM-DTs (OncoMatch). Similarly, GSEA is used to identify drugs capable of inverting the MR activity (MR-inverter drugs) for each patient and cognate GEMM-DT(s) pair. D. Drug prediction and validation: Representative Circos plot illustrating PGD-loops generated by matching a patient (P) to a GEMM-DT (G) and connecting them to each shared MR-inverter drug (D). Candidate drugs are first prioritized by pharmacotype analysis to identify the subset of patients predicted to be sensitive to the same subset of drugs, and then validated in vivo using a cognate GEMM-DT-derived allograft, a syngeneic model of metastasis and a PDX model. (Created with BioRender.com).
Data generation:
We leveraged large scale RNA-seq profiles from: (i) our comprehensive series of GEMMs representing a broad spectrum of PCa phenotypes (this study); (ii) publicly-available RNA-seq profiles from primary tumors in The Cancer Genome Atlas (TCGA) (25) and metastases in the Stand Up to Cancer-Prostate Cancer Foundation (SU2C) (26) cohorts; (iii) large-scale drug perturbation profiles from MR-matched tumor cell lines ((27) and this study); and (iv) RNA-seq profiles from well-characterized human PCa PDX models (this study) (Fig. 1B).
Protein activity analysis:
OncoLoop requires accurate protein activity assessment for appraisal of MR-activity signatures, identification of cognate models, and prediction of MR-inverter drugs. This is accomplished using the VIPER algorithm (23), which transforms RNA-seq profiles into accurate protein activity profiles, as recently validated by antibody-based protein abundance measurements (28). Akin to a highly multiplexed gene reporter assay, VIPER uses the expression of a protein’s tissue-specific targets (regulon) to measure its activity. The repertoire of targets of all regulatory and signaling proteins in a specific tissue context (i.e., context-specific interactome) is generated by reverse-engineering large-scale, tissue-specific RNA-seq profiles using the ARACNe algorithm (29). Notably, to support accurate, model-specific protein activity measurements, we generated separate interactomes from patient-, GEMM-, and PDX-specific RNA-seq datasets (Fig. 1B).
GEMM cohort characterization and cognate model identification:
First, we analyzed VIPER-based protein activity profiles from the GEMM-DTs to identify molecularly distinct subtypes and to demonstrate their relevance to the disease spectrum of human PCa. Next, we identified cognate GEMM-DTs, based on MR-activity signature conservation, for individual human primary PCa tumors and metastases in the TCGA and SU2C cohorts, respectively (Fig. 1C). This revealed broad coverage, in which 78% and 93% of tumors and metastases were matched to at least one cognate GEMM-DT, respectively.
Assessing drug mechanism of action (MoA) in MR-matched cell lines:
To predict drug sensitivity, we leveraged human tumor-relevant drug perturbation profiles generated for two PCa cell lines—the androgen-dependent LNCaP and the androgen-independent DU145 cell lines—that jointly provide high-fidelity models for >80% of the tumors in the TCGA cohort, based on MR-activity signature conservation ((27) and this study). To focus on the more aggressive mCRPC patients, we relied on RNA-seq profiles of DU145 cells that had been treated with a library of FDA-approved and late-stage experimental oncology drugs (i.e., drug perturbation profiles). Finally, the proteome-wide mechanism of action (MoA) of each drug was assessed using VIPER to measure the differential protein activity in drug-treated versus control-treated cells and used to identify optimal MR-inverter drugs for patient- and cognate GEMM-DT pairs (Fig. 1C). Note that, contrary to conventional drug screening assays, OncoLoop does not rely on cell lines to assess drug sensitivity but rather only for elucidating drug MoA—i.e., the effect of the drug on the activity of regulatory and signaling proteins.
Closing the Loop:
Having “matched” each patient tumor (P) to a cognate GEMM-DT (G) and assessed each drug (D) as a potential MR-inverter for both a tumor and its cognate model, we ranked all (P, G, D) triplets (PGD-loops hereafter), based on the integration of three distinct z-scores, assessing the statistical significance of: (i) the similarity of a patient- and GEMM-DT MR-activity signature; (ii) the drug’s MR-activity inversion as predicted from the patient tumor; and (iii) the drug’s MR-activity inversion as predicted from the cognate GEMM-DT (Fig 1C).
In vivo validation:
To prioritize drug candidates of greatest translational relevance, we focused on clinically available drugs that were most frequently nominated by the analysis of the human tumor cohorts (i.e., pharmacotyping). Among these, we evaluated the ability of the top-predicted drugs to inhibit tumor growth and recapitulate the predicted MR-activity inversion in vivo, based on co-clinical studies in cognate tumor allografts, a syngeneic model of metastasis, and a PDX tumor model (Fig. 1D). The following sections discuss each of these steps in detail.
A GEMM resource that models PCa progression:
An essential requirement for OncoLoop is the availability of pre-existing high-fidelity models—representing accurate surrogates for their human tumor counterpart—to enable co-clinical validation of predicted drugs within a time-frame relevant to the patient’s care. Toward this end, we assembled an extensive series of GEMMs that are based on genetic and/or pathway alterations that are prevalent in human PCa and thereby recapitulate a broad spectrum of human PCa phenotypes (Fig. 2A–E; Fig. S1A–C; see Detailed Materials and Methods) (30–34). A complete list of GEMMs used in this study and a description of their individual tumor phenotypes is provided in Table S1A,B; the entire GEMM series is available from the Jackson Laboratory (see Table S1).
Figure 2: A GEMM resource that models prostate cancer progression.
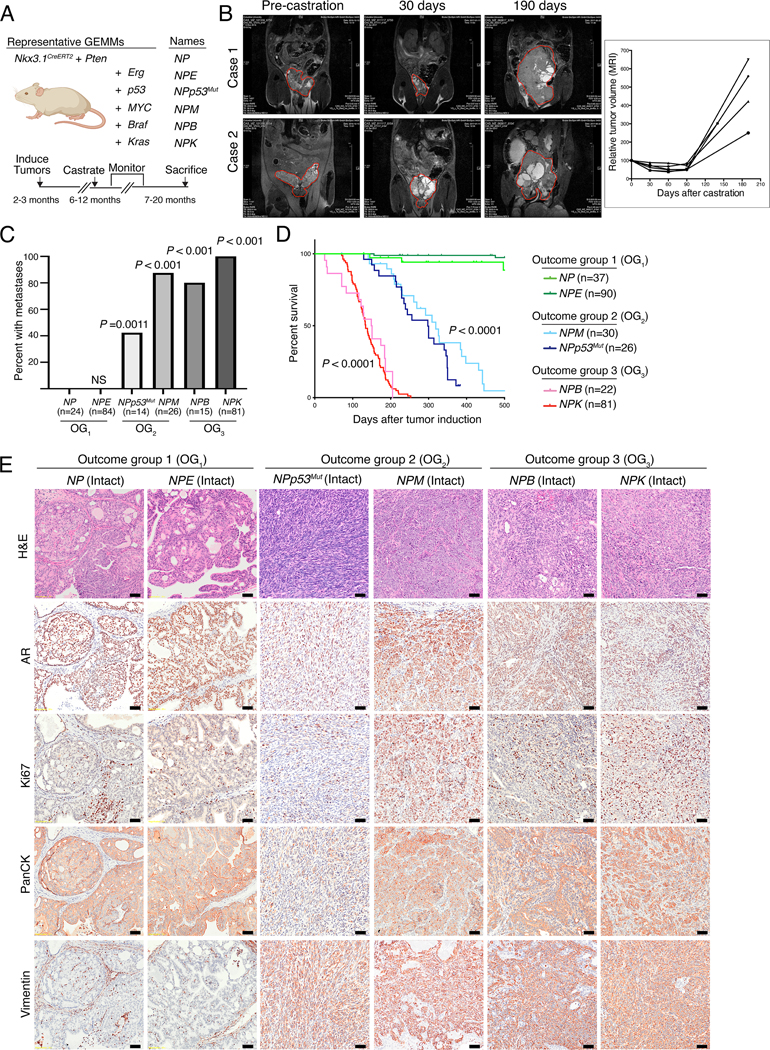
A. Schematic showing representative GEMMs used in this study. The GEMMs were generated by crossing NP mice (for Nkx3.1CreERT2/+; Ptenflox/flox) with the alleles shown in the panel to generate six complex strains. The timeline for tumor induction, castration, monitoring, and sacrificing is shown at the bottom of the panel. (Created with BioRender.com). B. MRI images showing tumor volume changes after castration of two representative NPp53 mice (Case 1 and Case 2). The plot on the right shows the tumor volume changes over time for 4 representative NPp53 mice. C. Frequency of metastasis observed in the GEMMs. The numbers of mice used to determine metastasis frequency for each model are indicated in parentheses; two-tailed P-values are shown for Fisher’s exact test comparing each model to the NP mice (control). OG, outcome group. D. Kaplan-Meier survival analysis shown for the models in the three outcome groups (OG1, OG2, and OG3). P-values were calculated using a two-tailed log-rank test compared to the NP mice (control). For the analyses shown in (C) and (D), both intact and castrated mice were pooled for all GEMMs except NPM, where the effects of castration may be confounded by the AR-dependency of the Probasin promoter used to drive Myc expression (see Detailed Materials and Methods). E. Representative images for hematoxylin and eosin (H&E) (top row) and immunohistochemical staining of the indicated markers in primary tumors from intact mice of the different GEMMs. Shown are representative images based on analyses 3 or more mice/group; scale bars represent 50 μm. See also Table S1, and Figures S1–S3.
These GEMMs are based on the Nkx3.1CreERT2 allele (Fig. 2A) (35), which simultaneously introduces a prostate-specific inducible Cre driver and a heterozygous null allele for the Nkx3.1 homeobox gene, as is common in early stage human PCa (Fig. S1A) (25). We generated the baseline NP mice (for Nkx3.1CreERT2/+; Ptenflox/flox mice) by crossing the Nkx3.1CreERT2 allele with a Pten conditional allele (Fig. 2A) (36), since PTEN mutations are prevalent from the earliest to most advanced stages of human PCa (Fig. S1A) (25,26). The NP mice were then crossed with various other alleles to model: (i) up-regulation of Erg in the NPE mice (E for Rosa26ERG/ERG, (37)); (ii) a missense mutation of Tp53 in the NPp53mut mice (for Trp53LSL-R270H/flox, (38)); (iii) up-regulation of c-Myc in the NPM mice (M for Hi-Myc, (39)); (iv) an activating mutation of Braf in the NPB mice (B for B-RafV600E, (40); and (v) an activating mutation of Kras in the NPK mice (K for KrasLSL-G12D, (41)) (Fig. 2A). These GEMMs also incorporate a conditionally-activatable fluorescent reporter, the Rosa26-CAG-LSL-EYFP allele (42), for high-efficiency lineage marking of tumors and metastases (30,34).
Since tumor induction is based on an inducible Cre, expression of the relevant alleles following Cre-mediated gene recombination is not dependent on androgens, with the exception of the Hi-Myc allele, which is under the control of a constitutive Probasin promoter (39). Consequently, we could analyze tumor progression in both hormone-intact and castrated contexts (Fig. 2B–E; Fig. S2A). As expected, the more indolent tumors regressed following castration, whereas the more aggressive ones developed progressive phenotypes consistent with CRPC (Fig. 2B–E; Fig. S2A; Table S1A,B). In particular, as evident by MRI imaging of NPp53 mice, surgical castration leads to initial tumor regression followed by eventual outgrowth of castration-resistant tumors (Fig. 2B). These phenotypic differences in intact and castrated tumors were evident by immunostaining for AR which is expressed in and localized to nuclei in intact tumors but is diminished in expression in the castrated tumors (compare Fig. 2E and Fig. S2A). Therefore, this GEMM series recapitulates both hormone-sensitive and castration-resistant PCa.
This GEMM cohort could be subdivided into three outcome groups (OG1 – OG3), based on their castration sensitivity, metastatic phenotype, and overall survival (Fig. 2C–E; Fig. S2A,B; Table S1A,B). Those in OG1, which include the NP and NPE mice, developed indolent, non-lethal and non-metastatic tumors with mostly benign, PIN-like histology and low levels of proliferation, as evident by Ki67 staining. Those in OG2, including the NPp53mut and NPM mice, were characterized by lethality within one year, were prone to develop metastasis, and displayed highly heterogeneous and proliferative histopathological phenotypes. Finally, those in OG3, including the NPB and NPK mice, were characterized by lethality by 6 months of age, which was accompanied by highly penetrant metastasis and high-grade poorly differentiated histopathology.
To facilitate co-clinical investigations, we established allograft, syngeneic, and organoid models from representative GEMMs (Fig. S3A,B, Table S1A; see Detailed Materials and Methods). Since the GEMMs used herein are in a mixed strain background, allografts were generated by implanting freshly collected primary tumors into the flank of nude mouse hosts and passaged at least twice prior to analysis. Organoids were generated by FACS-based isolation of lineage-marked primary tumor cells, which were then cultured in vitro for up to five passages (Fig. S3B). The histopathology of the resulting allograft and organoid models were similar to the parental tumors from which they were derived (Fig. S3A,B). Interestingly, while we were able to generate organoids from GEMMs in each outcome group (OG1 – OG3), we were only able to generate allograft models from the OG2 and OG3 tumors, but not from indolent OG1 tumors. Thus, we have generated an extensive resource of PCa GEMMs, as well as established culturable and transplantable models of these GEMMs. Since the current study relies on co-clinical analyses in vivo, we used the allograft rather organoid models; however, we envision that the organoid models will be beneficial for future in vitro investigations. Furthermore, to assess predicted drug activity in an immunocompetent context, we established a syngeneic model of prostate metastasis, which was derived from a bone metastasis from an NPKEYP GEMM (30) and propagated in immunocompetent C57BL/6 mice.
GEMM subtypes recapitulate human PCa phenotypes:
To characterize the molecular features of the GEMM cohort, we generated RNA-seq profiles from benign prostate tissue and prostate tumors from 136 individual mice. First, we reverse engineered a GEMM-specific ARACNe interactome from these RNA-seq profiles (Table S2A) (29). The resulting interactome outperformed our previously published mouse interactome, which was assembled from Illumina gene expression microarrays of a less comprehensive GEMM cohort (20). For example, bioactivity analysis—which assesses the ability of an interactome to recapitulate differential protein activity across distinct phenotypes—showed that differentially active proteins had significantly higher average normalized enrichment score (μNES,New = 3.79 in the new interactome, vs. μNES,Old = 1.96 in the previous one; P < 2.2×10⁻¹⁶, by 2-sided Kolmogorov–Smirnov test; Fig. S4A; see Detailed Materials and Methods). For instance, while the androgen receptor (AR) regulon—a critical determinant of prostate differentiation and tumorigenesis (43)—was a poor predictor of AR activity in the previous interactome (20), it is highly predictive in the new one (see Figs. 3A, S4B–D, and S5A–C).
Figure 3: GEMM subtypes recapitulate human PCa phenotypes.

A. Heatmap illustrating the results of protein activity-based cluster analysis of 91 GEMM-derived tumors (GEMM-DTs), as well as the silhouette score and correlative variables, such as outcome group, castration status, and metastatic progression. Shown are five molecularly-distinct clusters (C1 – C5) that co-segregate with survival and metastatic potential. Indicated for each cluster are the 10 most significantly activated MRs (top heatmap), and the activity levels of 9 established human PCa markers (bottom heatmap). Arrows indicate the activities of Ar and glucocorticoid receptor (Nr3c1), which are inversely correlated. B. Representative sub-networks, representing the activity of the 25 most differentially active MR proteins (5 per cluster, large circles) across all clusters and the expression of their regulatory targets (small circles) on a cluster-by-cluster basis. Protein activity is shown using a blue (inactivated) to red (activated) scale, while target expression is shown on a blue (under-expressed) to yellow (over-expressed) scale. High resolution images with full visibility of the MRs are shown in Figure S5. See also Table S2, and Figures S4, S5, S6.
To define GEMM molecular subtypes and to assess their relationship to human PCa, we focused on a subset of 91 GEMM-DTs having the most physiologically-relevant histopathological phenotypes (Table S1B). We first transformed their RNA-seq profiles to VIPER-measured protein activity profiles using the GEMM PCa interactome, and then performed protein activity-based cluster analysis (Fig. 3A; Table S2B; see Detailed Materials and Methods). To generate the differential gene expression signatures necessary for VIPER analysis, we compared each sample to the average of all 91 samples, thus identifying proteins with the greatest differential activity across all GEMM-DTs. Protein activity-based cluster analysis, which significantly outperforms gene expression-based clustering (22) identified 5 clusters, corresponding to 5 molecularly distinct subtypes (C1 – C5) associated with disease aggressiveness with respect to outcome and metastasis (Fig. 3A; Fig. S4B; Table S2C; see Detailed Materials and Methods). In particular, subtypes C1 and C2 mainly comprise tumors from the indolent outcome group (OG1), while subtypes C3 – C5 comprise tumors from the two more aggressive outcome groups (OG2 and OG3). Consistent with these findings, the C3 – C5 subtypes were enriched for GEMMs with genomic alterations commonly associated with more aggressive human PCa (Table S2C).
Notably, > 90% of the tumors in C4 and C5 had progressed to metastases, compared to only 50% of those in C3, and 11% of those in C1 and C2 (Fig. 3A; Fig. S4B). Furthermore, the most indolent subtype C1 is mostly comprised of tumors that regressed following castration, while C2 is mostly comprised of hormone-sensitive, indolent tumors; in contrast C3 – C5 mostly comprise tumors from the more aggressive outcome groups, including both hormone-sensitive and castration resistant ones (Fig. 3A; Table S2C). Interestingly, Ar activity was well-correlated with gene expression in the more indolent clusters (C1 and C2) and progressively inactivated and less correlated with gene expression in more aggressive clusters (C3 to C5) (Fig. S5A), consistent with defects in nuclear localization, post-translational inactivation, and transcriptional competency in CRPC which decouple its expression and activity.
With respect to their molecular phenotypes, C1 – C5 tumors were characterized by aberrant activity of a novel MR protein set that effectively distinguished each subtype (Fig. 3A). These include homeodomain proteins (e.g., Cdx1, Pdx1, Nkx2.6, Nkx3.1, Pitx1) and other transcriptional regulatory proteins (e.g., Gata5, Sox15, Sox7) that have known roles in cellular differentiation and cell lineage control in other tissue contexts. The coordinated switch between the molecular programs regulated by the top MR protein activities of each subtype was evident by the striking differential expression of the transcriptional targets of the most differentially active MRs of each subtype (Fig. 3B; Fig. S6). As expected, CRPC tumors, such as those from the NPK and NPp53mut GEMMs, have a distinct MR activity profile when compared to the corresponding intact tumors (Fig. S5B).
While the top-most significantly active MRs in subtypes C1 – C5 are novel, differential activity of MR proteins with an established role in human and mouse PCa progression was clearly evident (Fig. 3A; Fig. S4C). In particular, the indolent subtypes C1 and C2 present high activity of Nkx3.1, p63, and Ar, which are associated with well-differentiated PCa (43). In contrast, the most aggressive and highly metastatic subtypes C4 and C5, present high activity of FoxM1, Cenpf, and Nsd2, which are all aberrantly activated and functionally necessary for aggressive PCa, in both humans and mice (20,44). Notably, the aggressive subtypes C4 and C5, display downregulation of Ar and coordinated up-regulation of the glucocorticoid receptor (Nr3c1), which is known to be activated in human CRPC (45) (Fig. 3A; Fig. S4C,D; Fig. S5C). Interestingly, subtype C5 presented dysregulation of proteins associated with NEPC, including aberrant Foxa2 activation and Foxa1 inactivation (Fig. 3A; Fig. S4C) (46) and was significantly enriched in the Beltran NEPC signature (P < 10−4; see Detailed Materials and Methods) (11), while no enrichment for the NEPC signature was detectable in subtypes C1 – C4. Notably, none of the GEMM-DTs, including those associated with advanced PCa and NEPC (C4 and C5, respectively), had undergone pharmacological treatment; this is a novel feature of the GEMM cohort compared to analogous human PCa cohorts, which are generally derived from patients that had undergone extensive treatments (e.g., (26)).
To further characterize the GEMM subtypes and to assess their relationship to human PCa, we performed pathway enrichment analyses (Table S2D; see Detailed Materials and Methods). To determine the top pathways associated with each subtype, we computed the enrichment of each gene set in proteins differentially active in each sample, and then integrated across samples in each cluster using Stouffer’s method (see Detailed Materials and Methods). These analyses revealed that the most aggressive subtypes, C4 and C5, show strong enrichment for proliferation and oncogenic hallmarks, e.g., G2M Checkpoint (P = 2.14×10−39), E2F Targets (P = 4.5×10−88), DNA Repair (P = 5.8×10-68), and MYC Targets V1 and V2 (integrated P = 3.3×10⁻²¹) (Fig. S4D; Table S2D). (Note that all p-values reported in this manuscript are corrected for multiple hypothesis testing; see Detailed Materials and Methods). Furthermore, as expected based on human PCa, hormone-related pathways, including Ar and glucocorticoid receptor-related pathways were coordinately regulated and inversely correlated (Fig. S4D; Table S2D). Interestingly, interferon and inflammatory response hallmarks, including interferon alpha response (P = 2.4×10−52), interferon gamma response (P = 8.2×10−68) and inflammatory response (p = 4.7×10⁻¹⁸) were downregulated in subtypes C4 and C5 (Fig. S4D; Table S2D). These findings suggest that the most aggressive tumors may have an immunosuppressive tumor microenvironment and therefore may be valuable for evaluating immunotherapy response.
Taken together, these molecular analyses define a series of GEMM subtypes (C1 – C5) that: (i) are distinguished by novel as well as known MR protein activities; (ii) model a wide range of PCa phenotypes from indolent to aggressive variants; (iii) model hormone responsivity as occurs in human prostate cancer, including castration-sensitive and castration-resistant tumors; (iv) can differentiate lethal subtypes of adenocarcinoma and NEPC in the absence of prior treatment; and (v) recapitulate key aspects of human PCa including expression of relevant MR proteins and relevant pathways. Thus, this GEMM cohort represents a valuable resource to characterize and model human PCa, particularly for advanced tumors, as would be the principal focus for predicting drug treatments for human patients.
Matching GEMM-DTs to patient tumors and metastases:
Having established that the molecular programs of the GEMM cohort are relevant for human PCa, we next asked whether individual GEMM-DTs can provide high-fidelity (cognate) surrogates for individual patients (Fig. 4A,B; see Detailed Materials and Methods). We thus compared the MR protein activity signature for individual human patients with that of each available GEMM-DT (n = 91) and designated those presenting highly significant conservation of patient specific MR activity (P ≤ 10−5, by 1-tail aREA test) as cognate models. For these studies, we queried two well-characterized patient cohorts, one comprised of treatment naïve primary tumors collected by The Cancer Genome Atlas (TCGA, n = 333) (25), and a second comprised of post-treatment metastatic biopsies from mCRPC patients collected as part of the Stand Up to Cancer-Prostate Cancer Foundation cohort (SU2C, n = 212) (26).
Figure 4: Matching GEMM-DTs to patient tumor and metastases.

A. Heatmaps representing the MR-based fidelity score of each tumor sample (columns) versus each GEMM-DT model (rows), for the TCGA (right) and SU2C (left) cohort, respectively. Relevant patient phenotypic variables—i.e., Cohort, Gleason score, and NEPC status—are shown in the top three bars, while relevant GEMM-DT phenotypic variables—i.e., Cluster, outcome, castration status, and metastasis status—are shown in the four vertical bars to the left of the heatmap. Fidelity scores are computed as the of the patient vs. GEMM-DT MR enrichment analysis. The 5 top-most significant cognate models for each patient are shown in dark red; other statistically significant (P ≤ 10−5) high-fidelity models are shown using a lighter to darker color scale (as shown). The light blue barplots at the bottom of the two heatmaps shows the number of candidate cognate models for each patient, while the dark blue barplots to the right show the number of patients for which a GEMM-DT represents a cognate model. Overall, 78% of the samples in the TCGA (n = 261 of 334) and 93% of those in the SU2C cohorts (n = 198 of 212) have at least one cognate GEMM-DT. B. GSEA of the fidelity analysis for representative GEMM-DT-SU2C pairs showing an example of an MR-unmatched (low-fidelity, top) and an MR-matched (high-fidelity, bottom) pair. See also Table S4.
First, we assembled distinct human PCa interactomes for the primary tumors and metastases by ARACNe analysis of RNA-seq profiles from the TCGA and SU2C cohorts, respectively (Table S3A,B; see Detailed Materials and Methods). We then used VIPER to transform the transcriptional profiles of the TCGA and SU2C cohorts into protein activity profiles, using their respective interactomes (Table S3C,D). Differential expression signatures for VIPER analysis were computed using as reference a combination of all RNA seq profiles from the GTEx normal prostate cohort (n = 245) (47) and a humanized version of normal mouse prostate tissue (see Detailed Materials and Methods). This approach allowed identification of MR proteins that are specifically dysregulated in the tumor context compared to normal prostate.
To identify cognate models on an individual patient basis, we generated protein activity signatures by comparing each GEMM-DT to the same reference as above. We then assessed the fidelity of each of the GEMM-DTs to each individual TCGA or SU2C patient by assessing the enrichment of the 25 most activated (25↑) and 25 most inactivated proteins (25↓) of each human tumor, representing its candidate MR proteins (MR proteins hereafter for simplicity), compared with MR proteins differentially active/inactive in each GEMM-DT (Fig. 4A,B; Table S4A,B). We used a fixed number of MR proteins (i.e., 25↑+25↓) since: (i) this is required to make the statistics of enrichment analyses comparable across proteins and cohorts; and (ii) we have previously shown that an average of 50 MRs is sufficient to account for the canalization of functionally-relevant genetic alterations in the vast majority of TCGA samples (22). For simplicity we refer to these 25↑+25↓ MR proteins as the MR-activity signature. Having assessed enrichment of their MR-activity signatures, we selected a highly conservative statistical threshold (P ≤ 10-5) to nominate high-fidelity, cognate GEMMs-DTs (see Detailed Materials and Methods).
Analysis of primary tumors from the TCGA cohort revealed that 78% had at least one high-fidelity cognate GEMM-DT (n = 261/334; Fig. 4A; Table S4A). Strikingly, analysis of PCa metastases from the SU2C cohort revealed an even greater fraction (93%) of patients with high-fidelity cognate GEMM-DTs (n = 198/212) and, on average, 48 cognate GEMM-DTs were identified as significant cognate models (P ≤ 10-5) for each SU2C tumor (Fig. 4A; Table S4B). This likely reflects the inherent bias of the GEMM cohort towards more aggressive PCa phenotypes (see Fig. 3). Heatmap representation of the matched patients and GEMM-DTs shows good clustering of patient and GEMM-DTs in the same subtype (C1 – C5). While most patients were matched to multiple GEMM-DTs, we highlight the GEMM-DTs representing the top 5 most statistically significant MR-based matches for each patient (i.e., the highest-fidelity models, Fig. 4A), since these would provide the best models for co-clinical studies. As expected, given the more aggressive nature of the SU2C patients, highest-fidelity models for the TCGA and SU2C cohorts formed distinct clusters. These findings demonstrate that individual tumors from the GEMM cohort (GEMM-DTs) represent high-fidelity surrogates for individual PCa patients. Furthermore, most of the patients with aggressive PCa, who would benefit most from co-clinical validation of novel treatments in vivo, are represented by at least one GEMM-DT.
Generation of drug perturbational profiles to identify MR-inverter drugs:
To generate drug perturbations for predicting optimal drug treatments, we first identified cell lines that most closely recapitulate the MR signature of the patients. Specifically, we performed VIPER analyses on gene expression signatures for each of the 10 prostate cancer cell lines available in the Cancer Cell Line Encyclopedia (CCLE), and compared these data with the corresponding data from the TCGA (Fig. S7A–C) and SU2C (Fig. S7D–F) cohorts (27). This analysis identified two PCa cell lines—the androgen-dependent LNCaP and the androgen-independent DU145 lines—that jointly provided high-fidelity models for >80% of the tumors in the TCGA cohort, based on MR-activity signature conservation (Fig. S7A,D) (27). Although drug predictions using either LNCaP or DU145 perturbation profiles were concordant (27), to identify optimal treatments for PCa patients with aggressive tumors, our subsequent analyses focused primarily on the more aggressive, AR-independent DU145 cell line.
Specifically, drug MoA was assessed from RNA-seq profiles of DU145 or LNCaP cells harvested at 24h following treatment with 117 FDA-approved and 218 late-stage experimental (i.e., in Phase II and III clinical trial) drugs, as well as vehicle control (DMSO) (i.e., n = 335 drugs in total, Table S5A). To minimize activation of cell death or cellular stress pathways that would confound assessment of drug MoA, cells were treated with the 48h EC20 concentration of each drug (i.e., highest sublethal concentration), as assessed from 10-point drug response curves (see Methods). RNA-seq profiles were generated using PLATE-Seq, which was specifically designed to generate profiles of drug perturbations (48).
For each drug, differential protein activity profiles, representing the drug’s MoA, were then generated by VIPER analysis of drug vs. vehicle control-treated cells (Table S5B; see Detailed Materials and Methods). Cluster analysis of differentially activated proteins following drug treatment with the most bioactive agents—i.e., 115 drugs inducing the most significant differential protein activity patterns—identified 11 drug clusters (D1 – D12) based on differential activation/inactivation of 13 protein sets (programs) (P1 – P13) (Fig. S8). Consistent with the analysis, drugs presenting similar MoA were clustered together or in closely related clusters. For instance, cytotoxic drugs cosegregated in clusters D1, D2, D5, D7 and D8, while kinase inhibitors were found mostly in clusters D3, D10, and D12, including a majority of MAPK (i.e., sorafenib, dabrafenib, vemurafenib, trametinib), EGFR inhibitors (i.e., lapatinib, erlotinib, vandetanib), and mTor inhibitors (i.e., everolimus, temsirolimus) in D12. Similarly, a subset of hormone blockade drugs (i.e., anastrazole, enzalutamide, abiraterone, mitotane) clustered in D6 and D9, and another subset (i.e., raloxifene, leuprolide, exemestane, tamoxifen) in D3 and D4. Folate (i.e., methotrexate, pralatrexate) and microtubule inhibitors (i.e., paclitaxel, ixabepilone) clustered in D4, while proteasome inhibitors (i.e., ixazomib, carfilzomib, bortezomib) presented very similar profiles in D11 and D12. In contrast, as expected, more pleiotropic drugs with broad-spectrum MoA, such as HDAC inhibitors (i.e., vorinostat, panobinostat, belinostat), CRBN inhibitors (i.e., thalidomide, lenalidomide, pomalidomide), and de-methylating agents (i.e., decitabine, azacytidine), were broadly distributed across multiple clusters. Given the high reproducibility of replicate perturbational profiles from the same drug (P ≪ 0.05, by 2-tail enrichment analysis), for the majority of the 115 bioactive compounds, and the diversity of the differential protein activity they induce, this suggests that the perturbational profiles generated for this study effectively inform on drug MoA (27).
Using OncoLoop to predict candidate drugs for individual patients:
To predict candidate drugs, we identified those for which the MR-activity signature of both a patient and its cognate GEMM-DT was significantly inverted in drug-treated vs. vehicle control-treated cells (MR-inverter drugs) (Fig. 5A–C). Since our goal is to identify treatments for patients with advanced, rather than indolent, PCa, we focused on the metastatic patients in the SU2C cohort and their cognate GEMM-DTs (which could be identified for 93% of the SUC2 patients; see Fig. 4). For each SU2C patient and each cognate GEMM-DT, MR-inverter drugs were identified by enrichment analysis of the respective top 25↑ and 25↓ MR proteins (see Fig. 4) compared with the MR activity signatures of the drug-treated vs. vehicle control-treated cells, at a conservative statistical threshold (P ≤ 10−5) (Table S5C,D).
Figure 5: OncoLoop analysis.

A. Illustrative examples of a PGD-Loop: three heatmaps representing a subset of patients, GEMM-DTs, and drugs are shown. The top left heatmap (OncoMatch: Patient vs. GEMM-DT) shows the fidelity scores for 56 SU2C samples (columns) and 5 GEMM-DTs (rows); the bottom left heatmap (OncoTreat: Patient vs. Drug) shows the MR-inverter scores for 28 drugs (rows), as assessed against 56 SU2C samples (columns); finally, the top right heatmap (OncoTreat: GEMM-DT vs. Drug) shows the MR-inverter scores for the same 28 drugs (columns) as assessed against the 5 GEMM-DTs (rows). All scores are computed as () and statistically significant scores (P ≤ 10−5) are shown with a light to dark color scale, as indicated; non-significant scores are shown in white. MR-inverter scores are based on MR activity inversion analysis based on the drug- vs. vehicle control-treated DU145 cells. For visualization purposes, heatmap results are depicted by hierarchical clustering. Among the many statistically significant PGD-Loops, we highlight one formed by the SU2C sample SC_9182_T, his top-ranked cognate GEMM-DT (CMZ315), and the drug trametinib. (Created with BioRender.com). B. Circos plot showing all significant PGD-loops, including the one highlighted in panel A (thicker dotted curves). P-value calculated by integrating the three associated scores. C. GSEA plots for the three relationships in the highlighted PGD-loop, including (a) the patient to cognate GEMM-DT fidelity analysis (OncoMatch: Patient vs. GEMM-DT, left), (b) the MR-inversion score by trametinib, as assessed for the SU2C sample MRs (OncoTreat: Patient vs. Drug, middle), and (c) the MR-inversion score by trametinib, as assessed for the cognate GEMM-DT (OncoTreat: GEMM-DT vs. Drug, right). D,E. Drug prioritization: FDA approved drugs (n = 117) (rows) were prioritized as candidate MR-inverters of either patients from the SU2C cohort (n = 212) (columns in Panel A) or GEMM-DTs (n = 91) (columns in Panel B), using drug perturbation data from the DU145 cells. Drugs were filtered based on screened concentration (≤ 1uM) and patient coverage, i.e., only those identified as a MR-inverters for >50% of the human samples are included. Relevant phenotypic variables for either patients or GEMM-DTs are shown in bars at the top each heatmap. The MR-inverter score (, as computed by aREA) is shown using a white (P > 10−5) to dark blue heatmap (see legend). The blue barplots on the right summarize the number of patients or GEMM-DT predicted as sensitive to each drug. Black arrows to their right point to candidate drugs selected for validation, while the grey arrows point to cabazitaxel, the standard-of-care for mCRPC. In panel B, the yellow barplot at the top shows the number of drugs identified as significant MR-inverters for each GEMM-DT and the rectangle indicates the allografts used for validation. See also Tables S5, S6, and Figures S7, S8, and S9.
The resulting PGD-loops—comprising a patient, its cognate GEMM-DT, and the candidate MR-inverter drugs (Fig. 5A,B)—were ranked based on the Stouffer’s integration of three z-scores, corresponding to: (i) zPG, the GEMM vs. patient MR-activity conservation z-score (Table S4B); (ii) zPD, the patient-specific MR-inverter drug z-score (Table S5C); and (iii) zGD, the cognate GEMM-DT-specific MR-inverter drug z-score (Table S5D). Considering all possible combinations of SU2C patients (n = 212), GEMM-DTs (n = 91), and drugs (n = 337), there were >6.5M potential PGD-loops; of these 668,138 achieved statistically significance (P ≤ 10-5) on all three z-scores (Table S6). Notably, the extensive coverage of both GEMM-DTs and drugs for the SU2C patients, which on average was 48 cognate GEMM-DTs (P ≤ 10-5) for each SU2C tumor (see Fig. 4) and 22 FDA-approved candidate MR-inverters (P ≤ 10-5) for each SU2C tumor/cognate-GEMM-DT pair, supports the use of OncoLoop in a co-clinical setting.
To provide a visual representation of OncoLoop, we show three heatmaps reporting the statistical significance of model fidelity (OncoMatch), and drug MR-inversion analyses (OncoTreat) for a subset of SU2C patients (n = 56), their cognate GEMM-DTs (n = 5), and drugs (n = 28), which were especially enriched in statistically-significant PGD-Loops (Fig. 5A). For illustrative purposes, we highlight a PGD-loop defined by an mCRPC patient (SC_9182_T), his cognate GEMM-DT (CMZ315)—harboring mutation of p53, a gene that is frequently dysregulated in human CRPC (see Fig. S1A)—and the MEK inhibitor trametinib (Fig. 5A,B). Notably, as evident by GSEA, all three Normalized Enrichment Score (NES) values for this PGD-Loop were highly significant, including for the model fidelity analysis (NES = 8.14, P = 4.1×10⁻¹⁶), as well as for the patient-specific (NES = −5.47, P = 4.4×10⁻⁸), and cognate GEMM-DT-specific trametinib-mediated MR-inversion (NES = −4.99, P = 6.2×10⁻⁷) (Fig. 5C), resulting in a highly significant integrated, OncoLoop p-value (NES = 10.71, P = 4.6×10⁻²⁷).
Co-clinical validation in cognate GEMM-DTs:
To optimize the clinical translation of this approach and to capture Oncoloop predictions for a majority of patients, we focused on PGD-Loops comprising drugs that were both clinically-available and most recurrently predicted for SU2C patients (Fig. 5D). Specifically, we considered only FDA approval drugs (n = 117), predicted for ≥ 50% of the SU2C tumors, and active at physiologically-relevant concentrations (≤ 1μM), thus yielding 16 candidate drugs for validation. Cluster analysis of their MR-inversion z-score for individual SU2C tumors (i.e., predicted drug sensitivity) identified 5 clusters, representing subsets of patients predicted to be sensitive to the same drugs (i.e., pharmacotypes; see Methods) (Fig. 5D). Independent stratification of the GEMM-DTs, also considering only FDA approval drugs active at physiologically-relevant concentrations (≤ 1μM), identified the same top 16 drugs (Fig. 5E), thus further confirming the representative nature of these cognate models. Consistent with our model fidelity-based expectations, pharmacotyping analyses using LNCaP perturbation profiles produced results that were similar to those from DU145 cells (Fig. S9A,B).
Among the 16 prioritized drugs, we eliminated those with overlapping MoA (e.g., multiple HDAC inhibitors) or lacking demonstrated variable efficacy in prior PCa clinical trials, thus yielding four candidate drugs for experimental validation: temsirolimus (m-TOR inhibitor) (NCT00919035, NCT00012142) (49); trametinib (MEK inhibitor) (NCT02881242, NCT01990196), panobinostat (HDAC inhibitor) (NCT00667862, NCT00878436) (50), and bortezomib (proteosome inhibitor) (NCT00193232, NCT00183937). As a negative control, we selected cabazitaxel—a current standard of care for advanced PCa that has variable efficacy in patients (8)— which was predicted as a significant MR-inverter for the human tumors but not for their cognate GEMM-DTs.
To test drug sensitivity predictions, we performed tumor growth assays in allografts derived from two cognate GEMM-DTs, namely CMZ315 and CMZ150 (Fig. 6A–G; Fig. S10A–F). These represent two of the aggressive GEMM clusters, C3 and C4, and were derived from p53-mutated and MYC-amplified mCRPC GEMM tumors, respectively (Table S1). For each drug, we used their published conditions for in vivo mouse studies to determine their appropriate concentration and treatment schedule, and we also confirmed their uptake into allograft tumors, by pharmacokinetic assays (Fig. S10A; see Detailed Materials and Methods).
Figure 6: Co-clinical validation of OncoLoop-predicted drugs using GEMM-derived models.

A-G. Validation in an allograft tumor model. A. Selected drugs were validated in vivo, in allograft models derived from the cognate GEMM-DT CMZ315. Allografts were grown subcutaneously in nude mouse hosts and the mice were treated with predicted drugs, vehicle control, and a negative control (cabazitaxel) for the times indicated. Following sacrifice, the tumors were collected and analyzed as indicated. (Created with BioRender.com). B. Summary of tumor volume changes over the treatment period. C. Summary of tumor weights, following sacrifice. P-values for B and C were computed by one-way ANOVA at the last time point, compared to Vehicle treated tumors and adjusted for multiple hypothesis testing with Dunnett’s test (10 animals were enrolled to the vehicle control arm and 5 animals were enrolled on each of the drug treatment arms). D, E. Representative images of final tumor sizes in vehicle control and negative control-treated allografts (D) and allografts treated with predicted drugs (E). F. Pharmacodynamic assessment of MR-inversion by GSEA analysis for the four predicted drugs comparing drug-mediated of the drug- versus vehicle-treated tumors. G. Enrichment analysis of selected immune- and cancer-related pathways based on the differential of protein activity profiles between drug and vehicle control-treated GEMM-DT CMZ315 allografts at the end of study. H-J. Validation in a syngeneic metastasis model. H. Predicted drugs were validated in vivo for their effectiveness to inhibit metastasis using a syngeneic model. NPKEYFP cells were delivered by intracardiac injection into immunocompetent mice and drugs were administered individually and in combination with a PD-1 inhibitor. (Created with BioRender.com). I. Representative images of spine and liver metastasis visualized by ex vivo fluorescence of YFP-expressing tumor cells for each experimental group. J. Quantification plots showing metastasis area (for spine) or metastasis number (for liver) based on two independent experiments each with n=5 mice per group. P values were obtained by one-way ANOVA with Dunnett’s multiple comparisons against vehicle. See also Figures S10 and S11.
Three of the four predicted drugs—namely temsirolimus, trametinib, and panobinostat—significantly reduced tumor volume and weight in allografts from both of the cognate GEMM-DTs (P ≤ 0.01, one-way ANOVA, Fig. 6A–D; Fig. S10C–F), while bortezomib emerged as a false positive since it did not significantly inhibit tumor growth in either allograft. Also consistent with predictions, cabazitaxel induced only modest tumor volume/weight reduction, which was borderline significant in only one of the two allografts. To ask whether these drugs produced a quantitatively different effect in models predicted to have higher vs. lower sensitivity, based on OncoLoop statistics, we assessed the effect of these same three drugs in an alternative p53-driven allograft (CMZ163) where panobinostat was only borderline statistically significant (NES = 3.2) and temsirolimus and trametinib were predicted as the best (NES = 16.55) and second best (NES = 13.63) drugs, respectively (Fig. S10B). Notably, tumor growth inhibition was highly consistent with the OncoLoop prediction statistics, with panobinostat showing a lower reduction in tumor volume compared with temsirolimus and trametinib (Fig. S10G–I).
To better understand the effect of drugs on both MR activity and on the activity of cancer-relevant pathways, we performed pharmacodynamic studies (Fig. 6F,G). First, we analyzed RNA-seq profiles of tumors following short-term (5-day) drug- vs. vehicle control-treated CMZ315 allografts to assess MR-activity inversion before significant tumor cell death or necrosis could ensue. Confirming OncoLoop predictions, all four candidate drugs induced highly significant MR-inversion in vivo, as evidenced by GSEA analyses showing significantly negative NES values (P < 10-7, for all tested drugs, by 1-tail aREA test; Fig. 6F). However, analysis of RNA-seq profiles from end-of-study samples showed that key cancer-related pathways were inverted only by the drugs that inhibited tumor growth—namely, temsirolimus, trametinib, and panobinostat—but not by those who failed to inhibit it—namely, bortezomib or cabazitaxel (Fig. 6G). Indeed, bortezomib was the only drug that, while inverting the MR-activity signature also reprogrammed the tumors to a state with highly aberrant activity of Myc and DNA-repair related pathways (Fig 6G).
Notably, in addition to cancer related pathways, immune-related pathways were also significantly re-activated in tumors treated with predicted drugs, compared to the vehicle control-treated animals, but not in cabazitaxel-treated animals (Fig. 6G). The effect was especially significant for panobinostat and trametinib, suggesting that these drugs may cooperate with immune checkpoint inhibitors. Taken together, these findings (i) confirm that drugs predicted via OncoLoop to mediate MR-inversion are frequently capable of abrogating tumor growth when experimentally validated in vivo, (ii) support the hypothesis that drug-mediated MR inversion is predictive of tumor growth inhibition, and (iii) further suggest that treatment with predicted drugs can influence immune pathways, as previously reported (22).
Co-clinical validation in clinically-relevant contexts:
Having demonstrated that OncoLoop predictions can be validated in cognate allograft tumor models in vivo, we next sought to validate the OncoLoop predictions in contexts that are more clinically-relevant for human PCa, namely CRPC and metastasis. First, we asked whether OncoLoop-predicted drugs cooperate with the 2nd-generation anti-androgen enzalutamide in hormone-sensitive and castration resistant contexts (Fig. S11A–G). Using the MR-matched CMZ315GEMM-DT allograft (as above), we found that enzalutamide treatment increased rather than decreased tumor growth in castrated but not in intact mice (P < 0.01; Fig. S11B,E), consistent with previous studies (e.g., (34,51)). However, when combined with the predicted drug trametinib, enzalutamide treatment resulted in decreased rather than increased tumor growth in castrated mice (P < 0.01; compare Fig. S11B–D and E–G). These finding suggest that OncoLoop predictions may enhance the efficacy of 2nd-generation anti-androgens in patients with CRPC.
Second, we investigated the ability for the OncoLoop-predicted drugs to inhibit metastasis in immunocompetent mice. Toward this end, we used an MR-matched syngeneic cell model derived from a bone metastasis of an NPK GEMM (30) to test the ability of OncoLoop-predicted drug to inhibit metastasis (Fig. 6H–J; Fig. S10B). Notably, among the top-predicted drugs were trametinib and temsirolimus (Fig. S10B), which also showed significant rescue of the negative immune and inflammation-related pathways enrichment following treatment (see Fig. 6G). Given these observations and since this metastasis model is propagated in immunocompetent C57BL/6 mice, we evaluated the efficacy of these predicted drug to inhibit metastasis both alone and in combination with the mouse equivalent of the PD1 inhibitor, nivolumab (Fig. 6H–J). Indeed, temsirolimus and trametinib significantly inhibited metastasis, both in bone (spine) and in soft tissues (liver) (P < 0.001; Fig. 6I,J). Furthermore, while nivolumab alone was only modestly effective for inhibition of metastasis, its combination with either temsirolimus or trametinib yielded virtually no metastases in this model (P < 0.0001; Fig. 6I,J). These findings demonstrate OncoLoop’s utility in predicting drugs likely to have an impact on the clinical care of CRPC and mCRPC patients and are also consistent with our previous findings that MR activity inversion contributes to modulating immune and inflammation-related pathways (22).
Co-clinical validation in cognate human PDX models:
Lastly, to assess whether OncoLoop-predicted drugs were effective in a cognate human tumor context, we performed analogous co-clinical studies using the well-characterized LuCaP series of PDX models, which were established from primary tumors and metastases obtained from University of Washington Tissue Acquisition Necropsy program (15). Notably, the LuCaP PDX models were developed from biologically heterogeneous advanced PCa tissues from primary and metastatic sites and include a range of tumors that vary in their response to castration, with some displaying castration-sensitivity (15).
To identify cognate PDX models to the GEMM models used for drug predictions, we first generated RNA-seq profiles for 5 LuCaP PDX models that had been perturbed with multiple drugs and used these RNA-seq profiles to generate a PDX interactome (Table S7A; see Detailed Materials and Methods). Among all 5 baseline LuCaP PDX models, VIPER analysis identified LuCaP-73 as the most significantly matched to the GEMM-DTs used herein (Fig. 7A). Furthermore, among the candidate drugs identified for the human tumors (see Fig. 5D), several were identified as significant MR-inverters for the LuCaP-73 PDX, including trametinib and panobinostat (Fig. 7B; Fig. S10B; Table 7B). We therefore tested whether these two drugs could abrogate LuCaP-73 viability in vivo. Indeed, both trametinib and panobinostat showed near-complete tumor growth inhibition (P < 0.0001; Fig. 7C–F). These findings provide further support for the translation of OncoLoop to a human PCa context.
Figure 7: Co-clinical validation of OncoLoop-predicted drugs using a human PDX model.

A, B. OncoLoop analysis of patient derived xenograft (PDX) models: A. Similar to Figure 5A, three heatmaps are shown, representing the fidelity and MR-inverter scores for 4 LuCaP PDX tumors (columns in left heatmaps), 5 GEMM-DTs, and 28 drugs. The rectangles show a representative PGD-Loop, comprising a PDX (MC005/LuCaP73), its cognate GEMM-DT (CMZ315), and two of the top-predicted drug candidates evaluated in the allograft models (panobinostat and trametinib). For visualization purposes, heatmaps were clustered as in Figure 5A. B. GSEA used to compute panobinostat’s and trametinib’s MR-inverter P-values for the MC005/LuCaP73 model. C-F. Validation in the PDX model. C. The MC005/LuCaP73 PDX was grown in nude mouse hosts and treated with predicted drugs or vehicle for the times indicated. (Created with BioRender.com). D. Summary of changes in tumor volume over the treatment period. E. Summary of tumor weights following sacrifice. P-values for C and D were computed by one-way ANOVA at the last time point, compared to vehicle control-treated models and adjusted for multiple hypothesis testing with Dunnett’s test. F. Representative images of final tumor sizes. G. Pharmacotype analysis: Identification of patient subsets predicted to be sensitive to the same drugs by cluster analysis. Four subtypes are identified, including patients with highest predicted sensitivity to temsirolimus, trametinib, and panobinostat, as well as patients for which none of the three drugs were statistically significant. For each patient, the score of the most statistically significant MR-inverter drug is shown using a white (non-significant) to dark-blue color map, see legend; the second most significant drug is shown using a white (non-significant) to dark-red color map, see legend. This heatmap provides the rationale for a possible umbrella or combination trial where each patient (column) could be randomized to the most statistically significant MR-inverter drug (rows) validated in the preclinical study, based on its MR-inversion score, or to the combination of the two most significant drugs. The barplots to the right show the total number of patients predicted to be sensitive to each drug, as either most significant (blue) or second best selection (red). See also Table S7.
Discussion
Predicting individualized drug efficacy in human patients remains a key challenge in precision medicine, and relatively few approaches have been described to identify models that best recapitulate patient-relevant drug response (6). To address these challenges, we have developed OncoLoop, which uses quantitative protein activity-based metrics to first identify high-fidelity and preexisting models for individual patient’s tumors, then to predict drug efficacy for a given patient’s tumor and its cognate model, and lastly to validate the drug predictions in the preexisting cognate model. In the current study, we demonstrate the effectiveness of OncoLoop in the context of PCa. In particular, by leveraging an extensive and diverse collection of GEMMs, we find that > 90% of mCRPC patients in a published PCa cohort are represented by at least one cognate GEMM-DT. We then use large-scale drug perturbation data from an MR-matched PCa cell line to predict MR-inverter drugs for the patients and their cognate models. The predicted MR-inverter drugs were experimentally validated in allografts from the GEMM-DT series, in a syngeneic model of metastasis, and a in a PDX model of human PCa. Notably, OncoLoop-predicted drugs enhanced efficacy of clinically relevant drugs in both castration resistant and metastatic contexts. These results suggest that OncoLoop could be a useful methodology to evaluate candidate drugs for clinical trials, including umbrella and basket trials, based on in vivo validated drug stratification across models representing distinct pharmacotypes (Fig. 7G). In addition, OncoLoop provides an accurate and versatile framework for both predicting and evaluating individualized drug treatments in real-time. Notably, since all of the resources described herein are available to the research community, OncoLoop could be readily applied to PCa in clinical practice.
Beyond PCa, OncoLoop is readily generalizable for predicting both cognate models and drug sensitivity for other cancers, as well as in non-cancer-related contexts. Notably, large-scale human, GEMM, and/or PDX cohorts are now available for many cancer types. In addition, we have already generated genome-wide perturbational profiles in cell lines, comprising representatives for 23 distinct tumor subtypes (see (27) for partial coverage of the PanACEA database). Critically, the ability to stratify drug sensitivity in precisely identified molecular subtypes (pharmacotypes), if further validated, may lead to rapid design of basket and umbrella trials, including using adaptive design approaches to efficiently replace baskets that fail to validate.
Nonetheless, there are also several caveats that will benefit from further refinements. First, despite the benefit of using FDA-approved drugs for rapid translation to clinical practice, the down-side of focusing only on drugs that are FDA-approved or in Phase II/III trials, is that such drugs may not be optimal for targeting the MR proteins most relevant for the tumors. Therefore, in future studies, extension to additional experimental agents may expand the repertoire of effective drugs, especially considering the new classes of PROTACS (52) and antisense agents (53). Furthermore, we note that the drugs tested in these studies in mice are not pharmaceutical grade as would be used in humans, which represents a potential limitation of the work. Additionally, drug perturbation profiles are limited by the availability of appropriate cell lines MR-matched to human patients. For example, the current study does not adequately inform on drugs that target NEPC tumors since neither the LNCaP nor the DU145 cell line recapitulate the MR-activity signature of this subtype. This could be addressed in future studies by generating drug perturbation profiles from primary, NEPC patient-derived cells or organoids. Similarly, the focus of the current studies is on predicting drugs that target the tumor rather than stromal or immune cells, which could also be addressed in future studies using appropriate drug perturbation analyses, as shown for instance for T regulatory cells (54).
Moreover, despite the encouraging results reported here, MR signature analysis and MR-inverter drug predictions are not 100% accurate, as is the case for most machine learning methods. This can depend on multiple causes. For instance, MR-activity inversion may lead to multiple distinct cell states, some of which may still be oncogenic and viable, as shown for bortezomib. In addition, since drug prioritization is based on overall MR inversion signature the effect of MRs that are more likely to elicit essentiality is not directly accounted for.
Another key caveat is the largely heterogeneous nature of most tumors, which present molecularly distinct subpopulations with potentially equally distinct drug sensitivity. Thus, when used to analyze bulk tumor profiles, OncoLoop may miss the opportunity to nominate drugs targeting the less represented subpopulations, thus selecting for drug-resistant ones and ultimately leading to relapse. A possible way to overcome this is to perform OncoLoop analyses at the single cell level, which should enable prioritization of drugs for all detectable subpopulations (55). A second approach is to perform analysis on the post-treatment minimal residual tumor mass, which is likely highly enriched for resistant subpopulations (56,57). Additionally, while OncoLoop predictions are transcriptome-based, recent results show that additional omics modalities, such as a patient’s mutational profile and protein structure, among others, can be readily integrated to further refine MR protein identification and drug prediction (22).
Beyond cancer, MR-based predictions have been validated in disease as different as Parkinson’s (58), ALS (59), alcohol dependency (60), and Type II diabetes (61), suggesting direct OncoLoop applicability to such contexts, as long as appropriate drug-perturbation data were available. Indeed, while human translation of drugs validated in a GEMM or PDX context has been reasonably effective in cancer, mouse models have largely failed to recapitulate the effect of drugs on human disease. In this context, OncoLoop’s quantitative fidelity metrics may help to identify more appropriate mouse models for drug validation.
The current design of OncoLoop relies on MR-based predictions of model similarity and drug sensitivity. However, alternative approaches could also be tested using the same framework presented here. For instance, transcriptome-based approaches have shown promising results in predicting sensitivity of human patients in a clinical context (62), while neural network-based methods trained on multi-omics data have shown promising results in translating drug sensitivity assays from a training set of cell lines and mouse models to an independent test set of PDX models (63). Similarly, transcriptome-based approaches for assessing model fidelity have also been proposed (64).
Taken together, our data shows that OncoLoop may provide a valuable contribution to the emergent field of precision medicine, by complementing rather than supplanting existing approaches based on its ability to couple effective drug and high-fidelity model predictions.
Materials and Methods
Genetically engineered mouse models (GEMM) of prostate cancer
All experiments using animals were performed according to protocols approved by the Institutional Animal Care and Use Committee (IACUC) at Columbia University Irving Medical Center (CUIMC). The GEMMs in this study utilize the Nkx3.1CreERT2/+ allele to activate an inducible Cre recombinase in prostatic epithelium (35). The Nkx3.1CreERT2/+ allele was crossed with various other mouse alleles to achieve conditional deletion or conditional activation in the prostatic epithelium, or with the Hi-Myc transgene (39). For lineage tracing, mice were further crossed with a conditionally-activatable fluorescent reporter allele (Rosa-CAG-LSL-EYFP-WPRE) (42). All mice were maintained on a mixed strain predominantly C57BL/6 background. Since the focus of our study is prostate cancer, only male mice were used. All multi-allelic strains are available from the Jackson laboratory (Table S1A). Mice were induced to form tumors at 2–3 months of age by administration of 100 mg/kg tamoxifen (Sigma-Aldrich T5648, St. Louis, MO) in corn oil; control mice received corn oil alone. Following tamoxifen-induction, mice were monitored three times weekly, and euthanized when their body condition score was <1.5, or when they experienced body weight loss ≥ 20% or signs of distress, such as difficulty breathing or bladder obstruction. Surgical castration was performed at 1–10 months after tumor induction (Table S1A). Tumor volume was monitored by Magnetic Resonance Imaging (MRI) using a Bruker 9.4T Biospec Biospec Magnetic Resonance Imager (RRID:SCR_018054). Volumetric analysis was done using 3DSlicer software (http://www.slicer.org, RRID:SCR_005619).
At the time of sacrifice, tissues were collected and YFP-positive prostatic tumors and metastases were visualized by ex vivo fluorescence using an Olympus SZX16 microscope (Ex490–500/Em510–560 filter). For histopathological analysis, tissues were fixed in 10% formalin (Fisher Scientific, Fair Lawn, NJ), and hematoxylin and eosin (H&E) and immunostaining were done using 3 μm paraffin sections as described (30,34). Histopathological scoring of GEMM prostate cancer phenotypes is summarized in Table S1A,B.
Following protocols approved by IACUC at CUIMC, allografts were generated by transplanting freshly dissected prostate tissues from the GEMMs subcutaneously into the flank of male Athymic nude mice (Hsd:Athymic Nude-Foxn1nu, Envigo, Boyertown PA, RRID:MGI:5652489). Allografted tumors were harvested when their size reached 2 cm or earlier if the body condition score of the host mouse was <1.5 or the mice exhibited signs of distress. A summary of allografted tumors is provided in Table S1A. Mouse tumor organoids were generated as described (65). A summary of organoids is provided in Table S1A. A syngeneic model of metastasis was adapted from a previously established cell line from prostate cancer bone metastasis of intact NPKEYFP mice (30).
Transcriptomic analysis of GEMMs
RNA-seq data was generated from 136 GEMM-derived tumors (GEMM-DTs) or GEMM-derived normal prostate (Table S2A). RNA was prepared by homogenization in TRIzol Reagent (Invitrogen; Waltham, MA) and total RNA was enriched for mRNA using poly-A pull-down. Samples were sequenced using an Illumina HiSeq2500/4000 or NovaSeq6000, and RNA-seq profiles were mapped to the mouse reference genome (version GRCm38 mm10). A GEMM PCa-specific regulatory network (interactome) was reverse engineered from the resulting136 RNA-seq profiles using ARACNe (29).
Subsequent analyses focused on a subset of 91 GEMM-DTs that recapitulated pathophysiologically-relevant prostate cancer phenotypes (Table S1B). The VIPER algorithm (23) was used to transform RNA-seq profiles of each GEMM-DT into differential protein activity profiles. The resulting regulatory network, comprising regulons of 2,794 regulatory proteins, is summarized in Table S2B.
Patient-Derived xenograft (PDX) model analysis
Following protocols approved by IACUC at CUIMC, LuCaP PDX lines 73, 77, 78, 81 and 147 (15) were continuously maintained by passage in male CIEA NOG mice (Taconic, Germantown, New York, USA, RRID:IMSR_TAC:HSCFTL-NOG). Xenografts were harvested when the tumor size reached 2 cm or earlier if the body condition score of the host mice were <1.5 or if they exhibited signs of distress. When the Xenograft tumors were 7–8mm in diameter, the host mice were castrated or left intact (mock surgery). Three days later, the mice were treated with either vehicle or one of 13 selected perturbagens as described in (20). On the afternoon of the fifth day of treatment, mice were euthanized and tumors were collected and snap-frozen in liquid nitrogen, for a total of 140 samples (5 models, 14 treatments, 2 castration states). RNA sequencing profiles were obtained as described above for the GEMM-DT cohort. A Xenograft interactome was generated from the 120 highest quality xenograft-derived RNA-seq profiles, as described for the GEMM cohort. Results are provided in Table S7A.
Human patient cohort analysis
For the analysis of human PCa tumors and normal prostate, we collected n = 790 RNA-seq profiles from published sources, including profiles from: (a) 245 normal prostate tissues from the GTEx consortium (version 8, date 2017–06-05) (47); (b) 333 treatment-naïve, clinically-annotated primary prostate adenocarcinoma samples in TCGA (25); and (c) 212 metastatic biopsies from the Stand Up to Cancer cohort (SU2C) (26). The primary prostate tumor interactome was generated using full set of 498 patients in the TCGA PCa cohort (25); data are provided in Table S3A. The SU2C interactome was generated using n = 212 patients for which RNA-seq data is available; data are provided in Table S3B. Differential protein activity was measured by VIPER analysis; protein activity profiles are provided in Tables S3C,D.
OncoMatch analysis
For this analysis, we used protein activity signatures from individual GEMM-DT or PDX tumors to compute the NES of the 25↑+25↓ most differentially active proteins, as assessed by VIPER, as in (24). The aREA algorithm (23) was used to estimate Normalized Enrichment Scores (NES) that were converted to P-values. The conservative Bonferroni method was used to correct for multiple hypothesis testing and the value was used as an MR conservation-based fidelity score. Results for all TCGA and SU2C cohort samples are provided in Tables S4A and S4B, respectively.
Drug perturbation analyses
LNCaP (RRID:CVCL_0395) and DU145 (RRID:CVCL_0105) human prostate cancer cells were obtained from the American Type Culture Collection (ATCC), which verifies their authenticity. Cells were maintained under mycoplasma-free conditions and only low passage cells were used. These cell lines were identified as the pair with the optimal joint coverage of TCGA and SU2C cohorts (P ≤ 10−5) and were thus selected for drug perturbation assays. For drug perturbation analyses, the maximum sublethal concentration (defined as its 48h EC20 concentration) was first defined for each drug. Following which, cells were seeded onto 384-well tissue culture plates and approximately 12h later, compounds were added at their EC20. Cells were harvested at 24h after perturbation and subject to PLATE-Seq analyses (48). The drug perturbation data are provided in Table S5B.
OncoTreat Analysis
This analysis was performed as described in (21). Briefly, drug-mediated MR inversion was independently assessed for each patient in the SU2C cohort and each GEMM as follows by assessing the NES of the sample’s MR-activity signature (25↑+25↓ most differentially active proteins). NES values were converted to P-values, and Bonferroni corrected to account for multiple hypothesis testing. An efficacy score was computed and used to identify MR-inverter drugs (, corresponding to ). Results of OncoTreat analyses for the SU2C and GEMM cohorts are provided in Table S5C and Table S5D, respectively.
OncoLoop Analysis
The OncoLoop algorithm leverages a tripartite graph TPG with nodes representing patients (), GEMM-DT ( and drugs (), respectively, and edges represent statistically significant GEMM-patient fidelity score ), GEMM-drug MR-inverter score ), and patient-drug MR-inverter score ). All closed 3-node loops including a patient, a GEMM-DT, and a drug are considered as statistically significant PGD-Loops. These are then ranked based on the Stouffer’s integration of the z-scores corresponding to the , and values of the loop, which can then be converted back to a P-value. Results are summarized in Table S6.
Preclinical Validation of OncoLoop-predicted Drugs
Following protocols approved by IACUC at CUIMC, allograft models (NPp53mut CMZ315, NPp53mut CMZ163 and NPM CMZ150) were grown in the flanks of male Athymic nude mice (Hsd:Athymic Nude-Foxn1nu, Envigo, Boyertown PA, RRID:MGI:5652489). The LUCAP-73 PDX was grown in R2G2® mice (B6;129-Rag2tm1FwaII2rgtm1Rsky/DwlHsd, Envigo, RRID:IMSR_ENV:HSD-021). Tumors were monitored by caliper measurement twice weekly and tumor volumes were calculated using the formula [Volume = (width)2 x length/2]. When tumors reached 100–200mm3, mice with similar mean tumor volume were randomized into vehicle and treatment groups. For the syngeneic metastasis model, NPKEYFP cells (1×10⁵) were injected into the left heart ventricle of C57BL/6 male mice (Jackson Laboratory Cat#000664, RRID:IMSR_JAX:000664). Two days after the intracardiac injection, mice were randomly assigned to the vehicle and treatment groups.
Pharmaceutical grade (99% purity) compounds, namely temsirolimus (S1044), trametinib (S2673), panobinostat (S1030), bortezomib (S1013), cabazitaxel (S3022), and enzalutamide (S1250), were purchased from Sellekchem (Houston, TX). The monoclonal antibody anti-PD-1 (BE0146, RRID:AB_10949053) and the corresponding rat IgG2a anti-trinitrophenol isotype control (BE0089, RRID:AB_1107769) were purchased from Bio X Cell (Lebanon, NH). For each drug, the dosage, mode of delivery and schedule was chosen based on previous reports as follows: enzalutamide (10mg/kg) (66), temsirolimus (20mg/kg) (67), trametinib (1mg/kg) (68), panobinostat (15mg/kg) (69), bortezomib (1mg/kg) (70), cabazitaxel (10mg/kg) (71), and anti-PD-1(10mg/kg) (72). Drugs were administered via intraperitoneal delivery (i.p.) 3 times/week in non-consecutive days (temsirolimus, panobinostat, bortezomib, and cabazitaxel) or every 72 hours (anti-PD-1), or by oral gavage 5 times/week in consecutive days (trametinib and Enzalutamide). Tumors were harvested when the tumor size of vehicle treated mice reached 2 cm or earlier if the body condition score of the host mice were <1.5 or if they exhibited signs of distress. Tumors were fixed in 10% formalin to be processed for histology, or snap-frozen in liquid nitrogen. For the syngeneic metastasis model, mice were euthanized 12 days after intracardiac injection, and metastasis was analyzed by ex vivo fluorescence (30).
Statistical analyses
Statistical analysis was performed using GraphPad Prism software (Version 9.3.1) (RRID:SCR_002798) and R-studio (0.99.902, R v4.0.2) (RRID:SCR_000432). Kaplan-Meier survival analysis was performed using two-tailed log-rank test compared to the NP model. Comparison of frequencies was done using two-tailed Fisher’s exact test or as described in figure legends. Subcutaneous tumor growth curves were analyzed using One-way ANOVA at the last time point compared to Vehicle treated tumors, adjusted for multiple comparisons with Dunnett’s test. Metastasis was analyzed using One-way ANOVA compared to Vehicle treated group and adjusted for multiple comparisons with Dunnett’s test. All bars show the mean and error bars SD. No statistical method was used to predetermine the sample size used for in vivo experiments.
Data Accession
The following datasets are deposited in GEO: (a) The mouse gene expression profiles (raw and normalized data) (GSE186566) (b) The human PDX gene expression profiles (raw and normalized data) (GSE184427), and (c) The PLATE-seq data for the drug perturbation profiles in both LNCaP and DU145 cells (GEO199800).
Complete details of all materials and methods are provided in the Supplementary Materials.
Supplementary Material
Significance Statement.
OncoLoop is a transcriptomic-based experimental and computational framework that can support rapid-turnaround co-clinical studies to identify and validate drugs for individual patients, which can then be readily adapted to clinical practice. This framework should be applicable in many cancer contexts for which appropriate models and drug perturbation data are available.
Acknowledgements:
We thank Alvaro Aytes, Filippo Giancotti, Kenneth Olive, and Anil Rustgi, for comments on the manuscript. We are grateful to Sarah Bergen for assistance with PDX models. Some figure panels (as indicated) were created with BioRender.com using an institutional license sponsored by Columbia University’s VP&S Office for Research.
These studies were supported by Flow Cytometry, Genomics and High Throughput Screening, and Oncology Precision Therapeutics and Imaging Core facilities which are funded in part through Herbert Irving Comprehensive Cancer Center support Grant P30 CA013696, the Biomarkers Core Laboratory at the Irving Institute for Clinical and Translational Research, home to Columbia University’s Clinical and Translational Science Award UL1TR001873, the Translational Research Unit, Institute of Pathology, University of Bern, and the PDX core at the University of Washington, which is supported by the PNW Prostate Cancer SPORE P50CA097186 and P01CA163227. Funding to support the deposition of mouse strains at The Jackson Laboratories was provided by the TJ Martell Foundation for Leukemia, Cancer and AIDS Research and the Prostate Cancer Foundation
This work was supported by the NCI Cancer Target Discovery and Development Program (U01 CA217858, to AC), the Cancer Systems Biology Consortium (U54 CA209997, to AC), NIH Shared Instrumentation Grants (S10 OD012351 and S10 OD021764 to AC), R01 CA173481 (to CAS), R01 CA183929 (to CAS), P01 CA221757 (to CAS and MMS), P01 CA265768 (to MMS), R01 CA238005 (to MMS), U01CA261822 (to MMS), and a Prostate Cancer Challenge Award (to MMS and AC). AV was supported by a U.S. Department of Defense Early Investigator Research Award (W81XWH19-1-0337) and an Early Career Development Pilot Award NIH/NCI Cancer Center, funded through the Cancer Center Support grant, P30CA013696. MZ was supported in part by the National Center for Advancing Translational Sciences, National Institutes of Health, Grant Number UL1TR001873. JMA was supported by the Dean’s Precision Medicine Research Fellowship from the Irving Institute for Clinical and Translational Research at Columbia University Irving Medical Center (UL1TR001873), and a Prostate Cancer Foundation Young Investigator Award. MS was supported by NIH K99/R00CA194287. AM and ARC were each supported by a Prostate Cancer Foundation (PCF) Young Investigator Awards. LZ was supported by a Fondazione Ing. Aldo Gini Fellowship. C.A.S. is an American Cancer Society Research Professor supported in part by a generous gift from the F.M. Kirby Foundation.
A.C. is founder, equity holder, and consultant of DarwinHealth Inc., a company that has licensed some of the algorithms used in this manuscript from Columbia University. Columbia University is also an equity holder in DarwinHealth Inc.
M.J.A. is CSO and equity holder of DarwinHealth, Inc. Columbia University is also an equity holder in DarwinHealth.
E.C. received research funding under institutional SRA from Janssen Research and Development, Bayer Pharmaceuticals, KronosBio, Forma Pharmaceutics Foghorn, Gilead, Sanofi, AbbVie, and GSK.
MAR is on the Scientific Advisory Board of Neogenomics, inc.
Footnotes
Conflicts of interest:
None of the other authors report any conflicts of interest.
References
- 1.Mattar M, McCarthy CR, Kulick AR, Qeriqi B, Guzman S, de Stanchina E. Establishing and Maintaining an Extensive Library of Patient-Derived Xenograft Models. Front Oncol 2018;8:19 doi 10.3389/fonc.2018.00019. [DOI] [PMC free article] [PubMed] [Google Scholar]
- 2.Tentler JJ, Tan AC, Weekes CD, Jimeno A, Leong S, Pitts TM, et al. Patient-derived tumour xenografts as models for oncology drug development. Nat Rev Clin Oncol 2012;9(6):338–50 doi 10.1038/nrclinonc.2012.61. [DOI] [PMC free article] [PubMed] [Google Scholar]
- 3.Bleijs M, van de Wetering M, Clevers H, Drost J. Xenograft and organoid model systems in cancer research. EMBO J 2019;38(15):e101654 doi 10.15252/embj.2019101654. [DOI] [PMC free article] [PubMed] [Google Scholar]
- 4.Schutgens F, Clevers H. Human Organoids: Tools for Understanding Biology and Treating Diseases. Annu Rev Pathol 2020;15:211–34 doi 10.1146/annurev-pathmechdis-012419-032611. [DOI] [PubMed] [Google Scholar]
- 5.Kersten K, de Visser KE, van Miltenburg MH, Jonkers J. Genetically engineered mouse models in oncology research and cancer medicine. EMBO Mol Med 2017;9(2):137–53 doi 10.15252/emmm.201606857. [DOI] [PMC free article] [PubMed] [Google Scholar]
- 6.Usary J, Zhao W, Darr D, Roberts PJ, Liu M, Balletta L, et al. Predicting drug responsiveness in human cancers using genetically engineered mice. Clin Cancer Res 2013;19(17):4889–99 doi 10.1158/1078-0432.CCR-13-0522. [DOI] [PMC free article] [PubMed] [Google Scholar]
- 7.Siegel RL, Miller KD, Fuchs HE, Jemal A. Cancer Statistics, 2021. CA Cancer J Clin 2021;71(1):7–33 doi 10.3322/caac.21654. [DOI] [PubMed] [Google Scholar]
- 8.Sartor O, de Bono JS. Metastatic Prostate Cancer. N Engl J Med 2018;378(7):645–57 doi 10.1056/NEJMra1701695. [DOI] [PubMed] [Google Scholar]
- 9.Scher HI, Sawyers CL. Biology of progressive, castration-resistant prostate cancer: directed therapies targeting the androgen-receptor signaling axis. J Clin Oncol 2005;23(32):8253–61 doi 10.1200/JCO.2005.03.4777. [DOI] [PubMed] [Google Scholar]
- 10.Watson PA, Arora VK, Sawyers CL. Emerging mechanisms of resistance to androgen receptor inhibitors in prostate cancer. Nature reviews Cancer 2015;15(12):701–11 doi 10.1038/nrc4016. [DOI] [PMC free article] [PubMed] [Google Scholar]
- 11.Beltran H, Prandi D, Mosquera JM, Benelli M, Puca L, Cyrta J, et al. Divergent clonal evolution of castration-resistant neuroendocrine prostate cancer. Nat Med 2016;22(3):298–305 doi 10.1038/nm.4045. [DOI] [PMC free article] [PubMed] [Google Scholar]
- 12.Rickman DS, Beltran H, Demichelis F, Rubin MA. Biology and evolution of poorly differentiated neuroendocrine tumors. Nat Med 2017;23(6):1–10 doi 10.1038/nm.4341. [DOI] [PubMed] [Google Scholar]
- 13.Armenia J, Wankowicz SAM, Liu D, Gao J, Kundra R, Reznik E, et al. The long tail of oncogenic drivers in prostate cancer. Nat Genet 2018;50(5):645–51 doi 10.1038/s41588-018-0078-z. [DOI] [PMC free article] [PubMed] [Google Scholar]
- 14.Arriaga JM, Abate-Shen C. Genetically Engineered Mouse Models of Prostate Cancer in the Postgenomic Era. Cold Spring Harb Perspect Med 2019;9(2) doi 10.1101/cshperspect.a030528. [DOI] [PMC free article] [PubMed] [Google Scholar]
- 15.Nguyen HM, Vessella RL, Morrissey C, Brown LG, Coleman IM, Higano CS, et al. LuCaP Prostate Cancer Patient-Derived Xenografts Reflect the Molecular Heterogeneity of Advanced Disease an--d Serve as Models for Evaluating Cancer Therapeutics. Prostate 2017;77(6):654–71 doi 10.1002/pros.23313. [DOI] [PMC free article] [PubMed] [Google Scholar]
- 16.Gao D, Vela I, Sboner A, Iaquinta PJ, Karthaus WR, Gopalan A, et al. Organoid cultures derived from patients with advanced prostate cancer. Cell 2014;159(1):176–87 doi 10.1016/j.cell.2014.08.016. [DOI] [PMC free article] [PubMed] [Google Scholar]
- 17.Puca L, Bareja R, Prandi D, Shaw R, Benelli M, Karthaus WR, et al. Patient derived organoids to model rare prostate cancer phenotypes. Nat Commun 2018;9(1):2404 doi 10.1038/s41467-018-04495-z. [DOI] [PMC free article] [PubMed] [Google Scholar]
- 18.Karkampouna S, La Manna F, Benjak A, Kiener M, De Menna M, Zoni E, et al. Patient-derived xenografts and organoids model therapy response in prostate cancer. Nat Commun 2021;12(1):1117 doi 10.1038/s41467-021-21300-6. [DOI] [PMC free article] [PubMed] [Google Scholar]
- 19.Servant R, Garioni M, Vlajnic T, Blind M, Pueschel H, Muller DC, et al. Prostate cancer patient-derived organoids: detailed outcome from a prospective cohort of 81 clinical specimens. J Pathol 2021;254(5):543–55 doi 10.1002/path.5698. [DOI] [PMC free article] [PubMed] [Google Scholar]
- 20.Aytes A, Mitrofanova A, Lefebvre C, Alvarez MJ, Castillo-Martin M, Zheng T, et al. Cross-species regulatory network analysis identifies a synergistic interaction between FOXM1 and CENPF that drives prostate cancer malignancy. Cancer Cell 2014;25(5):638–51 doi 10.1016/j.ccr.2014.03.017. [DOI] [PMC free article] [PubMed] [Google Scholar]
- 21.Alvarez MJ, Subramaniam PS, Tang LH, Grunn A, Aburi M, Rieckhof G, et al. A precision oncology approach to the pharmacological targeting of mechanistic dependencies in neuroendocrine tumors. Nat Genet 2018;50(7):979–89 doi 10.1038/s41588-018-0138-4. [DOI] [PMC free article] [PubMed] [Google Scholar]
- 22.Paull EO, Aytes A, Jones SJ, Subramaniam PS, Giorgi FM, Douglass EF, et al. A modular master regulator landscape controls cancer transcriptional identity. Cell 2021;184(2):334–51 e20 doi 10.1016/j.cell.2020.11.045. [DOI] [PMC free article] [PubMed] [Google Scholar]
- 23.Alvarez MJ, Shen Y, Giorgi FM, Lachmann A, Ding BB, Ye BH, et al. Functional characterization of somatic mutations in cancer using network-based inference of protein activity. Nat Genet 2016;48(8):838–47 doi 10.1038/ng.3593. [DOI] [PMC free article] [PubMed] [Google Scholar]
- 24.Alvarez MJ, Yan P, Alpaugh ML, Bowden M, Sicinska E, Zhou CW, et al. Reply to ‘H-STS, L-STS and KRJ-I are not authentic GEPNET cell lines’. Nature genetics 2019;51(10):1427–8 doi 10.1038/s41588-019-0509-5. [DOI] [PMC free article] [PubMed] [Google Scholar]
- 25.Cancer Genome Atlas Research N. The Molecular Taxonomy of Primary Prostate Cancer. Cell 2015;163(4):1011–25 doi 10.1016/j.cell.2015.10.025. [DOI] [PMC free article] [PubMed] [Google Scholar]
- 26.Abida W, Cyrta J, Heller G, Prandi D, Armenia J, Coleman I, et al. Genomic correlates of clinical outcome in advanced prostate cancer. Proc Natl Acad Sci U S A 2019;116(23):11428–36 doi 10.1073/pnas.1902651116. [DOI] [PMC free article] [PubMed] [Google Scholar]
- 27.Douglass EF Jr., Allaway RJ, Szalai B, Wang W, Tian T, Fernandez-Torras A, et al. A community challenge for a pancancer drug mechanism of action inference from perturbational profile data. Cell Rep Med 2022;3(1):100492 doi 10.1016/j.xcrm.2021.100492. [DOI] [PMC free article] [PubMed] [Google Scholar]
- 28.Obradovic A, Chowdhury N, Haake SM, Ager C, Wang V, Vlahos L, et al. Single-cell protein activity analysis identifies recurrence-associated renal tumor macrophages. Cell 2021;184(11):2988–3005 e16 doi 10.1016/j.cell.2021.04.038. [DOI] [PMC free article] [PubMed] [Google Scholar]
- 29.Basso K, Margolin AA, Stolovitzky G, Klein U, Dalla-Favera R, Califano A. Reverse engineering of regulatory networks in human B cells. Nat Genet 2005;37(4):382–90 doi 10.1038/ng1532. [DOI] [PubMed] [Google Scholar]
- 30.Arriaga JM, Panja S, Alshalalfa M, Zhao J, Zou M, Giacobbe A, et al. A MYC and RAS co-activation signature in localized prostate cancer drives bone metastasis and castration resistance. Nat Cancer 2020;1(11):1082–96 doi 10.1038/s43018-020-00125-0. [DOI] [PMC free article] [PubMed] [Google Scholar]
- 31.Aytes A, Mitrofanova A, Kinkade CW, Lefebvre C, Lei M, Phelan V, et al. ETV4 promotes metastasis in response to activation of PI3-kinase and Ras signaling in a mouse model of advanced prostate cancer. Proc Natl Acad Sci U S A 2013;110(37):E3506–15 doi 10.1073/pnas.1303558110. [DOI] [PMC free article] [PubMed] [Google Scholar]
- 32.Floc’h N, Kinkade CW, Kobayashi T, Aytes A, Lefebvre C, Mitrofanova A, et al. Dual targeting of the Akt/mTOR signaling pathway inhibits castration-resistant prostate cancer in a genetically engineered mouse model. Cancer Res 2012;72(17):4483–93 doi 10.1158/0008-5472.CAN-12-0283. [DOI] [PMC free article] [PubMed] [Google Scholar]
- 33.Wang J, Kobayashi T, Floc’h N, Kinkade CW, Aytes A, Dankort D, et al. B-Raf activation cooperates with PTEN loss to drive c-Myc expression in advanced prostate cancer. Cancer Res 2012;72(18):4765–76 doi 10.1158/0008-5472.CAN-12-0820. [DOI] [PMC free article] [PubMed] [Google Scholar]
- 34.Zou M, Toivanen R, Mitrofanova A, Floch N, Hayati S, Sun Y, et al. Transdifferentiation as a Mechanism of Treatment Resistance in a Mouse Model of Castration-Resistant Prostate Cancer. Cancer Discov 2017;7(7):736–49 doi 10.1158/2159-8290.CD-16-1174. [DOI] [PMC free article] [PubMed] [Google Scholar]
- 35.Wang X, Kruithof-de Julio M, Economides KD, Walker D, Yu H, Halili MV, et al. A luminal epithelial stem cell that is a cell of origin for prostate cancer. Nature 2009;461(7263):495–500 doi 10.1038/nature08361. [DOI] [PMC free article] [PubMed] [Google Scholar]
- 36.Lesche R, Groszer M, Gao J, Wang Y, Messing A, Sun H, et al. Cre/loxP-mediated inactivation of the murine Pten tumor suppressor gene. Genesis 2002;32(2):148–9 doi 10.1002/gene.10036. [DOI] [PubMed] [Google Scholar]
- 37.Chen Y, Chi P, Rockowitz S, Iaquinta PJ, Shamu T, Shukla S, et al. ETS factors reprogram the androgen receptor cistrome and prime prostate tumorigenesis in response to PTEN loss. Nat Med 2013;19(8):1023–9 doi 10.1038/nm.3216. [DOI] [PMC free article] [PubMed] [Google Scholar]
- 38.Olive KP, Tuveson DA, Ruhe ZC, Yin B, Willis NA, Bronson RT, et al. Mutant p53 gain of function in two mouse models of Li-Fraumeni syndrome. Cell 2004;119(6):847–60 doi 10.1016/j.cell.2004.11.004. [DOI] [PubMed] [Google Scholar]
- 39.Ellwood-Yen K, Graeber TG, Wongvipat J, Iruela-Arispe ML, Zhang J, Matusik R, et al. Myc-driven murine prostate cancer shares molecular features with human prostate tumors. Cancer Cell 2003;4(3):223–38 doi 10.1016/s1535-6108(03)00197-1. [DOI] [PubMed] [Google Scholar]
- 40.Dankort D, Filenova E, Collado M, Serrano M, Jones K, McMahon M. A new mouse model to explore the initiation, progression, and therapy of BRAFV600E-induced lung tumors. Genes Dev 2007;21(4):379–84 doi 10.1101/gad.1516407. [DOI] [PMC free article] [PubMed] [Google Scholar]
- 41.Jackson EL, Willis N, Mercer K, Bronson RT, Crowley D, Montoya R, et al. Analysis of lung tumor initiation and progression using conditional expression of oncogenic K-ras. Genes Dev 2001;15(24):3243–8 doi 10.1101/gad.943001. [DOI] [PMC free article] [PubMed] [Google Scholar]
- 42.Madisen L, Zwingman TA, Sunkin SM, Oh SW, Zariwala HA, Gu H, et al. A robust and high-throughput Cre reporting and characterization system for the whole mouse brain. Nat Neurosci 2010;13(1):133–40 doi 10.1038/nn.2467. [DOI] [PMC free article] [PubMed] [Google Scholar]
- 43.Shen MM, Abate-Shen C. Molecular genetics of prostate cancer: new prospects for old challenges. Genes Dev 2010;24(18):1967–2000 doi 10.1101/gad.1965810. [DOI] [PMC free article] [PubMed] [Google Scholar]
- 44.Aytes A, Giacobbe A, Mitrofanova A, Ruggero K, Cyrta J, Arriaga J, et al. NSD2 is a conserved driver of metastatic prostate cancer progression. Nat Commun 2018;9(1):5201 doi 10.1038/s41467-018-07511-4. [DOI] [PMC free article] [PubMed] [Google Scholar]
- 45.Arora VK, Schenkein E, Murali R, Subudhi SK, Wongvipat J, Balbas MD, et al. Glucocorticoid receptor confers resistance to antiandrogens by bypassing androgen receptor blockade. Cell 2013;155(6):1309–22 doi 10.1016/j.cell.2013.11.012. [DOI] [PMC free article] [PubMed] [Google Scholar]
- 46.Baca SC, Takeda DY, Seo JH, Hwang J, Ku SY, Arafeh R, et al. Reprogramming of the FOXA1 cistrome in treatment-emergent neuroendocrine prostate cancer. Nat Commun 2021;12(1):1979 doi 10.1038/s41467-021-22139-7. [DOI] [PMC free article] [PubMed] [Google Scholar]
- 47.Consortium GT. The Genotype-Tissue Expression (GTEx) project. Nat Genet 2013;45(6):580–5 doi 10.1038/ng.2653. [DOI] [PMC free article] [PubMed] [Google Scholar]
- 48.Bush EC, Ray F, Alvarez MJ, Realubit R, Li H, Karan C, et al. PLATE-Seq for genome-wide regulatory network analysis of high-throughput screens. Nat Commun 2017;8(1):105 doi 10.1038/s41467-017-00136-z. [DOI] [PMC free article] [PubMed] [Google Scholar]
- 49.Kruczek K, Ratterman M, Tolzien K, Sulo S, Lestingi TM, Nabhan C. A phase II study evaluating the toxicity and efficacy of single-agent temsirolimus in chemotherapy-naive castration-resistant prostate cancer. Br J Cancer 2013;109(7):1711–6 doi 10.1038/bjc.2013.530. [DOI] [PMC free article] [PubMed] [Google Scholar]
- 50.Rathkopf DE, Picus J, Hussain A, Ellard S, Chi KN, Nydam T, et al. A phase 2 study of intravenous panobinostat in patients with castration-resistant prostate cancer. Cancer Chemother Pharmacol 2013;72(3):537–44 doi 10.1007/s00280-013-2224-8. [DOI] [PMC free article] [PubMed] [Google Scholar]
- 51.Mu P, Zhang Z, Benelli M, Karthaus WR, Hoover E, Chen CC, et al. SOX2 promotes lineage plasticity and antiandrogen resistance in TP53- and RB1-deficient prostate cancer. Science 2017;355(6320):84–8 doi 10.1126/science.aah4307. [DOI] [PMC free article] [PubMed] [Google Scholar]
- 52.Bekes M, Langley DR, Crews CM. PROTAC targeted protein degraders: the past is prologue. Nat Rev Drug Discov 2022;21(3):181–200 doi 10.1038/s41573-021-00371-6. [DOI] [PMC free article] [PubMed] [Google Scholar]
- 53.Crooke ST, Witztum JL, Bennett CF, Baker BF. RNA-Targeted Therapeutics. Cell Metab 2018;27(4):714–39 doi 10.1016/j.cmet.2018.03.004. [DOI] [PubMed] [Google Scholar]
- 54.Obradovic A, Ager C, Turunen M, Nirschl T, Khosravi-Maharlooei M, Jackson C, et al. Systematic Elucidation and Pharmacological Targeting of Tumor-Infiltrating Regulatory T Cell Master Regulators. bioRxiv 2022;2022.02.22.481404 doi: 10.1101/2022.02.22.481404. [DOI] [PMC free article] [PubMed] [Google Scholar]
- 55.Ding H, Burgenske DM, Zhao W, Subramaniam PS, Bakken KK, He L, et al. Single-cell based elucidation of molecularly-distinct glioblastoma states and drug sensitivity. bioRxiv 2019;675439 doi: 10.1101/675439. [DOI] [Google Scholar]
- 56.Echeverria GV, Ge Z, Seth S, Zhang X, Jeter-Jones S, Zhou X, et al. Resistance to neoadjuvant chemotherapy in triple-negative breast cancer mediated by a reversible drug-tolerant state. Sci Transl Med 2019;11(488) doi 10.1126/scitranslmed.aav0936. [DOI] [PMC free article] [PubMed] [Google Scholar]
- 57.Risom T, Langer EM, Chapman MP, Rantala J, Fields AJ, Boniface C, et al. Differentiation-state plasticity is a targetable resistance mechanism in basal-like breast cancer. Nat Commun 2018;9(1):3815 doi 10.1038/s41467-018-05729-w. [DOI] [PMC free article] [PubMed] [Google Scholar]
- 58.Brichta L, Shin W, Jackson-Lewis V, Blesa J, Yap EL, Walker Z, et al. Identification of neurodegenerative factors using translatome-regulatory network analysis. Nat Neurosci 2015;18(9):1325–33 doi 10.1038/nn.4070. [DOI] [PMC free article] [PubMed] [Google Scholar]
- 59.Mishra V, Re DB, Le Verche V, Alvarez MJ, Vasciaveo A, Jacquier A, et al. Systematic elucidation of neuron-astrocyte interaction in models of amyotrophic lateral sclerosis using multi-modal integrated bioinformatics workflow. Nat Commun 2020;11(1):5579 doi 10.1038/s41467-020-19177-y. [DOI] [PMC free article] [PubMed] [Google Scholar]
- 60.Repunte-Canonigo V, Shin W, Vendruscolo LF, Lefebvre C, van der Stap L, Kawamura T, et al. Identifying candidate drivers of alcohol dependence-induced excessive drinking by assembly and interrogation of brain-specific regulatory networks. Genome Biol 2015;16:68 doi 10.1186/s13059-015-0593-5. [DOI] [PMC free article] [PubMed] [Google Scholar]
- 61.Son J, Ding H, Farb TB, Efanov AM, Sun J, Gore JL, et al. BACH2 inhibition reverses beta cell failure in type 2 diabetes models. J Clin Invest 2021;131(24) doi 10.1172/JCI153876. [DOI] [PMC free article] [PubMed] [Google Scholar]
- 62.Rodon J, Soria JC, Berger R, Miller WH, Rubin E, Kugel A, et al. Genomic and transcriptomic profiling expands precision cancer medicine: the WINTHER trial. Nat Med 2019;25(5):751–8 doi 10.1038/s41591-019-0424-4. [DOI] [PMC free article] [PubMed] [Google Scholar]
- 63.Ma J, Fong SH, Luo Y, Bakkenist CJ, Shen JP, Mourragui S, et al. Few-shot learning creates predictive models of drug response that translate from high-throughput screens to individual patients. Nat Cancer 2021;2(2):233–44 doi 10.1038/s43018-020-00169-2. [DOI] [PMC free article] [PubMed] [Google Scholar]
- 64.Warren A, Chen Y, Jones A, Shibue T, Hahn WC, Boehm JS, et al. Global computational alignment of tumor and cell line transcriptional profiles. Nat Commun 2021;12(1):22 doi 10.1038/s41467-020-20294-x. [DOI] [PMC free article] [PubMed] [Google Scholar]
- 65.Chua CW, Shibata M, Lei M, Toivanen R, Barlow LJ, Bergren SK, et al. Single luminal epithelial progenitors can generate prostate organoids in culture. Nat Cell Biol 2014;16(10):951–61, 1-4 doi 10.1038/ncb3047. [DOI] [PMC free article] [PubMed] [Google Scholar]
- 66.Tran C, Ouk S, Clegg NJ, Chen Y, Watson PA, Arora V, et al. Development of a second-generation antiandrogen for treatment of advanced prostate cancer. Science 2009;324(5928):787–90 doi 10.1126/science.1168175. [DOI] [PMC free article] [PubMed] [Google Scholar]
- 67.Yu K, Toral-Barza L, Discafani C, Zhang WG, Skotnicki J, Frost P, et al. mTOR, a novel target in breast cancer: the effect of CCI-779, an mTOR inhibitor, in preclinical models of breast cancer. Endocr Relat Cancer 2001;8(3):249–58 doi 10.1677/erc.0.0080249. [DOI] [PubMed] [Google Scholar]
- 68.Li S, Fong KW, Gritsina G, Zhang A, Zhao JC, Kim J, et al. Activation of MAPK Signaling by CXCR7 Leads to Enzalutamide Resistance in Prostate Cancer. Cancer Res 2019;79(10):2580–92 doi 10.1158/0008-5472.CAN-18-2812. [DOI] [PMC free article] [PubMed] [Google Scholar]
- 69.Bruzzese F, Pucci B, Milone MR, Ciardiello C, Franco R, Chianese MI, et al. Panobinostat synergizes with zoledronic acid in prostate cancer and multiple myeloma models by increasing ROS and modulating mevalonate and p38-MAPK pathways. Cell Death Dis 2013;4:e878 doi 10.1038/cddis.2013.406. [DOI] [PMC free article] [PubMed] [Google Scholar]
- 70.Garcia-Gomez A, Quwaider D, Canavese M, Ocio EM, Tian Z, Blanco JF, et al. Preclinical activity of the oral proteasome inhibitor MLN9708 in Myeloma bone disease. Clin Cancer Res 2014;20(6):1542–54 doi 10.1158/1078-0432.CCR-13-1657. [DOI] [PubMed] [Google Scholar]
- 71.Vidal SJ, Rodriguez-Bravo V, Quinn SA, Rodriguez-Barrueco R, Lujambio A, Williams E, et al. A targetable GATA2-IGF2 axis confers aggressiveness in lethal prostate cancer. Cancer Cell 2015;27(2):223–39 doi 10.1016/j.ccell.2014.11.013. [DOI] [PMC free article] [PubMed] [Google Scholar]
- 72.Ager CR, Obradovic AZ, Arriaga JM, Chaimowitz MG, Califano A, Abate-Shen C, et al. Longitudinal Immune Profiling Reveals Unique Myeloid and T-cell Phenotypes Associated with Spontaneous Immunoediting in a Prostate Tumor Model. Cancer Immunol Res 2021;9(5):529–41 doi 10.1158/2326-6066.CIR-20-0637. [DOI] [PMC free article] [PubMed] [Google Scholar]
Associated Data
This section collects any data citations, data availability statements, or supplementary materials included in this article.