

Abstract
Interferons play a major role in microglial-mediated neuroinflammation in Alzheimer’s disease (AD). We investigated the interferon transcriptome (AD versus non-AD) using N9 and murine microglia. We identified 64 interferon-related differentially expressed genes (DEG) in LPS-stimulated N9 microglia versus control cells, 26 DEG in microglia from 5XFAD versus wild-type mice, with 13 DEG common to both datasets. Network analyses identified potential key mediators (Cxcl10, Ifit3) of the interferon response in AD. Gene-drug interaction analysis identified therapeutics targeting interferon-related genes. These data characterize the microglial interferon response in AD, providing new targets and therapeutics directed towards interferon-related neuroinflammation in AD.
Keywords: Alzheimer’s disease, interferon, neuroinflammation, microglia, transcriptomics
Graphical Abstract

1. Introduction
Alzheimer’s disease (AD) is an age-related neurodegenerative disorder and the most common type of dementia. AD pathology is defined by the accumulation of amyloid-β (Aβ) plaques followed by intracellular neurofibrillary tangles (NFTs) composed of hyperphosphorylated tau, resulting in cognitive decline and brain atrophy (Gallardo and Holtzman, 2019). Currently, there are no effective treatments for AD with most of the research directed towards tau and Aβ reduction. Recently, genome-wide association studies (GWAS) have advanced our understanding of pathological processes in AD development (Chen et al., 2020; Zhou et al., 2020; Shippy and Ulland, 2022; Shippy et al., 2022). As the size of GWAS increase, the number of associated risk loci in AD will also increase (Wightman et al., 2021) and integration of multi-omics data could provide drug targets of GWAS-identified variants (Fang et al., 2022). Therefore, identifying gene networks important in AD pathogenesis could result in new treatment options for AD.
Neuroinflammation is an inflammatory response mediated by the innate immune system within the central nervous system (CNS). Microglia, the primary immune cells of the CNS, are a major contributor to neuroinflammation in AD (Leng and Edison, 2021). Although AD appears to have a multifaceted etiology (Iqbal and Grundke-Iqbal, 2010), neuroinflammation is a major driver of AD pathogenesis by exacerbating tau and Aβ pathologies (Baik et al., 2016; Leyns and Holtzman, 2017). Furthermore, microglial activation by Aβ and tau also promotes neuroinflammation by the production of reactive oxygen species and the release of proinflammatory cytokines and chemokines (Wang et al., 2015a; Spangenberg and Green, 2017). Therefore, attenuation of the neuroinflammatory response could be a compelling therapeutic target for AD. Several studies have already evaluated the use of drugs (Etminan et al., 2003; Shadfar et al., 2015) and metabolites (Shippy et al., 2020) with anti-inflammatory properties as an AD treatment. Although several candidates have been identified, there is still an urgent need to further understand the role of neuroinflammation in AD pathology to identify additional targets and new therapeutics for AD.
In a previous report we examined the neuroinflammatory response in both a mouse model of AD and in lipopolysaccharide (LPS) stimulated N9 cells, a mouse microglial cell line (Shippy et al., 2022). In this study the interferon response, a classic immune response to viral infection, was shown to be changed in both sets of cells (Shippy et al., 2022; Isaacs and Lindenmann, 1957). Recent studies suggest that interferon production, particularly type 1 interferons, plays an important role in neuroinflammation-driven AD pathology (Hur et al., 2020; Moore et al., 2020; Roy et al., 2020; Roy et al., 2022). Furthermore, interferon-β1a, an anti-inflammatory cytokine used to treat multiple sclerosis (MS) (Patti et al., 2013) and experimental autoimmune encephalomyelitis (EAE) (Cheng et al., 2015), is currently being investigated as a treatment for AD (Grimaldi et al., 2014; Mudo et al., 2019). Since the interferon response appears to be important in neuroinflammation-driven AD pathology, we chose to use microarray data from sorted microglia from wild type and 5XFAD mice and RNA-sequencing (RNA-seq) data from N9 cells and primary murine microglia stimulated with LPS to perform a targeted investigation of the changes in the interferon transcriptome. This targeted approach allowed us to examine the interferon response in detail, however this approach is more limited than a large-scale unbiased examination and as it constrains the number of genes in the in the downstream pathways analysis. We identified 64 interferon-related differentially expressed genes (DEG) in LPS-stimulated N9 microglia versus unstimulated control cells using RNA-seq, 26 interferon-related DEG in microglia from 5XFAD versus wild-type mice by microarray, with 13 DEG common to both datasets. Furthermore, enrichment, pathway, and network analyses identified several potential key mediators of the interferon response in AD, including Cxcl10 and Ifit3. Gene-drug interaction analysis was also performed to identify novel therapeutics targeting interferon-related genes. Finally, enzyme linked immunosorbent assay (ELISA) confirmed the induction of CXCL10 and IFN-β in LPS-stimulated N9 and primary microglia. Altogether, these data characterize the microglial interferon response in AD and provide new targets and therapeutics directed towards interferon-related neuroinflammation in AD.
2. Materials and methods
2.1. Cell culture assays
Primary microglia were prepared from wild-type C57BL/6J mice (The Jackson Laboratory) as previously described using Magnetic Activated Cell Sorting (MACS, Miltenyi Biotec) according to manufacturer’s instructions (Shippy et al., 2022). Briefly, mice were perfused with cold PBS containing 0.1% heparin. Brains were collected in C-tubes (Miltenyi Biotec, Cat. No. 130–096-334) and dissociated using a Neural Tissue Dissociation Kit (T) (Miltenyi Biotec, Cat. No. 130–093-231). Microglia were labeled with anti-mouse CD45 magnetic beads (Miltenyi Biotec, Cat. No. 130–052-301) and isolated on LS columns (Miltenyi Biotec, Cat. No. 130–042-401). Approximately 50,000 microglia/well were seeded on poly-L-lysine coated 48-well plates in complete RPMI media supplemented with 20% L-cell conditioned media (LCCM) and human TGF-β (10 ng/ml) (PeproTech, Cat. No. 100–21). Media was changed three days after plating, and cells were used in the week following the media change. Microglia were stimulated with LPS (50 ng/ml) from Escherichia coli O111:B4 (InvivoGen) for 6 hours. Supernatants were flash frozen on dry ice and stored at −80°C until use.
Immortalized murine N9 microglia were cultured as previously described (Righi et al., 1989). N9 microglia were seeded at a cell density of 250,000 cells/well in a 24-well tissue culture plate. Cells were stimulated with LPS (1 μg/ml) (Nikodemova and Watters, 2011) for 6 hours. Supernatants were flash frozen on dry ice and stored at −80°C until use.
2.2. ELISA
Primary microglia and N9 cell culture supernatants were assayed for CXCL10, IFN-α, and IFN-β by ELISA. The CXCL10 ELISA was performed using the Mouse CXCL10/IP-10/CRG-2 DuoSet ELISA (R&D Systems, Cat. No. DY466) following the manufacturer’s instructions. The IFN-α ELISA was performed using the VeriKine™ Mouse Interferon Alpha ELISA (PBL Assay Science, Cat. No. 42120) following the manufacturer’s instructions. The IFN-β ELISA was performed using the VeriKine™ Mouse IFN Beta ELISA (PBL Assay Science, Cat. No. 42400) following the manufacturer’s instructions.
2.3. N9 microglia RNA-seq
The N9 microglial RNA-seq dataset was published previously by our group (GSE183038) (Shippy et al., 2022). Briefly, N9 microglia were stimulated with LPS as described above, and RNA was extracted using an RNeasy Plus Mini Kit (Qiagen, Cat. No. 74134). Quality and quantity of RNA was assessed using an Agilent 2100 Bioanalyzer (Agilent Technologies) and a Nanodrop spectrophotometer (Thermo Scientific). All samples had an RNA integrity number (RIN) of 9.7 or higher. RNA library preparation and transcriptome sequencing were performed by Novogene using the Illumina NovaSeq 6000 Sequencing System. Genes with FDR-adjusted P-values < 0.5 and log2FC > 0.5 were considered differentially expressed.
2.4. Mouse microglia microarray
The mouse microarray has been published in a previous study (Wang et al., 2015b) and the publicly available dataset (GSE65067) was used. Briefly, microglia from female 8 month old wild-type (n = 3) and 5XFAD (n = 5) mice (The Jackson Laboratory) were FACS-sorted directly into RTL-plus lysis buffer. RNA extraction from microglia was performed using an RNeasy Plus Micro Kit (Qiagen, Cat. No. 74034). Microarray hybridization (Affymetrix MoGene 1.0 ST array) and data processing were performed at the Washington University Genome Center. Genes with P-values < 0.05 and log2FC > 0.5 were considered differentially expressed.
2.5. Gene analyses
In order to identify interferon genes, the datasets were searched for the term “interferon” and for genes from the RT2 Profiler™ PCR Array Mouse Type 1 Interferon Response (Qiagen, Cat. No. PAMM-016Z) gene list. Interferon genes found to be differentially expressed were selected for biological function analyses. The gene list was uploaded into the Database for Annotation, Visualization and Integrated Discovery (DAVID, v. 2022q2) (Huang da et al., 2009b; Huang da et al., 2009a) for Gene Ontology (GO) and Kyoto Encyclopedia of Genes and Genomes (KEGG) pathway analysis. GO Biological Process (BP), Cellular Component (CC), Molecular Function (MF) and KEGG pathways with gene counts ≥ 4 and FDR < 0.05 were considered significant. Scatterplots were created using Prism (GraphPad, v. 9.3.1). Venn diagrams demonstrating overlap in interferon DEG amongst the datasets were generated using InteractiVenn (Heberle et al., 2015). Gene constellations identifying genes in the Cxcl10 and Ifit3 regulatory network were created using the Immunology Genome Project (ImmGen) (Heng et al., 2008) using the “myeloid cells” reference populations option. Predicted regulators of Cxcl10 and Ifit3 were identified using ImmGens Predicted Interferons Network tool (Heng et al., 2008). Gene-drug interactions of the interferon DEG were identified using the drug-gene interaction database (DGIdb) (Cotto et al., 2018; Freshour et al., 2021) using the default settings.
2.6. Cxcl10-drug interaction validation assays
In order to validate our findings in the gene-drug interaction analysis, cell culture assays were performed with selected drugs found to target Cxcl10. N9 microglia were seeded at a cell density of 250,000 cells/well in a 24-well tissue culture plate and treated with DMSO (control), methylprednisolone (1 μM) (Cayman Chemical, Cat. No. 15013), and zidovudine (1 μM) (Cayman Chemical, Cat. No. 15492) for 15 minutes. Cells were then stimulated with LPS (1 μg/ml) for 6 hours and supernatants were assayed for CXCL10 by ELISA as described above.
To determine drug toxicity, N9 microglia were seeded at a cell density of 25,000 cells/well in a 96-well tissue culture plate. N9 cells were treated with methylprednisolone (1 μM), zidovudine (1 μM), and DMSO for 8 hours. Cytotoxicity was determined by the levels of lactate dehydrogenase (LDH) in cell culture supernatants using the Cytotox 96® Non-Radioactive Cytotoxicity Assay (Promega, Cat. No. G1780) following manufacturer’s instructions.
2.7. Statistical analyses
Statistical analysis was performed using Prism (GraphPad, v. 9.3.1). Data are presented as mean ± SEM. Comparison between two groups was performed using a Student’s t-test. Comparison between multiple groups was performed using one-way ANOVA with a Dunnett’s multiple comparisons test and one-way ANOVA with a Tukey’s multiple comparisons test. A P-value < 0.05 (*P < 0.05, **P < 0.01, ***P < 0.001 and ****P < 0.0001) was used as the significance cutoff.
3. Results
3.1. AD promotes differential expression of murine microglial interferon genes
In our previous analysis of RNA-seq data from LPS-stimulated N9 microglia versus non-stimulated control cells (Shippy et al., 2022) resulted in a total of 64 interferon DEG (log2FC > 0.5, FDR-adjusted P-value < 0.05) which constitutes 6.4% of all DEGs. For this reason, we chose to perform a focused but limited examination of these genes. Of the 64 DEG, 63 were up-regulated and one was down-regulated (Fig. 1A). Interferon-induced protein with tetratricopeptide repeats 3B (Ifit3b) was the most up-regulated interferon gene (log2FC = 8.08) and toll-like receptor 8 (Tlr8) was the only down-regulated interferon gene (log2FC = −2.65) (Supplementary Table S1).
Figure 1. Differentially expressed murine microglial interferon genes in AD.
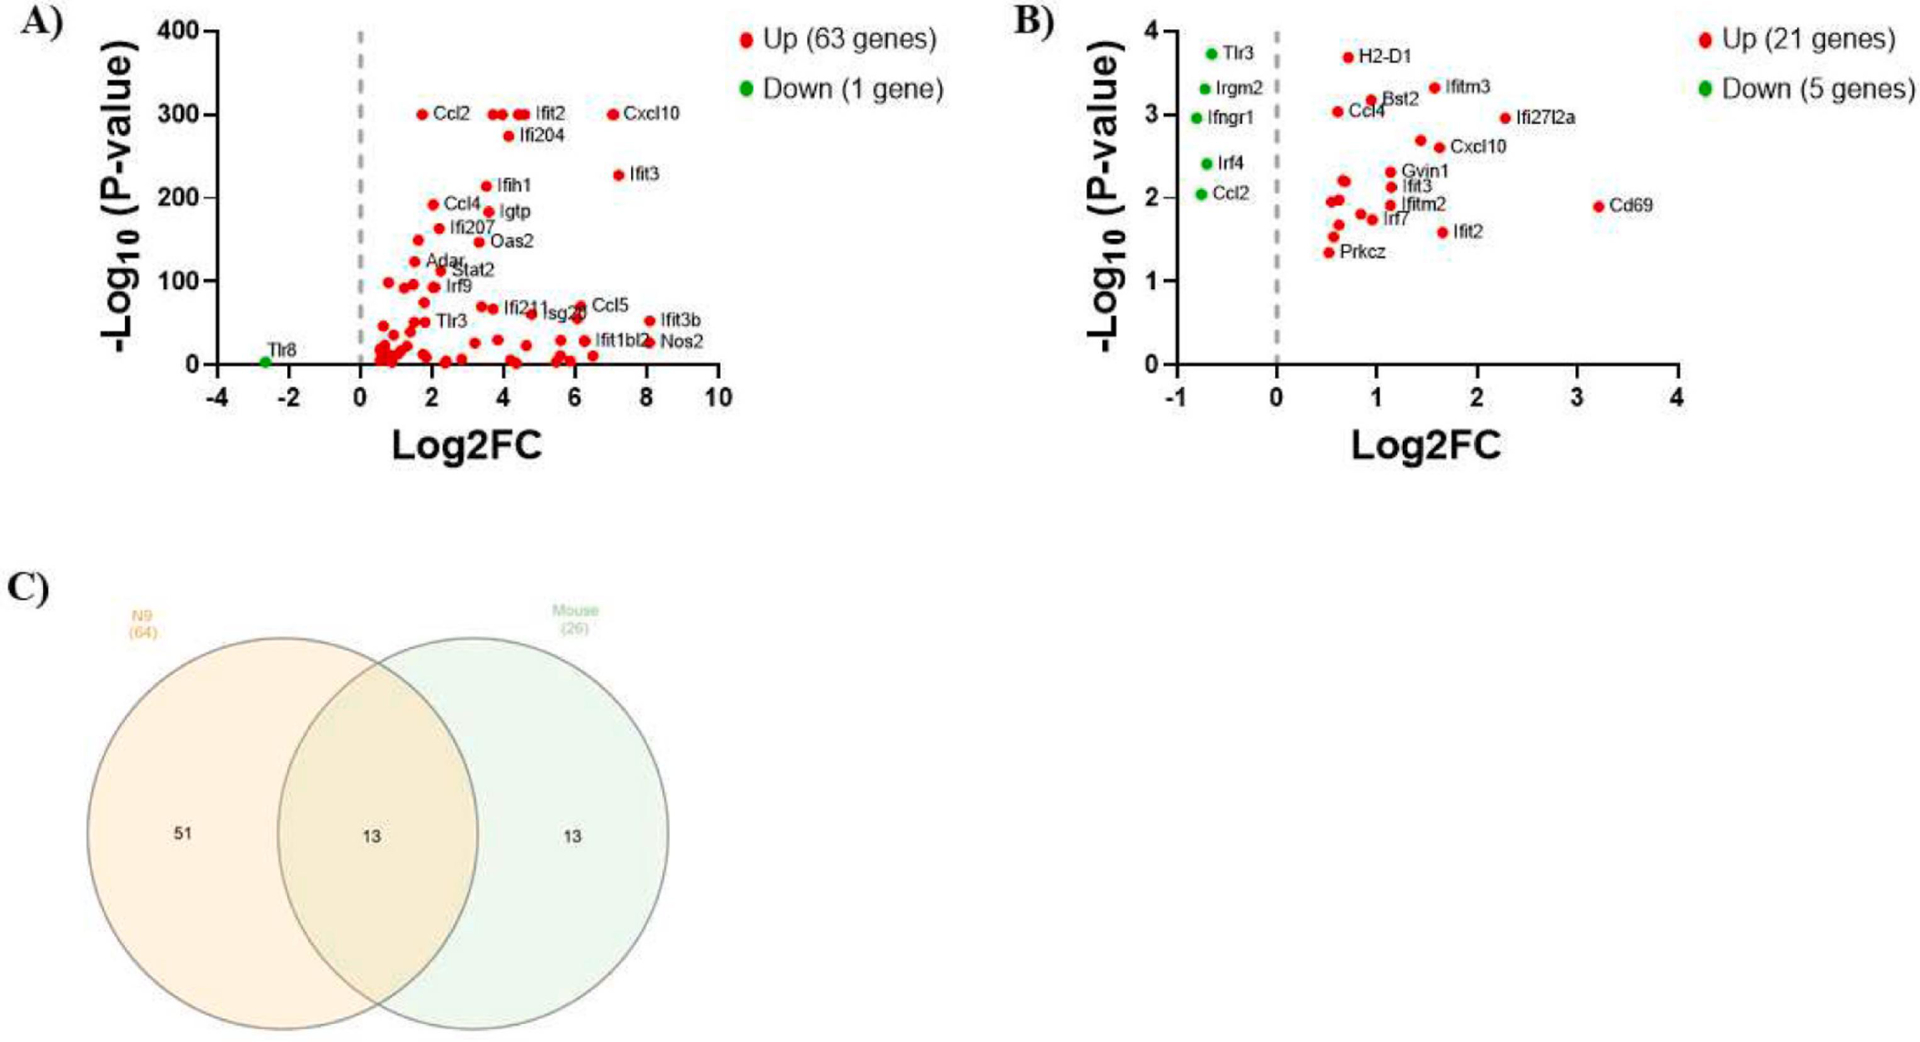
(A) Scatter plot of interferon DEG (log2FC > 0.5, FDR-adjusted P-value < 0.05) by RNA-seq in N9 microglia stimulated with LPS (1 μg/ml) for 6 hours versus unstimulated control cells. (B) Scatter plot of interferon DEG (log2FC > 0.5, P < 0.05) by microarray in microglia isolated from the brains of 5XFAD mice versus wild-type mice (8 months old). For both scatter plots, up-regulated genes are shown in red and down-regulated genes are shown in green. (C) Venn diagram displaying overlap in interferon DEG between the datasets.
Publicly available microarray data using sorted microglia from female 8-month-old 5XFAD mice versus wild-type mice (Wang et al., 2015b) revealed 26 interferon DEG (log2FC > 0.5, P < 0.05) which constitutes 1.5% of all DEGs. Of the 26 DEG, 21 were up-regulated and 5 were down-regulated (Fig. 1B). CD69 antigen (Cd69) was the most up-regulated gene (log2FC = 3.21) and interferon gamma receptor 1 (Ifngr1) was the most down-regulated gene (log2FC = −0.80) (Supplementary Table S2).
Altogether, 13 interferon DEG were common to both datasets (Fig. 1C). A comprehensive list of the 13 interferon DEG with the log2FC values for both datasets is shown in Table 1.
Table 1.
Altered interferon genes common to both datasets.
| Gene | ID1 | Description | N9 Log2FC | Mouse Log2FC |
|---|---|---|---|---|
| Cd69 | 30156 | CD69 antigen | 2.36 | 3.21 |
| Cxcl10 | 34855 | chemokine (C-X-C motif) ligand 10 | 7.04 | 1.62 |
| Ifitm3 | 25492 | interferon induced transmembrane protein 3 | 1.12 | 1.57 |
| Ifi204 | 73489 | interferon activated gene 204 | 4.13 | 1.44 |
| Ifit3 | 74896 | interferon-induced protein with tetratricopeptide repeats 3 | 7.21 | 1.14 |
| Gvinl | 45868 | GTPase, very large interferon inducible 1 | 2.82 | 1.14 |
| Irf7 | 25498 | interferon regulatory factor 7 | 3.96 | 0.95 |
| Bst2 | 46718 | bone marrow stromal cell antigen 2 | 1.21 | 0.94 |
| Mx2 | 23341 | MX dynamin-like GTPase 2 | 6.05 | 0.68 |
| Ccl4 | 18930 | chemokine (C-C motif) ligand 4 | 2.02 | 0.61 |
| Isg20 | 39236 | interferon-stimulated protein | 4.78 | 0.57 |
| Iigp1 | 54072 | interferon inducible GTPase 1 | 4.18 | 0.55 |
| Ccl2 | 35385 | chemokine (C-C motif) ligand 2 | 1.72 | −0.75 |
All gene IDs start with ENSMUSG000000
3.2. Enrichment and pathway analyses of altered interferon genes
GO and KEGG analyses were performed on the N9 and 5XFAD mouse microglial interferon DEG. For N9 microglia, BP GO indicated the interferon DEG participated in numerous neuroinflammatory processes (Fig. 2A). Several type 1 interferon pathways were identified including cellular response to interferon-beta, positive regulation of interferon-beta production, positive regulation of interferon-alpha production, type 1 interferon signaling, type 1 interferon production, positive regulation of type 1 interferon production, and response to interferon-alpha. CC GO indicated the N9 microglial interferon DEG were located in the cytosol, cytoplasm, nucleolus, and nucleus. Some of the top MF GO for the N9 microglial interferon DEG were identical protein binding, protein binding, RNA binding, and chemokine activity. A complete list of the GO, false discovery rates, and genes associated with each GO is shown in Supplementary Table S3.
Figure 2. Gene Ontology Biological Process enrichment analysis.
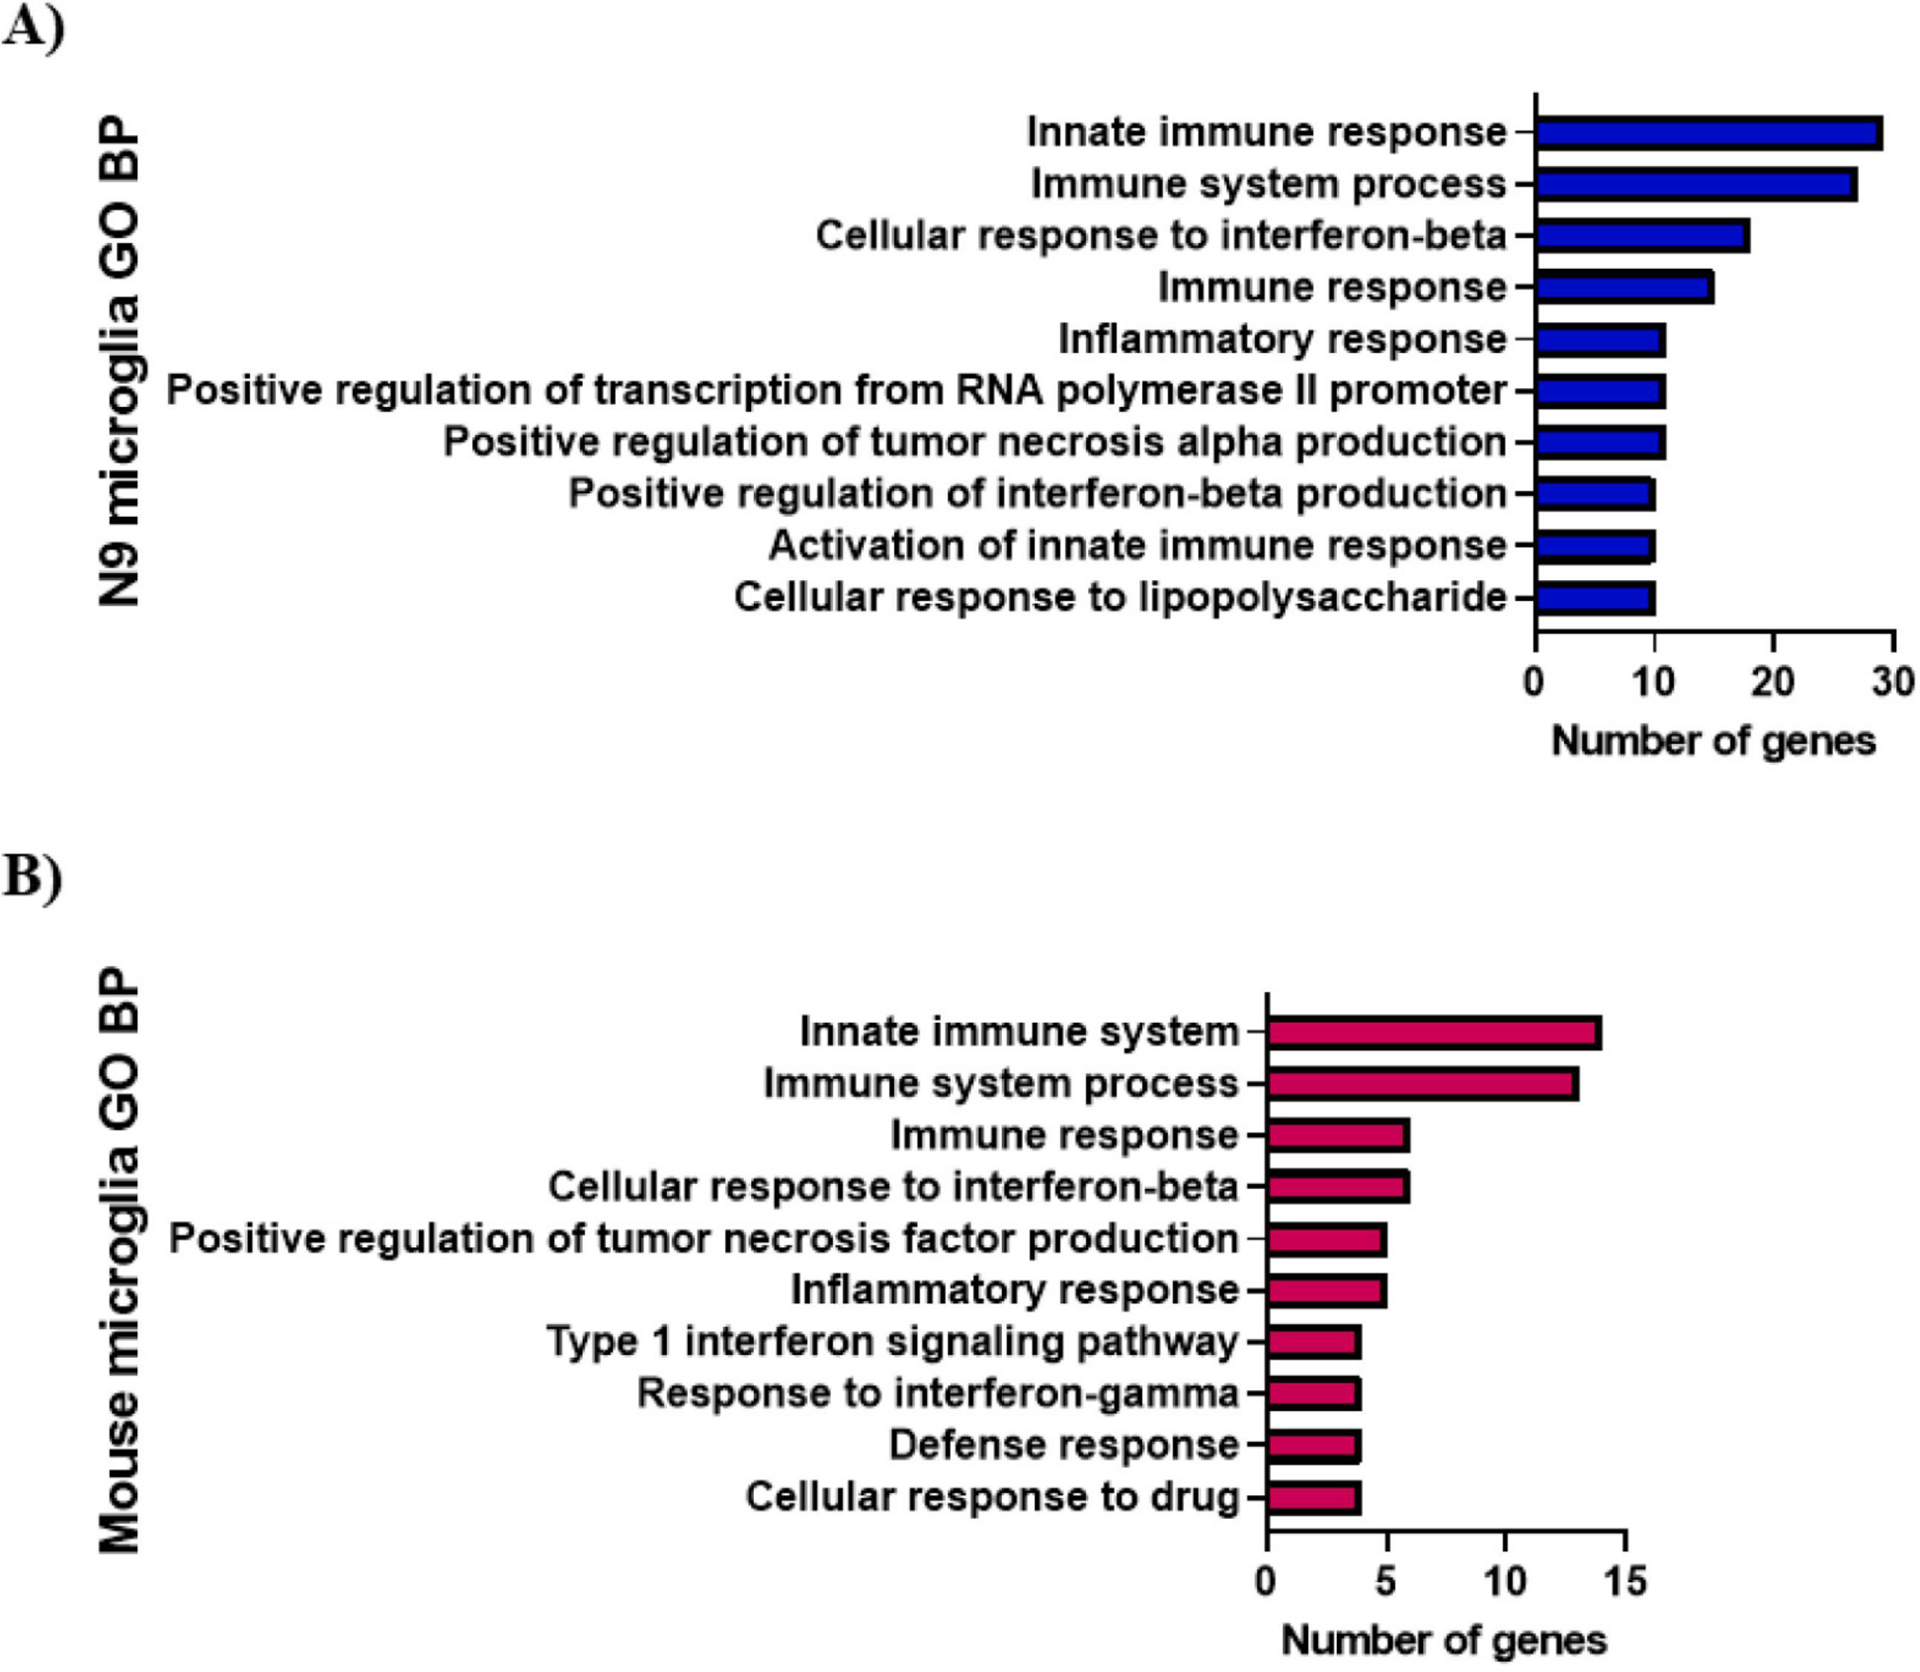
Biological process (BP) analysis of the N9 (A) and mouse (B) microglial interferon DEG was performed using DAVID. Gene Ontology (GO) BP terms with a gene count ≥ 4 and FDR < 0.05 were considered significant. Selected GO BP terms are shown with a complete list available in supplementary tables S3 and S4.
For 5XFAD mouse microglial interferon DEG, BP GO indicated the genes participated in immune system process, innate immune system, cellular response to interferon-beta, type 1 interferon signaling, response to interferon-gamma, positive regulation of tumor necrosis factor production, cellular response to drug, immune response, defense response, and inflammatory response (Fig. 2B). For CC GO, DAVID was unable to determine the cellular location of the mouse interferon DEG under the defined parameters (gene count ≥ 4, FDR < 0.05). For MF GO, identical protein binding was the only function identified for the 5XFAD mouse microglial interferon DEG. A complete list of the GO, false discovery rates, and genes associated with each GO is shown in Supplementary Table S4.
KEGG analysis was performed on the N9 and 5XFAD mouse microglial lipid interferon DEG. For N9 microglia, KEGG identified NOD-like receptor signaling, toll-like receptor signaling, cytosolic DNA-sensing, necroptosis, lipid and atherosclerosis, antigen processing and presentation, JAK-STAT signaling, C-type lectin receptor signaling, TNF signaling, chemokine signaling, type 1 diabetes mellitus, RIG-I-like receptor signaling, cytokine-cytokine receptor interaction, and NF-kappa signaling pathways. For the 5XFAD mouse microglial interferon DEG, KEGG identified toll-like receptor signaling, chemokine signaling, and cytokine-cytokine receptor interaction pathways. A selected list of the KEGG pathways, false discovery rates, and genes associated with each pathway is shown in Table 2. A complete list of KEGG pathways is shown in Supplemental Table S5 and S6 for N9 and 5XFAD mouse microglia respectively. Together, these data suggest the interferon response is potentially associated with microglial-mediated neuroinflammation in AD.
Table 2.
KEGG pathway analysis for N9 and mouse microglia. Pathways with a gene count ≥ 4 and FDR < 0.05 were considered significant. Selected pathways are shown with a full list available in supplementary tables S5 and S6.
| N9 microglia: | ||
|---|---|---|
| KEGG Pathway | FDR | Genes |
| NOD-like receptor signaling | 1.30E-10 | Oas1a, Oas1b, Oas2, Casp1, Ccl2, Ccl5, Ifi204, Irf7, Irf9, Myd88, Stat1, Stat2, Ticam1, Tyk2 |
| Toll-like receptor signaling | 3.00E-10 | Cd80, Ccl4, Ccl5, Cxcl10, Irf7, Myd88, Stat1, Tlr3, Tlr8, Tlr9, Ticam1 |
| Cytosolic DNA-sensing | 1.60E-07 | Ddx58, Adar, Casp1, Ccl4, Ccl5, Cxcl10, Ifi202b, Irf7 |
| Necroptosis | 8.50E-07 | Casp1, Eif2ak2, Ifngr2, Irf9, Stat1, Stat2, Tlr3, Ticam1, Tnfsf10, Tyk2 |
| Lipid and atherosclerosis | 2.70E-03 | Casp1, Ccl2, Ccl5, Irf7, Myd88, Ticam1, Tnfsf10 |
| Antigen processing and presentation | 4.00E-03 | H2-D1, H2-K1, H2-T10, Psme2, Tap1 |
| JAK-STAT signaling | 4.90E-03 | Ifngr2, Irf9, Stat1, Stat2, Socs1, Tyk2 |
| C-type lectin receptor signaling | 7.40E-03 | Casp1, Irf1, Irf9, Stat1, Stat2 |
| TNF signaling | 7.40E-03 | Ccl2, Ccl5, Cxcl10, Ifi47, Irf1 |
| Chemokine signaling | 7.50E-03 | Ccl2, Ccl5, Cxcl10, Stat1, Stat2 |
| Type 1 diabetes mellitus | 1.30E-02 | Cd80, H2-D1, H2-K1, H2-T10 |
| RIG-I-like receptor signaling | 1.30E-02 | Ddx58, Cxcl10, Ifih1, Irf7 |
| Cytokine-cytokine receptor interaction | 3.10E-02 | Ccl2, Ccl4, Ccl5, Cxcl10, Ifngr2, Tnfsf10 |
| NF-kappaB signaling | 3.30E-02 | Ddx58, Ccl4, Myd88, Ticam1 |
| Mouse microglia: | ||
| KEGG Pathway | FDR | Genes |
| Toll-like receptor signaling | 5.80E-03 | Ccl4, Cxcl10, Irf7, Tlr3 |
| Chemokine signaling | 2.40E-02 | Ccl2, Ccl4, Cxcl10, Prkcz |
| Cytokine-cytokine receptor interaction | 4.40E-02 | Ccl2, Ccl4, Cxcl10, Ifngr1 |
3.3. Network analyses of interferon genes
Since Ifit3 was altered in both datasets, and highly up-regulated in N9 microglia, we performed network analysis to provide insight into the role of Ifit3 in the interferon signaling pathway. Several key genes involved in neuroinflammation and interferon signaling were found to be positively correlated with Ifit3 including Ifi208 (0.996), Tnfaip8l3 (0.995), Cd69 (0.995), Tnfsf10 (0.997), Mx1 (0.995), Mx2 (0.993), Igtp (0.994), Ifit1bl1 (0.999), Cxcl10 (0.999), Ifit2 (0.999), Ifit3b (1.000), Ifit1 (1.000), and Isg15 (1.000) (Fig. 3A). Additional analysis using ImmGens Predicted Interferons Network tool identified several predicted regulators for Ifit3 including Irf7, Stat1, Stat2, Irf9, Aim2, Jak2, Irf2, Irf1, Stat3, and Nfkbie (Fig. 3B).
Figure 3. Ifit3 expression network analyses.
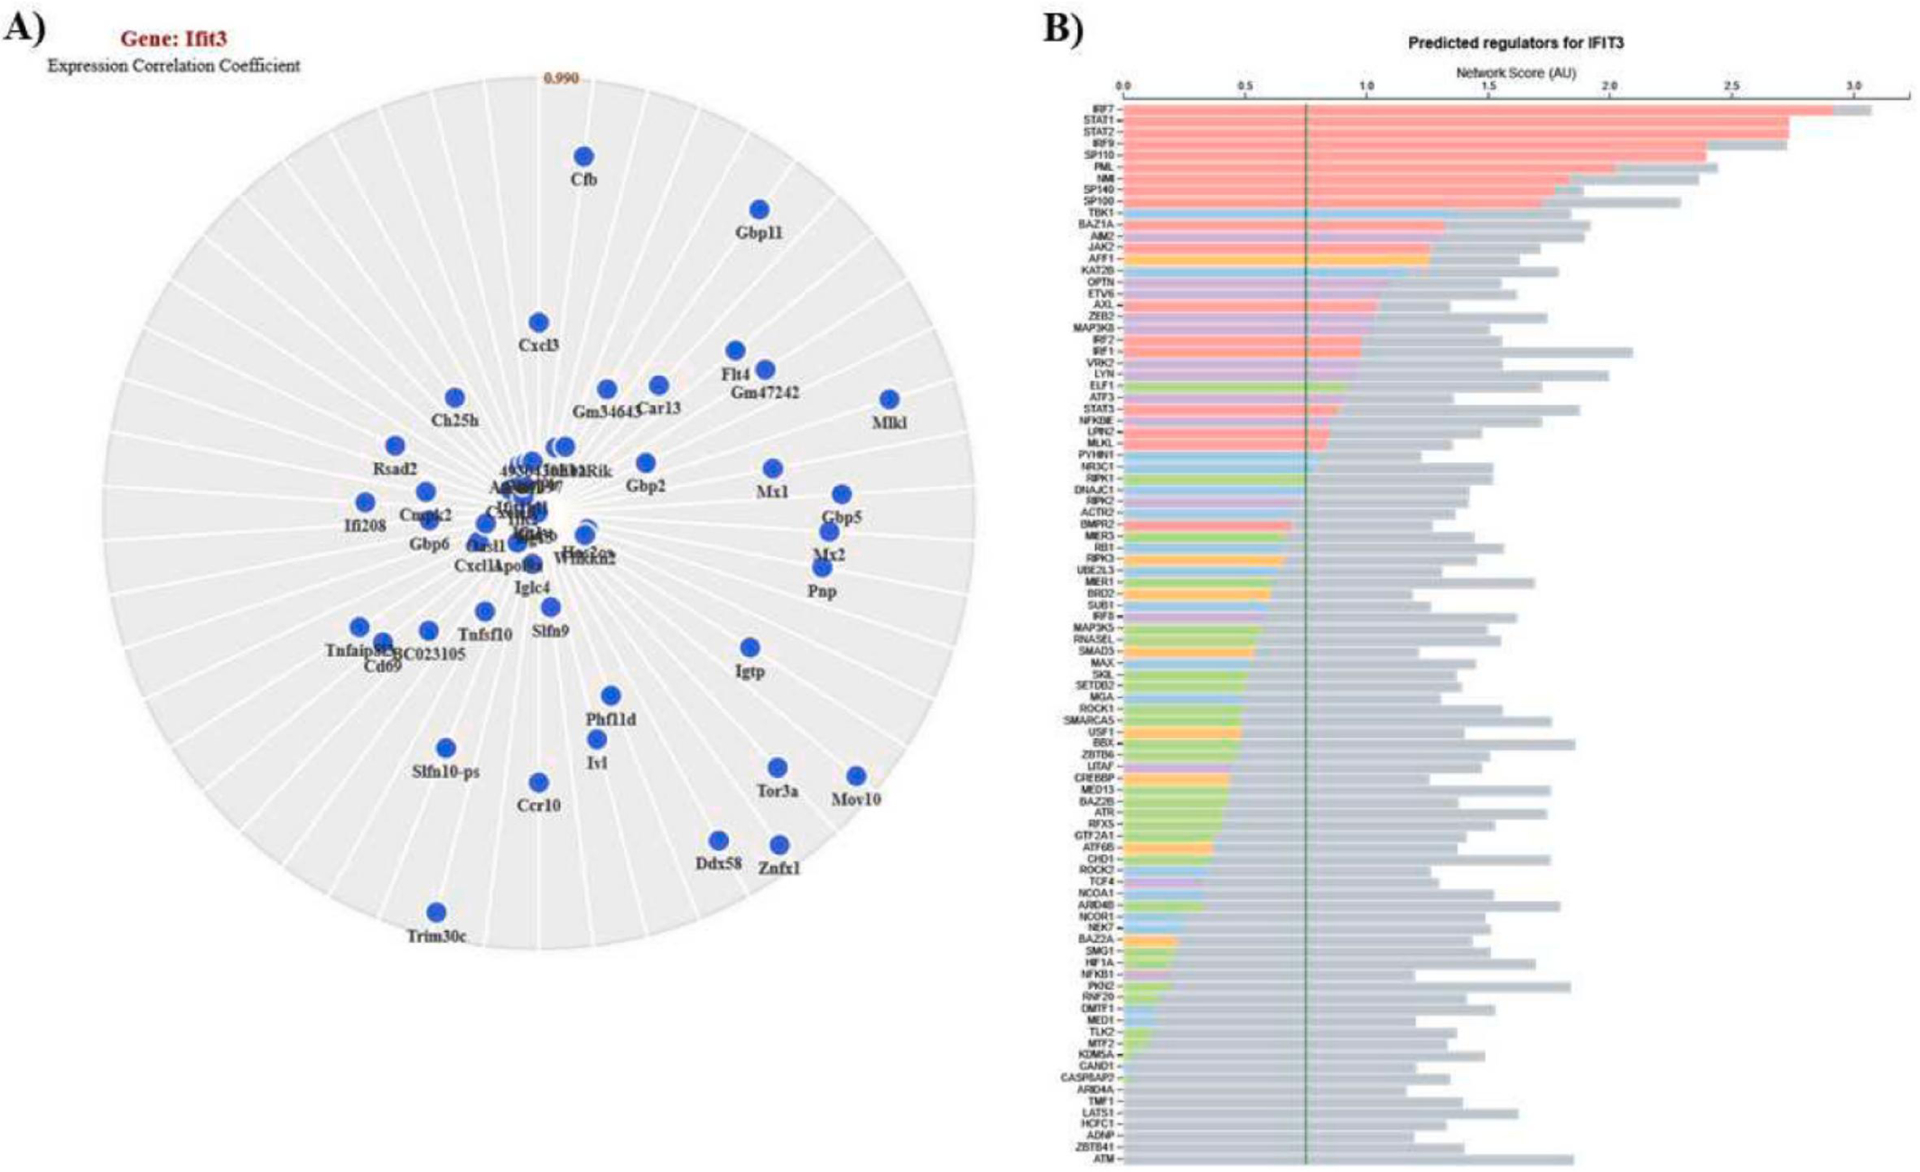
Analyses for Ifit3 positively correlated genes (A) and predicted regulators (B). The gene constellations shown were generated in ImmGen using the “myeloid cells” reference populations option. The predicted regulators were identified using ImmGens Predicted Interferons Network tool. The vertical green line indicates the confidence threshold at 1% FDR.
As Cxcl10 was also altered in both datasets, and the target of several therapeutic drugs, expression network analysis was performed to identify genes positively correlated with Cxcl10. Numerous genes involved in neuroinflammation and interferon signaling were identified as being positively correlated with Cxcl10 including Ifi208 (0.993), Mx2 (0.990), Mx1 (0.994), Igtp (0.991), Tnfsf10 (0.996), Isg15 (0.999), Ifit3 (0.999), Ifit3b (0.999), Ifit2 (0.998), Cd69 (0.996), and Tnfaip8l3 (0.997) (Fig. 4A). Further analysis using ImmGens’s Predicted Interferons Network tool identified several important interferon-related predicted regulators of Cxcl10 including Irf7, Stat2, Stat1, Aim2, Irf9, Jak2, Nfkbie, Irf1, Irf8, and Irf2 (Fig. 4B). Together, these results identify potential key mediators in the interferon-related neuroinflammatory response in AD and could be promising targets for AD intervention regimens.
Figure 4. Cxcl10 expression network analyses.
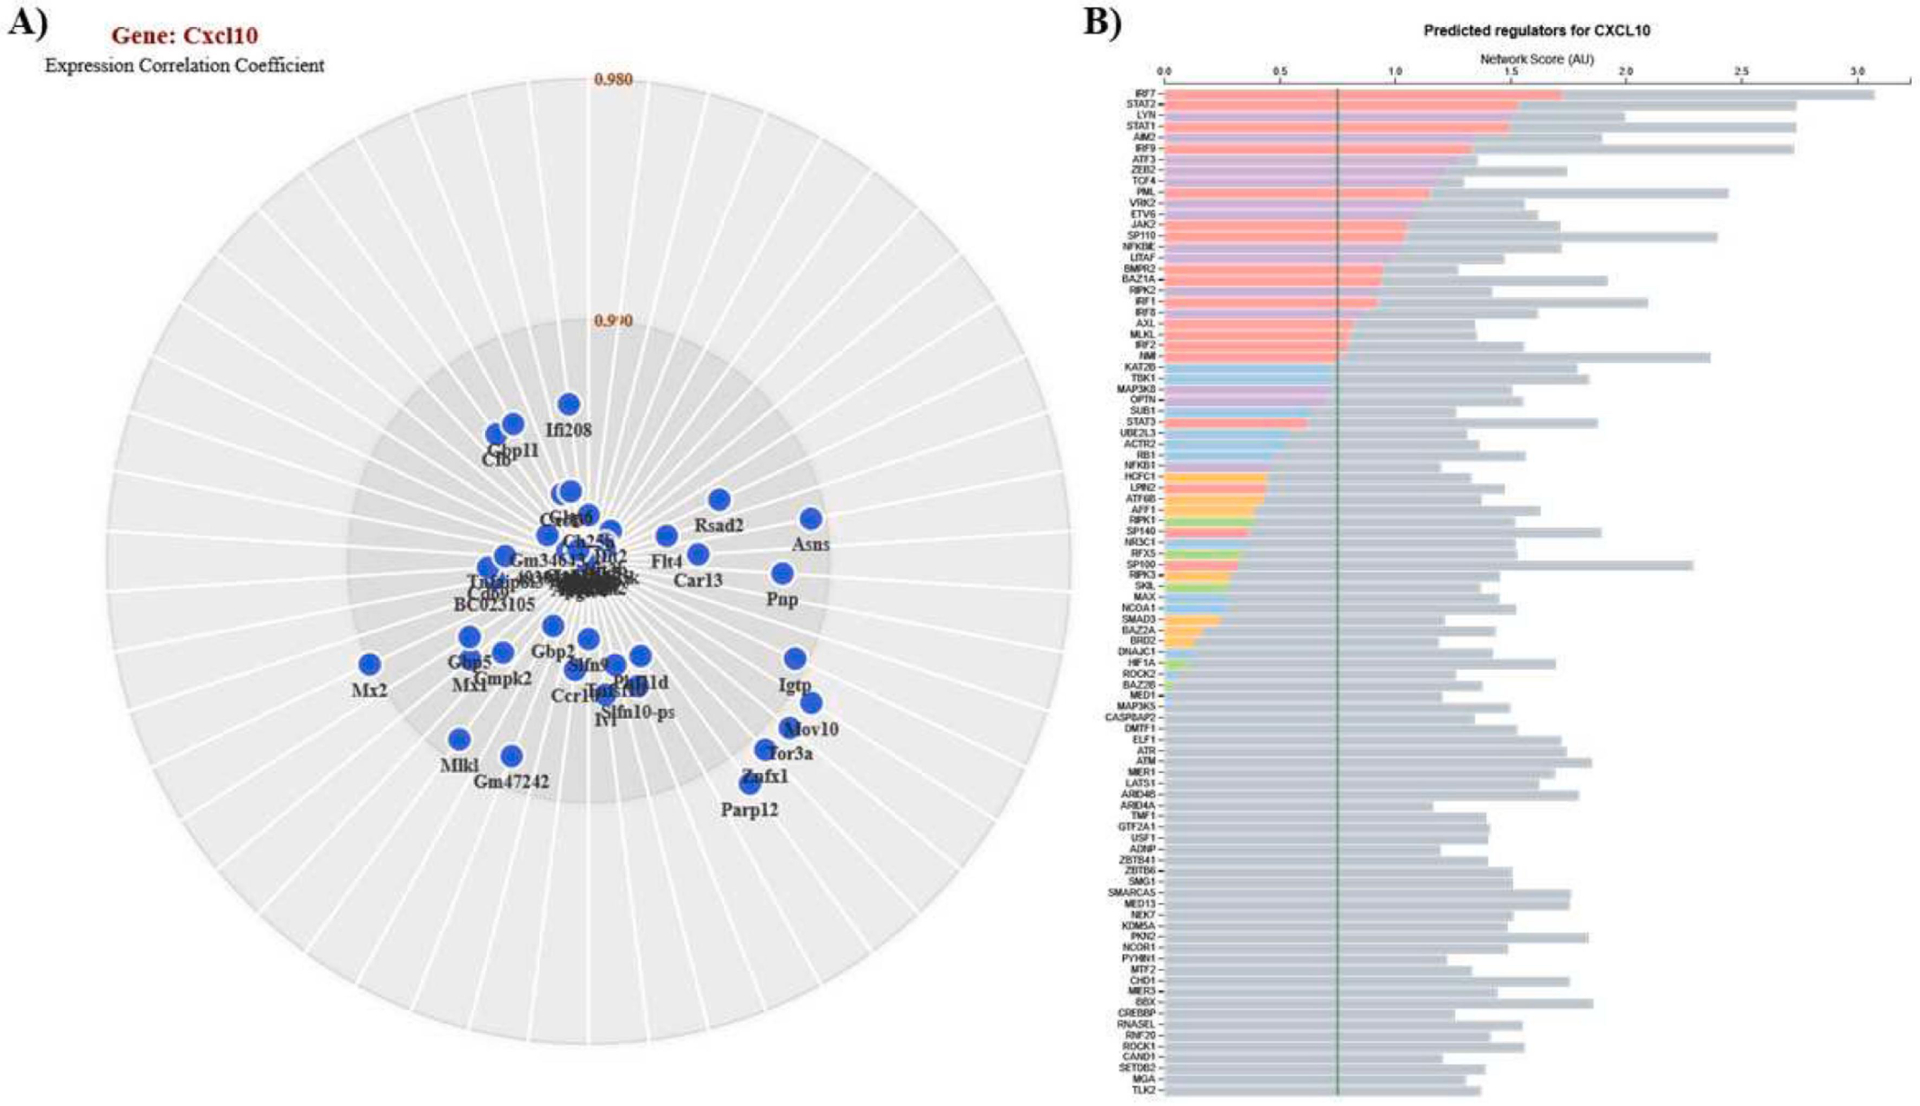
Analyses for Cxcl10 positively correlated genes (A) and predicted regulators (B). Genes constellations and predicted regulators were generated using the same tools as used for Ifit3 (Figure 3).
3.4. Interferon genes as targets for therapeutic drugs
In an effort to identify targets for therapeutic treatments of AD, we performed gene-drug interaction analysis in DGIdb on the interferon DEG in N9 and 5XFAD mouse microglia. For N9 microglia, a total of 18 interferon-related DEG had interactions with therapeutic drugs (Fig. 5A). For 5XFAD mouse microglia, a total of seven interferon-related DEG had interactions with therapeutic drugs (Fig. 5B). Cxcl10 was common to both datasets and DGIdb identified 12 therapeutic drug interactions with this gene. Some of the therapeutic agents identified included drugs to treat inflammation (methylprednisolone, eldelumab), cholesterol (atorvastatin), cancer (oxaliplatin), and HIV (zidovudine, stavudine, ritonavir). Experimental validation showed pre-treatment of LPS-stimulated N9 cells with methylprednisolone and zidovudine significantly reduced CXCL10 secretion when compared to the DMSO control (Fig. 5C) and these drugs were not toxic to N9 microglia (Fig. 5D). Risperidone was found to target Ccl2, common to both datasets, which is an antipsychotic used to treat mental disorders such as bipolar depression and schizophrenia. A complete list of the interferon DEG and their associated drugs for N9 and 5XFAD mouse microglia is shown in Supplementary Tables S7 and S8, respectively.
Figure 5. Gene-drug interactions.
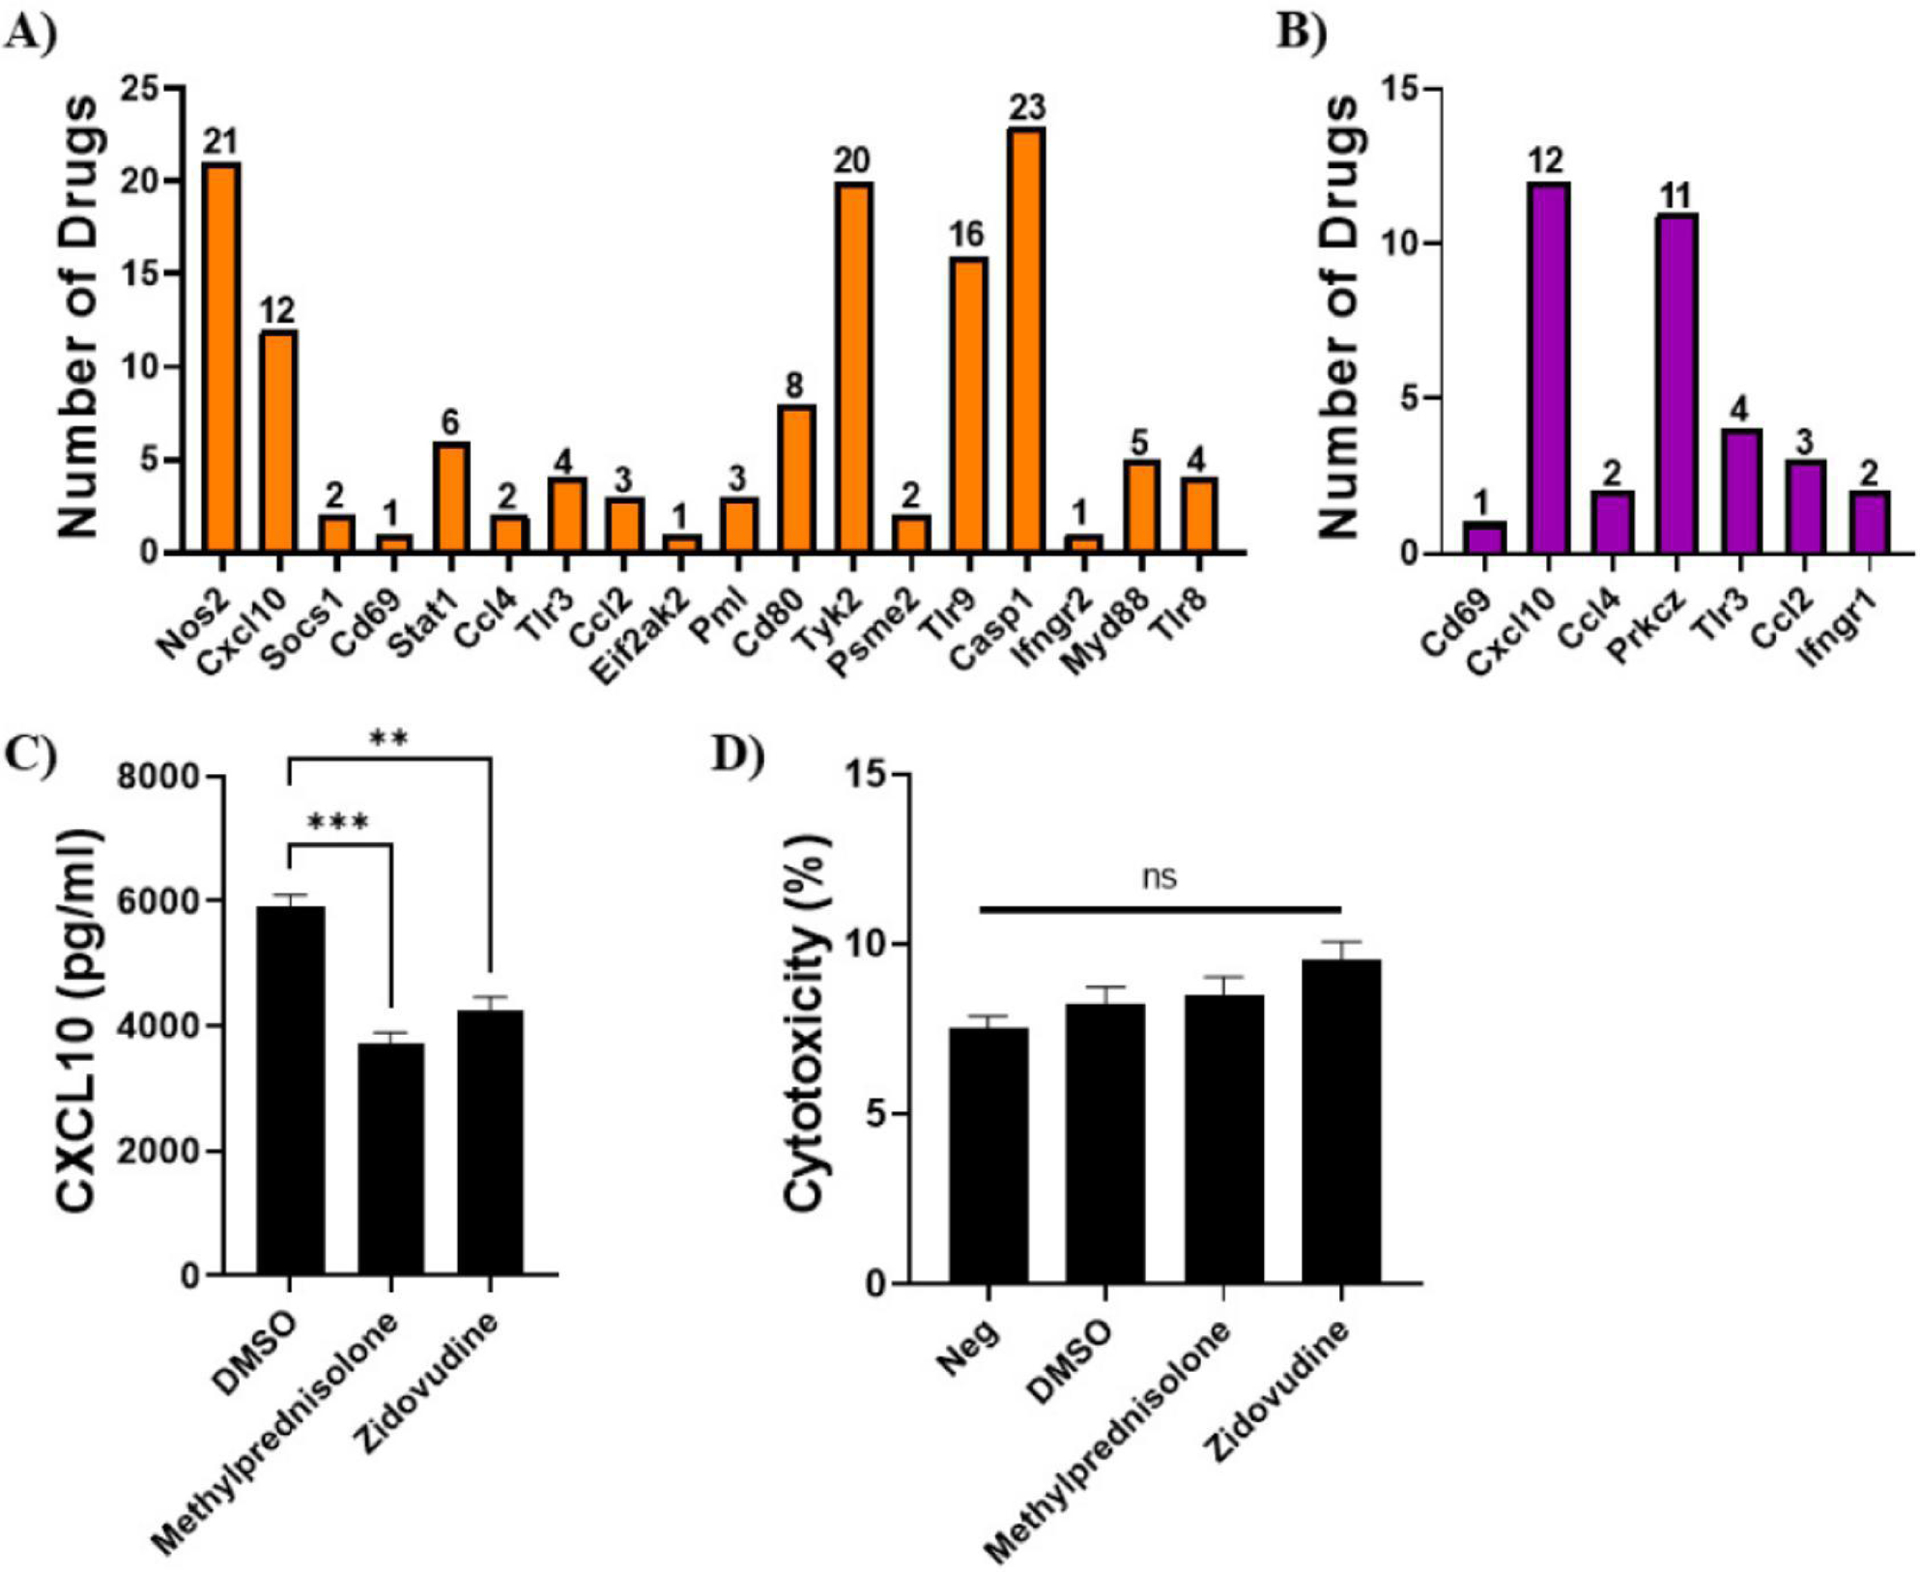
Interactions between therapeutic drugs and the N9 (A) and mouse (B) microglial interferon DEG. Genes identified with drug interactions are shown and the number of drugs associated with each gene is shown above each bar. (C) Experimental validation of selected drugs targeting Cxcl10. N9 microglia were treated with methylprednisolone, zidovudine, and DMSO (control) and stimulated with LPS (1 μg/ml) for 6 hours. Supernatants were collected and assayed for CXCL10 by ELISA. (D) Drug toxicity in N9 microglia treated with methylprednisolone, zidovudine, and DMSO (control) for 8 hours. Cytotoxicity was determined by LDH release in the cell culture supernatants. Data are shown as mean ± SEM. ***P < 0.001, **P < 0.01. ns = not significant.
3.5. Secretion of interferon-related cytokines and chemokines by microglia
Since many of the interferon DEG were type 1 interferons, we performed ELISAs on supernatants from LPS-stimulated N9 and primary microglia for CXCL10, IFN-α, and IFN-β. We have previously shown significant induction of several proinflammatory cytokines and chemokines (IL-6, TNF-α, MIP-1α, RANTES, MCP-1) in LPS-stimulated N9 and primary microglia (Shippy et al., 2022). Furthermore, we showed no significant induction in IFN-γ, a type 2 interferon, in both cell types (Shippy et al., 2022). In this study, CXCL10 production was markedly increased in both primary (Fig. 6A) and N9 (Fig. 6B) LPS-stimulated microglia. Additionally, IFN-β production was significantly increased in both primary (Fig. 6C) and N9 (Fig. 6D) LPS-stimulated microglia. IFN-α levels were also evaluated, but were below the detection limit of the assay for both cell types.
Figure 6. Interferon-related cytokines and chemokines induced by LPS in microglia.
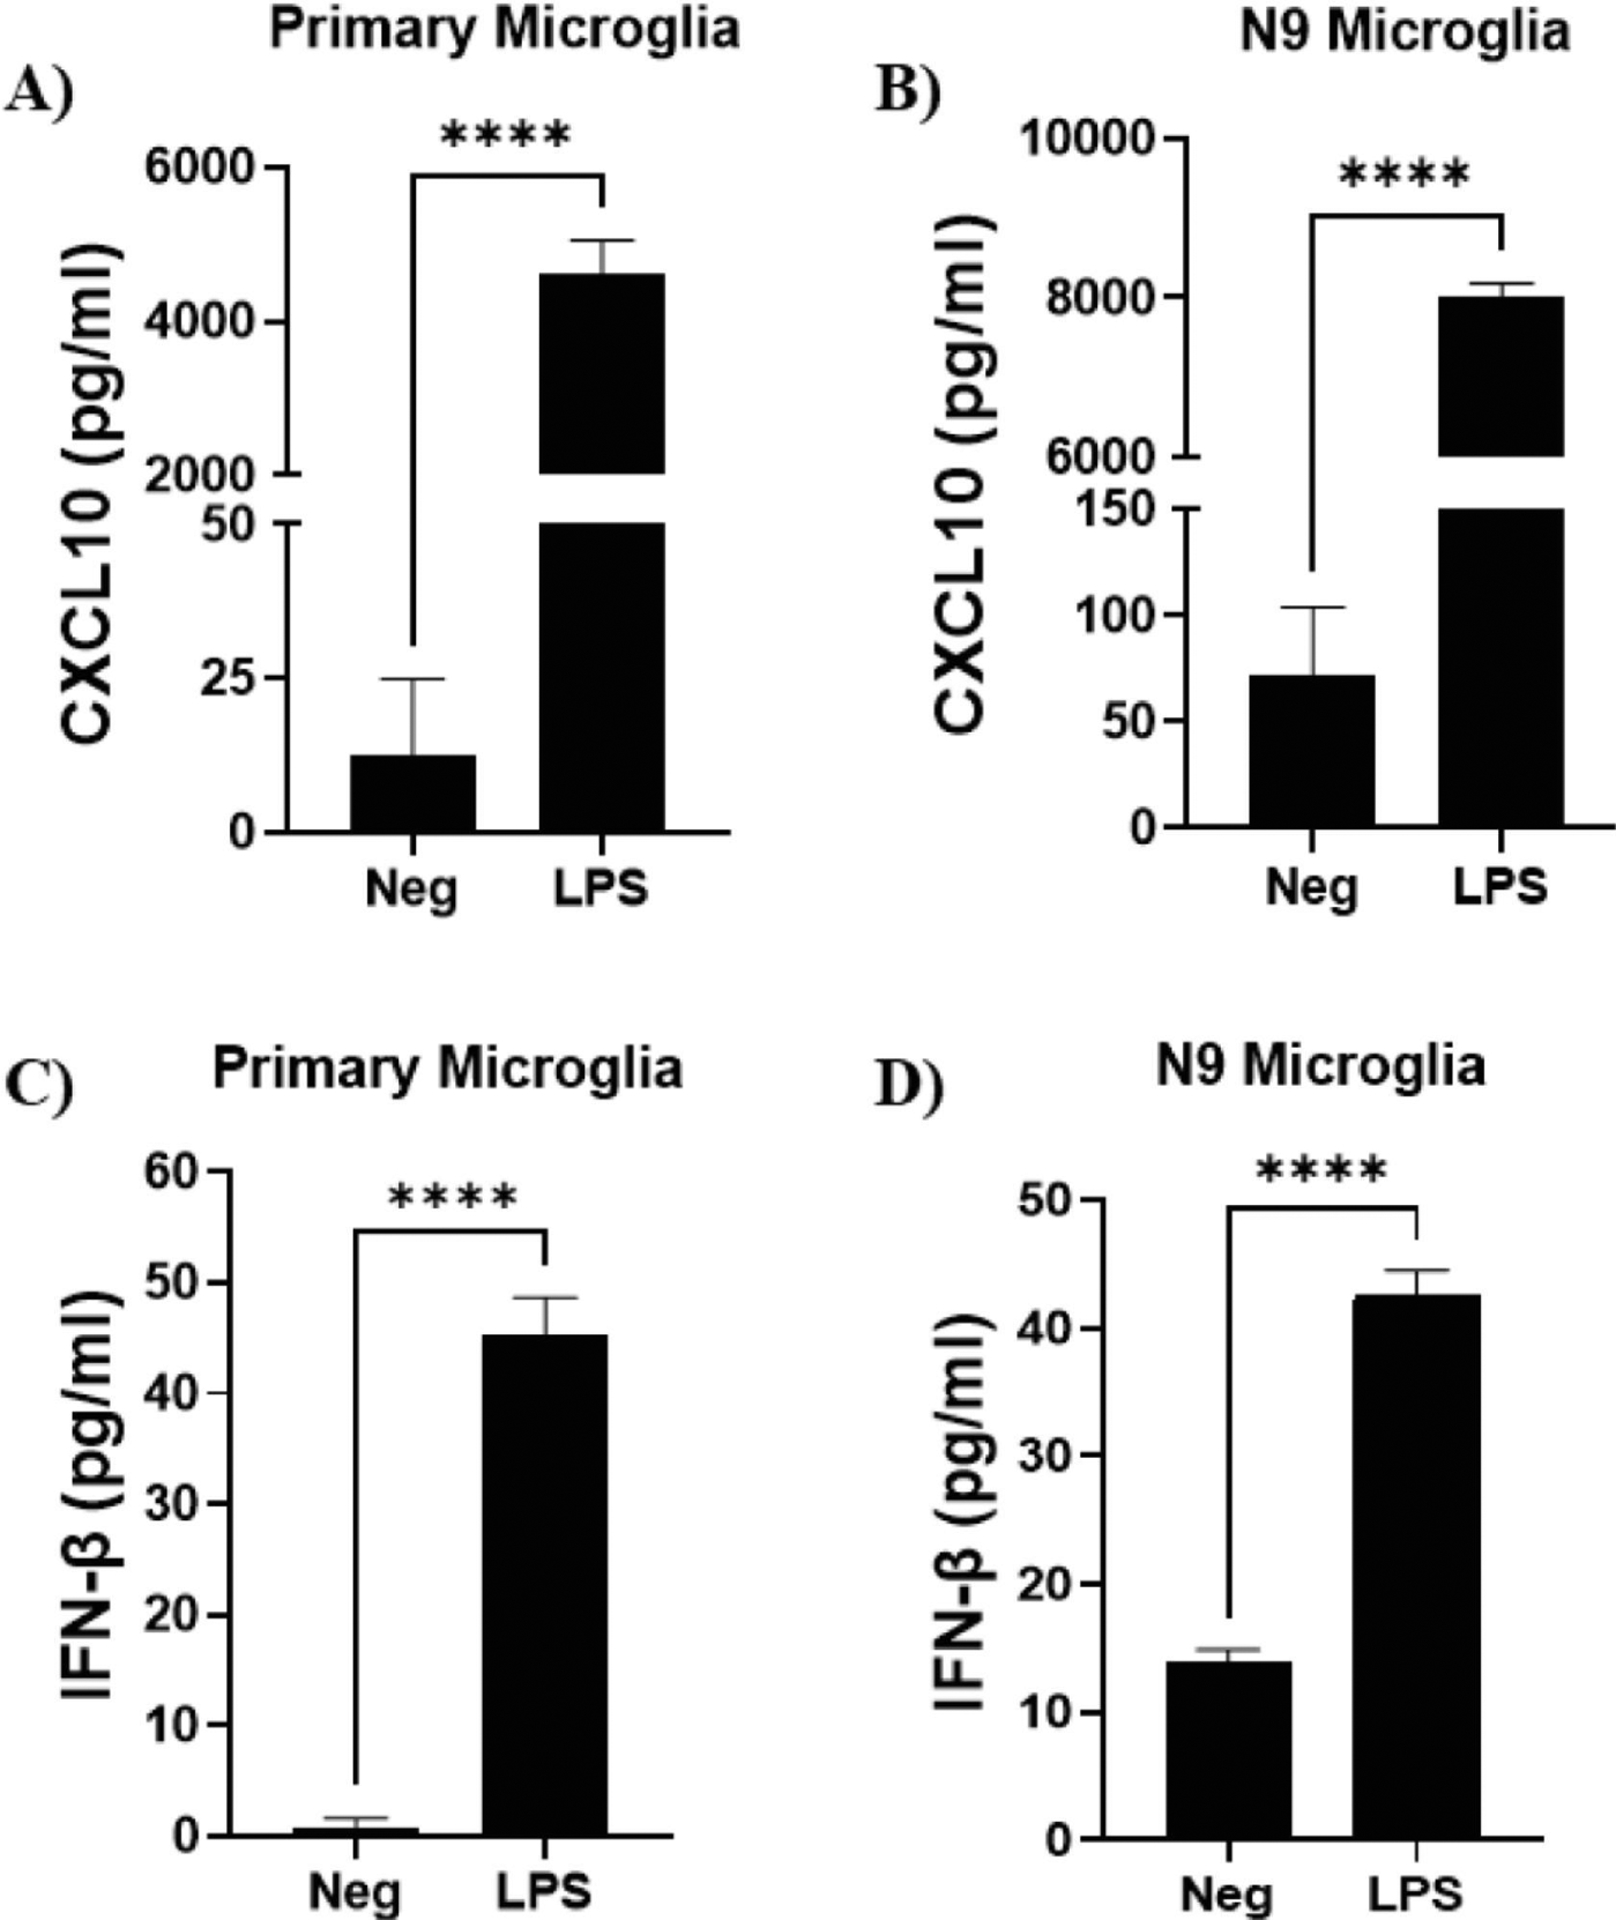
Primary microglia were stimulated with LPS (50 ng/ml) for 6 hours. N9 microglia were stimulated with LPS (1 μg/ml) for 6 hours. Supernatants were collected and assayed for CXCL10 secreted by primary (A) and N9 (B) microglia. Supernatants were also assay for IFN-β secreted by primary (C) and N9 (D) microglia. Experiments were performed in duplicate. Results are from three independent experiments. Data are shown as mean ± SEM. ****P ≤ 0.0001. IFN-α was also evaluated, but was below the detection limit of the assay.
4. Discussion
In our previous work we identified interferon pathways as a major shared neuroinflammatory pathway between microglia from a mouse with AD-like pathology and N9 cells stimulated with LPS (Shippy et al., 2022). Because of these results in this study, we examined sequencing and microarray data from N9 cells and mouse microglia to identify interferon-related genes important in microglial-mediated neuroinflammation in AD. Although we feel that these studies are important as they allow for a focused examination of the interferon pathway we acknowledge the important caveat that these studies are inherently biased by the small number of genes examined and the enrichment of interferon genes in the analysis. Further studies suggest neuroinflammation specifically enhances tau and amyloid pathologies (Baik et al., 2016; Leyns and Holtzman, 2017). As a result, therapeutics that target biomarkers of neuroinflammation are a promising strategy for AD. Several clinical trials have been conducted using non-steroidal anti-inflammatory drugs (NSAIDs) with mixed results (McGeer and McGeer, 2007). Although preliminary studies suggest NSAIDs are correlated with a decreased risk of AD (Zhang et al., 2018), placebo controlled clinical trials have resulted in neutral or negative results (Hampel et al., 2020) indicating a need for new therapeutics and targets. In our study, CXCL10 was highly up-regulated, and our analysis indicated that atorvastatin, a drug to treat high cholesterol and triglycerides, may target CXCL10. Hypercholesterolemia and hypertriglyceridemia have been identified as major risk factors for developing AD (Zhang et al., 2022), so drugs used to treat other diseases that are risk factors for AD, and also target biomarkers of neuroinflammation, could result in an effective AD treatment strategy.
The type 1 interferon response is implicated in AD pathogenesis by promoting neuroinflammation, synapse loss, and cognitive impairment (Moore et al., 2020; Roy et al., 2020; Roy et al., 2022). Studies show brains of AD patients have higher expression levels of type 1 interferons (IFN-α, IFN-β) and interferon-stimulated genes (ISGs) when compared to healthy controls (Taylor et al., 2014; Roy et al., 2020). These studies also identified increased protein expression of IRF7, a type 1 interferon regulator, in the prefrontal cortex of brains of AD patients (Taylor et al., 2014; Roy et al., 2020). In our study, transcripts of IRF7 were increased in both datasets. We also observed increased IFN-β in the supernatants of LPS-stimulated primary and N9 microglial, but did not detect IFN-α in the supernatants of either cell type. In viral infections, IFN-β is produced first, and activates IRF7, which in turn induces multiple subtypes of IFN-α (Marie et al., 1998). Whether or not a similar mechanism is used by microglia in AD remains unclear.
A marked increase in CXCL10 was detected in the supernatants of LPS-stimulated N9 and primary microglia compared to unstimulated control cells. Transcripts of Cxcl10 were also increased in both datasets, and network analysis showed a positive correlation of Cxcl10 with many interferon genes. In macrophages, type 1 interferons were reported to act downstream of toll-like receptor signaling, and activate a unique gene signature, including chemokines like Cxcl10 (Toshchakov et al., 2002). In the context of AD, CXCL10 levels were reported to be higher in the prefrontal cortex of AD (Bradburn et al., 2018) yet the role of CXCL10 in AD is not clearly understood. For example, Correa et al. reported a positive correlation between CXCL10 and Aβ levels, but found no difference in CXCL10 levels in the cerebrospinal fluid (CSF) of AD patients versus healthy controls (Correa et al., 2011). Other studies by Galimberti et al. showed CSF CXCL10 levels were higher in AD patients when compared to healthy control (Galimberti et al., 2003), but a follow up study did not validate these findings (Galimberti et al., 2006). Although CXCL10 may not be a viable biomarker for AD, these data indicate CXCL10 could be a key mediator in microglial-mediated neuroinflammation in AD, and could be a promising target for therapeutic intervention.
Interferon-induced protein with tetratricopeptide repeats 3 (Ifit3) has been implicated with protective activity to viral infections, such as dengue fever (Hsu et al., 2013), as well as viruses that affect the CNS (Wacher et al., 2007). IFIT3 has also been shown to be a key part of the immune defense response pathway during schizophrenia development (Guo et al., 2022). IFIT3 is reported to modulate the expression of signal transducer and activator of transcription 1 (STAT1) (Naranjo et al., 2021), and the Janus kinase (JAK) (JAK/STAT) signaling pathway is a major source of neuroinflammation in AD (Jain et al., 2021). Although IFIT3 and the JAK/STAT signaling pathway have been shown to be important in several diseases, the role of IFIT3 in AD has not been characterized. In our study, Ifit3 was highly up-regulated in LPS-stimulated N9 microglia (log2FC = 7.21) and modestly up-regulated in 5XFAD mouse microglia (log2FC = 1.14). Furthermore, Ifit3 was positively correlated with several other interferon genes, suggesting IFIT3 is a key member of the interferon-related response in AD. Together, these data suggest a pivotal role for Ifit3 in microglial-mediated neuroinflammation, and may be a potential candidate for use as a novel biomarker of AD.
IFN-γ is the only member of the type 2 interferon family. Previous studies have implicated IFN-γ in neuroinflammation and AD pathogenesis (Bate et al., 2006; Belkhelfa et al., 2014) while others suggest IFN-γ attenuates AD pathology (Chakrabarty et al., 2010; He et al., 2020) with a general consensus of a delicate balance between the type 1 and 2 interferon responses (Deczkowska et al., 2016). In our study, IFN-γ was not altered in either dataset, and we have previously shown no significant difference in IFN-γ secretion from LPS-stimulated primary and N9 microglial cells when compared to unstimulated control cells (Shippy et al., 2022). In contrast, our GO BP analysis in N9 microglia found interferon-related DEG responsible for the cellular response to IFN-γ (Casp1, Ccl2, Ccl4, Ccl5, Nos2, Stat1, Tlr3) and positive regulation of IFN-γ production (Tlr3, Tlr8, Tlr9, Tyk2). Furthermore, GO BP analysis of 5XFAD mouse microglia found interferon-related DEG in the response to IFN-γ (Bst2, Irgm2, Ifitm2, Ifitm3). Additional investigation is needed to determine if an antagonistic relationship exists between the type1 and 2 interferon responses in neuroinflammation and AD.
One limitation of our study is that only microglia were used. Several types of cells in the brain perform immune functions (microglia, astrocytes, oligodendrocytes), including responding to damage-associated molecular patterns (DAMPs) (De Strooper and Karran, 2016; Chen et al., 2020). Although initially underappreciated, several studies indicate reactive astrocytes play an important role in neuroinflammation-driven AD pathology (Gitter et al., 1995; Garwood et al., 2011). Furthermore, cross-talk between microglia and astrocytes may be an important neuroinflammatory mechanism in AD, as reactive astrocytes are induced by activated microglia (Liddelow et al., 2017). The study by Roy et al. describes type 1 interferon reactive astrocytes that expanded in an Aβ pathology-dependent manner after the initial type 1 interferon microglial response (Roy et al., 2022). Also, the study by Hasel et al. described specialized astrocytes expressing ISGs in the meningeal layers, blood vessels, and ventricles of 5XFAD mice (Hasel et al., 2021). A second limitation of our study is that only mouse microglia were used. We examined several human AD transcriptome datasets, but human microglial gene signatures are much more heterogeneous than in mice (Chen and Colonna, 2021). The validity of comparing the human and mouse microglial transcriptome in AD remains controversial as some studies suggest they are distinct (Olah et al., 2020; Zhou et al., 2020) while others suggest they are analogous (Ulland et al., 2017; Sobue et al., 2021).
Overall, our interferon transcriptomic data provides a useful resource for further investigation of microglial-mediated neuroinflammation in AD. Furthermore, our data identified several drugs that may inhibit interferon-related microglial molecular targets to reduce neuroinflammation to attenuate AD pathology.
Supplementary Material
Highlights.
Transcriptomic analyses of AD versus non-AD from N9 and mouse microglia.
64 differentially expressed interferon genes in N9 microglia (LPS vs. control).
26 differentially expressed interferon genes in mouse microglia (5XFAD vs. WT).
Microglial-mediated interferon response promotes neuroinflammation in AD.
Acknowledgements
We thank Jyoti Watters for assistance in acquiring the N9 microglial cell line. We thank Paula Ricciardi-Castagnoli for the N9 microglial cells. The graphical abstract was created with BioRender.com.
Funding
This work was supported by the National Institutes of Health R21AG068652 and R01AG070973.
Abbreviations:
- Aβ
amyloid β
- AD
Alzheimer’s disease
- BP
biological process
- CC
cellular component
- CNS
central nervous system
- CSF
cerebrospinal fluid
- DAMPs
damage-associated molecular patterns
- DAVID
Database for Annotation, Visualization and Integrated Discovery
- DEG
differentially expressed genes
- DGIdb
drug-gene interaction database
- EAE
experimental autoimmune encephalomyelitis
- FC
fold change
- FDR
false-discovery rate
- GO
gene ontology
- GWAS
genome-wide association studies
- ISGs
interferon-stimulated genes
- KEGG
Kyoto Encyclopedia of Genes and Genomes
- LPS
lipopolysaccharide
- MF
molecular function
- MS
multiple sclerosis
- NFTs
neurofibrillary tangles
- NSAIDs
non-steroidal anti-inflammatory drugs
- RIN
RNA integrity number
- RNA-seq
RNA-sequencing
- SEM
standard experimental mean
Footnotes
Publisher's Disclaimer: This is a PDF file of an unedited manuscript that has been accepted for publication. As a service to our customers we are providing this early version of the manuscript. The manuscript will undergo copyediting, typesetting, and review of the resulting proof before it is published in its final form. Please note that during the production process errors may be discovered which could affect the content, and all legal disclaimers that apply to the journal pertain.
Credit author contribution statement
Daniel Shippy: Conceptualization, Investigation, Data curation, Formal analysis, Methodology, Writing-original draft. Tyler Ulland: Conceptualization, Supervision, Funding acquisition, Writing-review & editing.
Declaration of competing interest
The authors declare that they have no known competing financial interests or personal relationships that could have appeared to influence the work reported in this paper.
Ethical approval and consent to participate
All methods were carried out in accordance with relevant local and University of Wisconsin guidelines and regulations. All animals were handled in accordance with the Animal Research: Reporting of in vivo Experiments (ARRIVE) guidelines and the University of Wisconsin’s Institutional Animal Care and Use Committee policies and our approved protocols.
Data availability
The datasets generated and/or analyzed during the current study are available in the Gene Expression Omnibus (GEO) repository, GSE65067 and GSE183038.
References
- Baik SH, Kang S, Son SM and Mook-Jung I, 2016. Microglia contributes to plaque growth by cell death due to uptake of amyloid beta in the brain of Alzheimer’s disease mouse model. Glia 64, 2274–2290. [DOI] [PubMed] [Google Scholar]
- Bate C, Kempster S, Last V and Williams A, 2006. Interferon-gamma increases neuronal death in response to amyloid-beta1–42. J Neuroinflammation 3, 7. [DOI] [PMC free article] [PubMed] [Google Scholar]
- Belkhelfa M, Rafa H, Medjeber O, Arroul-Lammali A, Behairi N, Abada-Bendib M, Makrelouf M, Belarbi S, Masmoudi AN, Tazir M and Touil-Boukoffa C, 2014. IFN-gamma and TNF-alpha are involved during Alzheimer disease progression and correlate with nitric oxide production: a study in Algerian patients. J Interferon Cytokine Res 34, 839–47. [DOI] [PubMed] [Google Scholar]
- Bradburn S, McPhee J, Bagley L, Carroll M, Slevin M, Al-Shanti N, Barnouin Y, Hogrel JY, Paasuke M, Gapeyeva H, Maier A, Sipila S, Narici M, Robinson A, Mann D, Payton A, Pendleton N, Butler-Browne G and Murgatroyd C, 2018. Dysregulation of C-X-C motif ligand 10 during aging and association with cognitive performance. Neurobiol Aging 63, 54–64. [DOI] [PMC free article] [PubMed] [Google Scholar]
- Chakrabarty P, Ceballos-Diaz C, Beccard A, Janus C, Dickson D, Golde TE and Das P, 2010. IFN-gamma promotes complement expression and attenuates amyloid plaque deposition in amyloid beta precursor protein transgenic mice. J Immunol 184, 5333–43. [DOI] [PMC free article] [PubMed] [Google Scholar]
- Chen WT, Lu A, Craessaerts K, Pavie B, Sala Frigerio C, Corthout N, Qian X, Lalakova J, Kuhnemund M, Voytyuk I, Wolfs L, Mancuso R, Salta E, Balusu S, Snellinx A, Munck S, Jurek A, Fernandez Navarro J, Saido TC, Huitinga I, Lundeberg J, Fiers M and De Strooper B, 2020. Spatial Transcriptomics and In Situ Sequencing to Study Alzheimer’s Disease. Cell 182, 976–991 e19. [DOI] [PubMed] [Google Scholar]
- Chen Y and Colonna M, 2021. Microglia in Alzheimer’s disease at single-cell level. Are there common patterns in humans and mice? J Exp Med 218. [DOI] [PMC free article] [PubMed] [Google Scholar]
- Cheng W, Zhao Q, Xi Y, Li C, Xu Y, Wang L, Niu X, Wang Z and Chen G, 2015. IFN-beta inhibits T cells accumulation in the central nervous system by reducing the expression and activity of chemokines in experimental autoimmune encephalomyelitis. Mol Immunol 64, 152–62. [DOI] [PubMed] [Google Scholar]
- Correa JD, Starling D, Teixeira AL, Caramelli P and Silva TA, 2011. Chemokines in CSF of Alzheimer’s disease patients. Arq Neuropsiquiatr 69, 455–9. [DOI] [PubMed] [Google Scholar]
- Cotto KC, Wagner AH, Feng YY, Kiwala S, Coffman AC, Spies G, Wollam A, Spies NC, Griffith OL and Griffith M, 2018. DGIdb 3.0: a redesign and expansion of the drug-gene interaction database. Nucleic Acids Res 46, D1068–D1073. [DOI] [PMC free article] [PubMed] [Google Scholar]
- De Strooper B and Karran E, 2016. The Cellular Phase of Alzheimer’s Disease. Cell 164, 603–15. [DOI] [PubMed] [Google Scholar]
- Deczkowska A, Baruch K and Schwartz M, 2016. Type I/II Interferon Balance in the Regulation of Brain Physiology and Pathology. Trends Immunol 37, 181–192. [DOI] [PubMed] [Google Scholar]
- Etminan M, Gill S and Samii A, 2003. Effect of non-steroidal anti-inflammatory drugs on risk of Alzheimer’s disease: systematic review and meta-analysis of observational studies. BMJ 327, 128. [DOI] [PMC free article] [PubMed] [Google Scholar]
- Fang J, Zhang P, Wang Q, Chiang CW, Zhou Y, Hou Y, Xu J, Chen R, Zhang B, Lewis SJ, Leverenz JB, Pieper AA, Li B, Li L, Cummings J and Cheng F, 2022. Artificial intelligence framework identifies candidate targets for drug repurposing in Alzheimer’s disease. Alzheimers Res Ther 14, 7. [DOI] [PMC free article] [PubMed] [Google Scholar]
- Freshour SL, Kiwala S, Cotto KC, Coffman AC, McMichael JF, Song JJ, Griffith M, Griffith OL and Wagner AH, 2021. Integration of the Drug-Gene Interaction Database (DGIdb 4.0) with open crowdsource efforts. Nucleic Acids Res 49, D1144–D1151. [DOI] [PMC free article] [PubMed] [Google Scholar]
- Galimberti D, Schoonenboom N, Scarpini E, Scheltens P and Dutch-Italian Alzheimer Research G, 2003. Chemokines in serum and cerebrospinal fluid of Alzheimer’s disease patients. Ann Neurol 53, 547–8. [DOI] [PubMed] [Google Scholar]
- Galimberti D, Schoonenboom N, Scheltens P, Fenoglio C, Venturelli E, Pijnenburg YA, Bresolin N and Scarpini E, 2006. Intrathecal chemokine levels in Alzheimer disease and frontotemporal lobar degeneration. Neurology 66, 146–7. [DOI] [PubMed] [Google Scholar]
- Gallardo G and Holtzman DM, 2019. Amyloid-beta and Tau at the Crossroads of Alzheimer’s Disease. Adv Exp Med Biol 1184, 187–203. [DOI] [PubMed] [Google Scholar]
- Garwood CJ, Pooler AM, Atherton J, Hanger DP and Noble W, 2011. Astrocytes are important mediators of Abeta-induced neurotoxicity and tau phosphorylation in primary culture. Cell Death Dis 2, e167. [DOI] [PMC free article] [PubMed] [Google Scholar]
- Gitter BD, Cox LM, Rydel RE and May PC, 1995. Amyloid beta peptide potentiates cytokine secretion by interleukin-1 beta-activated human astrocytoma cells. Proc Natl Acad Sci U S A 92, 10738–41. [DOI] [PMC free article] [PubMed] [Google Scholar]
- Grimaldi LM, Zappala G, Iemolo F, Castellano AE, Ruggieri S, Bruno G and Paolillo A, 2014. A pilot study on the use of interferon beta-1a in early Alzheimer’s disease subjects. J Neuroinflammation 11, 30. [DOI] [PMC free article] [PubMed] [Google Scholar]
- Guo B, Jiang T, Wu F, Ni H, Ye J, Wu X, Ni C, Jiang M, Ye L, Li Z, Zheng X, Li S, Yang Q, Wang Z, Huang X and Zhao C, 2022. LncRNA RP5–998N21.4 promotes immune defense through upregulation of IFIT2 and IFIT3 in schizophrenia. Schizophrenia (Heidelb) 8, 11. [DOI] [PMC free article] [PubMed] [Google Scholar]
- Hampel H, Caraci F, Cuello AC, Caruso G, Nistico R, Corbo M, Baldacci F, Toschi N, Garaci F, Chiesa PA, Verdooner SR, Akman-Anderson L, Hernandez F, Avila J, Emanuele E, Valenzuela PL, Lucia A, Watling M, Imbimbo BP, Vergallo A and Lista S, 2020. A Path Toward Precision Medicine for Neuroinflammatory Mechanisms in Alzheimer’s Disease. Front Immunol 11, 456. [DOI] [PMC free article] [PubMed] [Google Scholar]
- Hasel P, Rose IVL, Sadick JS, Kim RD and Liddelow SA, 2021. Neuroinflammatory astrocyte subtypes in the mouse brain. Nat Neurosci 24, 1475–1487. [DOI] [PubMed] [Google Scholar]
- He Z, Yang Y, Xing Z, Zuo Z, Wang R, Gu H, Qi F and Yao Z, 2020. Intraperitoneal injection of IFN-gamma restores microglial autophagy, promotes amyloid-beta clearance and improves cognition in APP/PS1 mice. Cell Death Dis 11, 440. [DOI] [PMC free article] [PubMed] [Google Scholar]
- Heberle H, Meirelles GV, da Silva FR, Telles GP and Minghim R, 2015. InteractiVenn: a web-based tool for the analysis of sets through Venn diagrams. BMC Bioinformatics 16, 169. [DOI] [PMC free article] [PubMed] [Google Scholar]
- Heng TS, Painter MW and Immunological Genome Project C, 2008. The Immunological Genome Project: networks of gene expression in immune cells. Nat Immunol 9, 1091–4. [DOI] [PubMed] [Google Scholar]
- Hsu YL, Shi SF, Wu WL, Ho LJ and Lai JH, 2013. Protective roles of interferon-induced protein with tetratricopeptide repeats 3 (IFIT3) in dengue virus infection of human lung epithelial cells. PLoS One 8, e79518. [DOI] [PMC free article] [PubMed] [Google Scholar]
- Huang da W, Sherman BT and Lempicki RA, 2009a. Bioinformatics enrichment tools: paths toward the comprehensive functional analysis of large gene lists. Nucleic Acids Res 37, 1–13. [DOI] [PMC free article] [PubMed] [Google Scholar]
- Huang da W, Sherman BT and Lempicki RA, 2009b. Systematic and integrative analysis of large gene lists using DAVID bioinformatics resources. Nat Protoc 4, 44–57. [DOI] [PubMed] [Google Scholar]
- Hur JY, Frost GR, Wu X, Crump C, Pan SJ, Wong E, Barros M, Li T, Nie P, Zhai Y, Wang JC, Tcw J, Guo L, McKenzie A, Ming C, Zhou X, Wang M, Sagi Y, Renton AE, Esposito BT, Kim Y, Sadleir KR, Trinh I, Rissman RA, Vassar R, Zhang B, Johnson DS, Masliah E, Greengard P, Goate A and Li YM, 2020. The innate immunity protein IFITM3 modulates gamma-secretase in Alzheimer’s disease. Nature 586, 735–740. [DOI] [PMC free article] [PubMed] [Google Scholar]
- Iqbal K and Grundke-Iqbal I, 2010. Alzheimer’s disease, a multifactorial disorder seeking multitherapies. Alzheimers Dement 6, 420–4. [DOI] [PMC free article] [PubMed] [Google Scholar]
- Isaacs A and Lindenmann J, 1957. Virus interference. I. The interferon. Proc R Soc Lond B Biol Sci 147, 258–67. [PubMed] [Google Scholar]
- Jain M, Singh MK, Shyam H, Mishra A, Kumar S, Kumar A and Kushwaha J, 2021. Role of JAK/STAT in the Neuroinflammation and its Association with Neurological Disorders. Ann Neurosci 28, 191–200. [DOI] [PMC free article] [PubMed] [Google Scholar]
- Leng F and Edison P, 2021. Neuroinflammation and microglial activation in Alzheimer disease: where do we go from here? Nat Rev Neurol 17, 157–172. [DOI] [PubMed] [Google Scholar]
- Leyns CEG and Holtzman DM, 2017. Glial contributions to neurodegeneration in tauopathies. Mol Neurodegener 12, 50. [DOI] [PMC free article] [PubMed] [Google Scholar]
- Liddelow SA, Guttenplan KA, Clarke LE, Bennett FC, Bohlen CJ, Schirmer L, Bennett ML, Munch AE, Chung WS, Peterson TC, Wilton DK, Frouin A, Napier BA, Panicker N, Kumar M, Buckwalter MS, Rowitch DH, Dawson VL, Dawson TM, Stevens B and Barres BA, 2017. Neurotoxic reactive astrocytes are induced by activated microglia. Nature 541, 481–487. [DOI] [PMC free article] [PubMed] [Google Scholar]
- Marie I, Durbin JE and Levy DE, 1998. Differential viral induction of distinct interferon-alpha genes by positive feedback through interferon regulatory factor-7. EMBO J 17, 6660–9. [DOI] [PMC free article] [PubMed] [Google Scholar]
- McGeer PL and McGeer EG, 2007. NSAIDs and Alzheimer disease: epidemiological, animal model and clinical studies. Neurobiol Aging 28, 639–47. [DOI] [PubMed] [Google Scholar]
- Moore Z, Mobilio F, Walker FR, Taylor JM and Crack PJ, 2020. Abrogation of type-I interferon signalling alters the microglial response to Abeta1–42. Sci Rep 10, 3153. [DOI] [PMC free article] [PubMed] [Google Scholar]
- Mudo G, Frinchi M, Nuzzo D, Scaduto P, Plescia F, Massenti MF, Di Carlo M, Cannizzaro C, Cassata G, Cicero L, Ruscica M, Belluardo N and Grimaldi LM, 2019. Anti-inflammatory and cognitive effects of interferon-beta1a (IFNbeta1a) in a rat model of Alzheimer’s disease. J Neuroinflammation 16, 44. [DOI] [PMC free article] [PubMed] [Google Scholar]
- Naranjo NM, Salem I, Harris MA and Languino LR, 2021. IFIT3 (interferon induced protein with tetratricopeptide repeats 3) modulates STAT1 expression in small extracellular vesicles. Biochem J 478, 3905–3921. [DOI] [PMC free article] [PubMed] [Google Scholar]
- Nikodemova M and Watters JJ, 2011. Outbred ICR/CD1 mice display more severe neuroinflammation mediated by microglial TLR4/CD14 activation than inbred C57Bl/6 mice. Neuroscience 190, 67–74. [DOI] [PMC free article] [PubMed] [Google Scholar]
- Olah M, Menon V, Habib N, Taga MF, Ma Y, Yung CJ, Cimpean M, Khairallah A, Coronas-Samano G, Sankowski R, Grun D, Kroshilina AA, Dionne D, Sarkis RA, Cosgrove GR, Helgager J, Golden JA, Pennell PB, Prinz M, Vonsattel JPG, Teich AF, Schneider JA, Bennett DA, Regev A, Elyaman W, Bradshaw EM and De Jager PL, 2020. Single cell RNA sequencing of human microglia uncovers a subset associated with Alzheimer’s disease. Nat Commun 11, 6129. [DOI] [PMC free article] [PubMed] [Google Scholar]
- Patti F, Morra VB, Amato MP, Trojano M, Bastianello S, Tola MR, Cottone S, Plant A, Picconi O and Group CS, 2013. Subcutaneous interferon beta-1a may protect against cognitive impairment in patients with relapsing-remitting multiple sclerosis: 5-year follow-up of the COGIMUS study. PLoS One 8, e74111. [DOI] [PMC free article] [PubMed] [Google Scholar]
- Righi M, Mori L, De Libero G, Sironi M, Biondi A, Mantovani A, Donini SD and Ricciardi-Castagnoli P, 1989. Monokine production by microglial cell clones. Eur J Immunol 19, 1443–8. [DOI] [PubMed] [Google Scholar]
- Roy ER, Chiu G, Li S, Propson NE, Kanchi R, Wang B, Coarfa C, Zheng H and Cao W, 2022. Concerted type I interferon signaling in microglia and neural cells promotes memory impairment associated with amyloid beta plaques. Immunity 55, 879–894 e6. [DOI] [PMC free article] [PubMed] [Google Scholar]
- Roy ER, Wang B, Wan YW, Chiu G, Cole A, Yin Z, Propson NE, Xu Y, Jankowsky JL, Liu Z, Lee VM, Trojanowski JQ, Ginsberg SD, Butovsky O, Zheng H and Cao W, 2020. Type I interferon response drives neuroinflammation and synapse loss in Alzheimer disease. J Clin Invest 130, 1912–1930. [DOI] [PMC free article] [PubMed] [Google Scholar]
- Shadfar S, Hwang CJ, Lim MS, Choi DY and Hong JT, 2015. Involvement of inflammation in Alzheimer’s disease pathogenesis and therapeutic potential of anti-inflammatory agents. Arch Pharm Res 38, 2106–19. [DOI] [PubMed] [Google Scholar]
- Shippy DC and Ulland TK, 2022. Exploring the zinc-related transcriptional landscape in Alzheimer’s disease. IBRO Neurosci Rep 13, 31–37. [DOI] [PMC free article] [PubMed] [Google Scholar]
- Shippy DC, Watters JJ and Ulland TK, 2022. Transcriptional response of murine microglia in Alzheimer’s disease and inflammation. BMC Genomics 23, 183. [DOI] [PMC free article] [PubMed] [Google Scholar]
- Shippy DC, Wilhelm C, Viharkumar PA, Raife TJ and Ulland TK, 2020. Beta-Hydroxybutyrate inhibits inflammasome activation to attenuate Alzheimer’s disease pathology. J Neuroinflammation 17, 280. [DOI] [PMC free article] [PubMed] [Google Scholar]
- Sobue A, Komine O, Hara Y, Endo F, Mizoguchi H, Watanabe S, Murayama S, Saito T, Saido TC, Sahara N, Higuchi M, Ogi T and Yamanaka K, 2021. Microglial gene signature reveals loss of homeostatic microglia associated with neurodegeneration of Alzheimer’s disease. Acta Neuropathol Commun 9, 1. [DOI] [PMC free article] [PubMed] [Google Scholar]
- Spangenberg EE and Green KN, 2017. Inflammation in Alzheimer’s disease: Lessons learned from microglia-depletion models. Brain Behav Immun 61, 1–11. [DOI] [PMC free article] [PubMed] [Google Scholar]
- Taylor JM, Minter MR, Newman AG, Zhang M, Adlard PA and Crack PJ, 2014. Type-1 interferon signaling mediates neuro-inflammatory events in models of Alzheimer’s disease. Neurobiol Aging 35, 1012–23. [DOI] [PubMed] [Google Scholar]
- Toshchakov V, Jones BW, Perera PY, Thomas K, Cody MJ, Zhang S, Williams BR, Major J, Hamilton TA, Fenton MJ and Vogel SN, 2002. TLR4, but not TLR2, mediates IFN-beta-induced STAT1alpha/beta-dependent gene expression in macrophages. Nat Immunol 3, 392–8. [DOI] [PubMed] [Google Scholar]
- Ulland TK, Song WM, Huang SC, Ulrich JD, Sergushichev A, Beatty WL, Loboda AA, Zhou Y, Cairns NJ, Kambal A, Loginicheva E, Gilfillan S, Cella M, Virgin HW, Unanue ER, Wang Y, Artyomov MN, Holtzman DM and Colonna M, 2017. TREM2 Maintains Microglial Metabolic Fitness in Alzheimer’s Disease. Cell 170, 649–663 e13. [DOI] [PMC free article] [PubMed] [Google Scholar]
- Wacher C, Muller M, Hofer MJ, Getts DR, Zabaras R, Ousman SS, Terenzi F, Sen GC, King NJ and Campbell IL, 2007. Coordinated regulation and widespread cellular expression of interferon-stimulated genes (ISG) ISG-49, ISG-54, and ISG-56 in the central nervous system after infection with distinct viruses. J Virol 81, 860–71. [DOI] [PMC free article] [PubMed] [Google Scholar]
- Wang WY, Tan MS, Yu JT and Tan L, 2015a. Role of pro-inflammatory cytokines released from microglia in Alzheimer’s disease. Ann Transl Med 3, 136. [DOI] [PMC free article] [PubMed] [Google Scholar]
- Wang Y, Cella M, Mallinson K, Ulrich JD, Young KL, Robinette ML, Gilfillan S, Krishnan GM, Sudhakar S, Zinselmeyer BH, Holtzman DM, Cirrito JR and Colonna M, 2015b. TREM2 lipid sensing sustains the microglial response in an Alzheimer’s disease model. Cell 160, 1061–71. [DOI] [PMC free article] [PubMed] [Google Scholar]
- Wightman DP, Jansen IE, Savage JE, Shadrin AA, Bahrami S, Holland D, Rongve A, Borte S, Winsvold BS, Drange OK, Martinsen AE, Skogholt AH, Willer C, Brathen G, Bosnes I, Nielsen JB, Fritsche LG, Thomas LF, Pedersen LM, Gabrielsen ME, Johnsen MB, Meisingset TW, Zhou W, Proitsi P, Hodges A, Dobson R, Velayudhan L, Heilbron K, Auton A, and Me Research T, Sealock JM, Davis LK, Pedersen NL, Reynolds CA, Karlsson IK, Magnusson S, Stefansson H, Thordardottir S, Jonsson PV, Snaedal J, Zettergren A, Skoog I, Kern S, Waern M, Zetterberg H, Blennow K, Stordal E, Hveem K, Zwart JA, Athanasiu L, Selnes P, Saltvedt I, Sando SB, Ulstein I, Djurovic S, Fladby T, Aarsland D, Selbaek G, Ripke S, Stefansson K, Andreassen OA and Posthuma D, 2021. A genome-wide association study with 1,126,563 individuals identifies new risk loci for Alzheimer’s disease. Nat Genet 53, 1276–1282. [DOI] [PMC free article] [PubMed] [Google Scholar]
- Zhang C, Wang Y, Wang D, Zhang J and Zhang F, 2018. NSAID Exposure and Risk of Alzheimer’s Disease: An Updated Meta-Analysis From Cohort Studies. Front Aging Neurosci 10, 83. [DOI] [PMC free article] [PubMed] [Google Scholar]
- Zhang X, Tong T, Chang A, Ang TFA, Tao Q, Auerbach S, Devine S, Qiu WQ, Mez J, Massaro J, Lunetta KL, Au R and Farrer LA, 2022. Midlife lipid and glucose levels are associated with Alzheimer’s disease. Alzheimers Dement. [DOI] [PMC free article] [PubMed] [Google Scholar]
- Zhou Y, Song WM, Andhey PS, Swain A, Levy T, Miller KR, Poliani PL, Cominelli M, Grover S, Gilfillan S, Cella M, Ulland TK, Zaitsev K, Miyashita A, Ikeuchi T, Sainouchi M, Kakita A, Bennett DA, Schneider JA, Nichols MR, Beausoleil SA, Ulrich JD, Holtzman DM, Artyomov MN and Colonna M, 2020. Human and mouse single-nucleus transcriptomics reveal TREM2-dependent and TREM2-independent cellular responses in Alzheimer’s disease. Nat Med 26, 131–142. [DOI] [PMC free article] [PubMed] [Google Scholar]
Associated Data
This section collects any data citations, data availability statements, or supplementary materials included in this article.
Supplementary Materials
Data Availability Statement
The datasets generated and/or analyzed during the current study are available in the Gene Expression Omnibus (GEO) repository, GSE65067 and GSE183038.