

Abstract
Background and Aims:
The treatment of hepatocellular carcinoma (HCC) has been transformed by the use of immune checkpoint inhibitors. However, most patients with HCC do not benefit from treatment with immunotherapy. There is an urgent need to understand the mechanisms that underlie response or resistance to immunotherapy for patients with HCC. The use of syngeneic mouse models that closely recapitulate the heterogeneity of human HCC will provide opportunities to examine the complex interactions between cancer cells and nonmalignant cells in the tumor microenvironment.
Approach and Results:
We leverage a multifaceted approach that includes imaging mass cytometry and suspension cytometry by time of flight to profile the tumor microenvironments of the Hep53.4, Hepa 1–6, RIL-175, and TIBx (derivative of TIB-75) syngeneic mouse HCC models. The immune tumor microenvironments vary across these four models, and various immunosuppressive pathways exist at baseline in orthotopic liver tumors derived from these models. For instance, TIBx, which is resistant to anti–programmed cell death protein 1 therapy, contains a high proportion of “M2-like” tumor-associated macrophages with the potential to diminish antitumor immunity. Investigation of The Cancer Genome Atlas reveals that the baseline immunologic profiles of Hep53.4, RIL-175, and TIBx are broadly representative of human HCCs; however, Hepa 1–6 does not recapitulate the immune tumor microenvironment of the vast majority of human HCCs.
Conclusions:
There is a wide diversity in the immune tumor microenvironments in preclinical models and in human HCC, highlighting the need to use multiple syngeneic HCC models to improve the understanding of how to treat HCC through immune modulation.
INTRODUCTION
Hepatocellular carcinoma (HCC) accounts for 90% of all primary liver cancers and is the fourth leading cause of cancer-related deaths worldwide.[1] The immune tumor microenvironment (TME) in HCC is an intense area of research because of the expanding importance of immunotherapy-based treatment strategies for HCC.[2] Advances in the treatment of advanced-stage HCC have recently been achieved through the development of novel immunotherapeutic agents targeting programmed cell death protein 1 (PD-1) and cytotoxic T-lymphocyte associated antigen 4.[3,4] The use of syngeneic mouse models of HCC that form tumors in immunocompetent mouse strains has been instrumental for understanding mechanisms of response to systemic therapy and for testing novel therapeutic strategies that can be translated into human patients. Multiple syngeneic mouse models of HCC are available for use in the study of the interaction between the immune system and HCC. However, there are limited data available to guide choice of model for the study of specific components of the immune TME that may alter response to immune checkpoint inhibitors (ICIs).
In this study, we performed a multifaceted evaluation of the immune TMEs of four widely used orthotopic HCC models. We used imaging mass cytometry (IMC), suspension mass cytometry by time of flight (CyTOF), and immunohistochemistry (IHC) to deeply profile the immune TME and spatial interactions within the broader TME. The models included (1) Hepa 1–6,[5] derived from the BW7756 hepatoma tumor that arose spontaneously in C57L/J mice but commonly used in C57BL/6J mice[6–8]; (2) Hep53.4,[9] a carcinogen-induced HCC cell line syngeneic to C57BL/6J mice; (3) RIL-175,[10] originally isolated from hepatic tumors established in C57BL/6 mice by transfer of TP53−/− fetal hepatoblasts and transduced with HRasv12; and (4) TIBx, a derivative cell line generated through in vivo passaging and clonal expansion of the hepatoblastoma cell line American Type Culture Collection TIB-75 (BNL 1ME A.7R.1) in BALB/c mice. We identify unique immune TMEs in these models and find their sensitivity to anti–PD-1 therapy is correlated with pre-existing immune infiltrates. These data highlight the diverse immune TMEs of orthotopic, syngeneic mouse HCC models and can be used to guide preclinical model selection and identify potential TME determinants of response to anti–PD-1 therapy in HCC.
EXPERIMENTAL PROCEDURES
Cell culture
Hepa 1–6 was maintained in Dulbecco’s Modified Eagle Medium (DMEM) (Thermo Fisher Scientific 11965092) supplemented with 10% fetal bovine serum (FBS) (Gemini 100–106) and 1% penicillin–streptomycin (P/S) (Thermo Fisher Scientific 15070063). Hep53.4 was maintained in DMEM supplemented with 2 mm L-glutamine (Thermo Fisher Scientific 25030081), 10% FBS, and 1% P/S. RIL-175 was maintained in DMEM supplemented with 10% FBS, 1 mm sodium pyruvate (Sigma Aldrich S8636), 1% nonessential amino acids (NEAA) (Thermo Fisher Scientific 11140050), and 1% P/S. TIBx was maintained in DMEM supplemented with 10% FBS, 2 mm L-glutamine, 1% NEAA, and 100 mm hydroxyl piperazine ethanesulfonic acid (HEPES) (Thermo Fisher Scientific 15630080). Cells were maintained at 37°C with 10% CO2 and confirmed to be free of mycoplasma prior to experiments (Johns Hopkins Genetic Resources Core Facility).
Animals
For studies using Hepa 1–6, RIL-175, and Hep53.4, female C57Bl/6J mice and, for studies using TIBx, female Balb/C mice at 6–8 weeks old were purchased from Jackson Laboratories and maintained in accordance with the Institutional Animal Care and Use Committee guidelines. Mice were fed a standard diet, not fasted prior to the initiation of an experiment or an assessment, and interventions were performed during the light cycle.
Orthotopic liver injections, anti–PD-1 treatment, and immune cell depletion
A total of 1 × 10⁶ cells in 40 μl of a Matrigel (Corning) and phosphate-buffered saline (PBS) mixture per mouse were injected orthotopically into the livers of appropriately matched, 6–8-week-old mice as previously described (Supporting Methods).[11] For CyTOF and IMC, tumors were collected at day 14 and processed for downstream applications. For survival experiments, mice were treated with intraperitoneal injections of either 0.2 mg/mouse anti-mouse PD-1 (CD279) (BioXCell BE0146) or rat IgG2a,κ isotype control (BioXCell BE0089) twice weekly starting at day 7. For in vivo CD8+ T cell or CD20+ cell depletion, mice were treated with anti-mouse PD-1 and 250 μg of either anti-CD8a (BioXCell BE0117) or rat IgG2b,k isotype control (BioXCell BE0090) or either anti-CD20 (BioXCell BE0356) or mouse IgG2c,κ isotype control (BioXCell BE0366) for 3 consecutive days prior to orthotopic injections followed by twice weekly. Depletion was assessed by flow cytometry (Supporting Methods). Surviving mice were euthanized, and necropsy was performed at the end of the experiment.
Subcutaneous tumor measurements and treatment with anti–PD-1 monoclonal antibodies
A total of 1 × 10⁶ cells were inoculated into the lower left flank of 6–8-week-old mice. Starting at day 7, mice were treated with intraperitoneal injections of anti-mouse PD-1 or isotype control. Tumor length (major axis) and width were assessed three times weekly using calipers. Volume was calculated as (major axis × minor axis2) / 2 and assessed until tumors reached 20 × 20 mm or at the time euthanasia or death of the first mouse for each cell.
Histology and conventional IHC
Orthotopic tumors were formalin-fixed and paraffin-embedded, and representative slides were sectioned and stained with hematoxylin and eosin following standard procedures by the Johns Hopkins University Oncology Tissue Services. IHC was performed by HistoWiz Inc. using a Standard Operating Procedure and fully automated workflow (Supporting Methods).
Antibodies for cytometry
IMC and CyTOF antibodies, clones, metal isotopes, and their titrations are listed in Tables S1 and S2, respectively. See Supporting Methods.
IMC data acquisition
Slides made from formalin-fixed paraffin-embedded (FFPE) sections of orthotopic liver tumors were processed as previously described for IMC[3] (Supporting Methods). Images were acquired using a Hyperion Imaging System (Fluidigm) at Johns Hopkins Flow/Mass Cytometry Facility.
IMC data analysis
Images were segmented into a single-cell dataset using the publicly available software pipeline[12] based on CellProfiler,[13] ilastik,[14] and HistoCAT.[15] Data from the representative images for each tumor type was combined to obtain the mean shortest distances among all of the different cell types, and a distance matrix was created. A network visualization of each of the distance matrix for the four tumor types was generated using the qgraph package in R.[16] In addition, HistoCAT-generated neighbor data were used to summarize the top three neighboring cell types for every cell type (Supporting Methods). Raw data has been deposited and is accessible at https://doi.org/10.5281/zenodo.7013087.
Tumor dissociation, CyTOF staining, and processing
For downstream CyTOF analysis, orthotopic liver tumors were enzymatically dissociated using a Tumor Dissociation Kit (Miltenyi) per manufacturer instructions and as previously described.[17] Cells were then stained with a cocktail of surface marker antibodies (Table S2) as previously described[18] (Supporting Methods).
CyTOF analysis
A customized computational pipeline based on diffcyt[19] was employed using R v3.6.2. For unsupervised clustering, FlowSOM algorithm[20] was used to identify 60 metaclusters that were then annotated into 19 final cell subtypes based on expression profiles (Table S3). Clustering was visualized using a two-dimensional uniform manifold approximation and projection dimensionality reduction algorithm.[21] A total of 2000 cells per sample were used for visualization. Raw data has been deposited and is accessible at http://flowrepository.org/id/FR-FCM-Z5NZ.
The Cancer Genome Atlas analysis
Analysis was performed using R/Bioconductor (v4.1.0) with build-in packages and custom routines. To predict which liver hepatocellular carcinoma (LIHC) samples (n = 371) have an infiltrating immune cell profile similar to mouse models, CIBERSORT-predicted cell proportions from Thorsson et al. were analyzed.[22] Prediction was performed using projectR package [v1.10].[23] To enable projection from mouse to human samples, the following steps were performed: (a) create common clusters by mapping cell types between datasets; (b) aggregate cell proportions; (c) convert cell proportions into ranks. Ten common clusters were created between CyTOF and CIBERSORT data (Table S4) For both the CyTOF-based mouse model and The Cancer Gemone Atlas (TCGA) LIHC datasets, proportions of immune cells were summed for clusters that were mapped to the same common cluster (e.g., common B cell cluster contains two CIBERSORT clusters: B.cells.naive and B.cells.memory). To leverage the high-fidelity immune dataset obtained by single-cell proteomic analysis (i.e., CyTOF) and enable the projection across the disparate data modalities (i.e., from CyTOF to RNAseq-based CIBERSORT dataset), we converted the datasets into rank-based profiles. The four mouse profiles were projected onto TCGA samples. After projection, each LIHC sample was assigned to one of four mouse clusters by the maximum projection value, and groups were correlated with available clinical information (Table S5). See Supporting Methods for additional details.
Statistical analyses
Unless noted above, data were analyzed using GraphPad Prism version 9. Differential analysis of IMC and CyTOF data was performed using one-way analysis of variance (ANOVA) followed by pairwise testing, and p values were adjusted for the false discovery rate. For comparisons of infiltrating immune cells as determined by IHC, groups were compared using two-tailed, independent sample Student’s t tests. For comparison of tumor growth curves in anti–PD-1 versus isotype control-treated mice, two-way ANOVA testing was performed. Pearson’s χ2 testing was used for analysis of clinical and demographic variables from TCGA assigned to mouse model immune profiles. Statistical significance was considered for p < 0.05.
RESULTS
Syngeneic models of HCC have highly distinct immune TMEs
To evaluate immune TMEs of cell line models of HCC, we performed orthotopic injections of the Hep53.4, Hepa 1–6, RIL-175, and TIBx cell lines. Tumors were collected 14 days postinjection, and IMC with a panel of 32 markers was conducted using FFPE tumor sections. Unique patterns of infiltrating immune cell populations as defined by clustering analysis were identified in the resulting multiplex images across the four HCC models (Figure S1). Notably, Hepa 1–6 tumors were highly infiltrated CD4+, CD8+, and FoxP3+ T cells, as well as tumor-associated macrophages (TAMs) represented by F4/80+ cells (Figure 1A, Figure S2). In addition, we identified the presence of tertiary lymphoid structures, composed of B220+, CD8+, and CD4+ cells in Hepa 1–6 tumors (Figure 1A), which are correlated with improved prognosis in human HCC.[24] In contrast, TIBx tumors contained large numbers of TAMs and relatively few T cells (Figure 1A, Figure S2).
FIGURE 1.
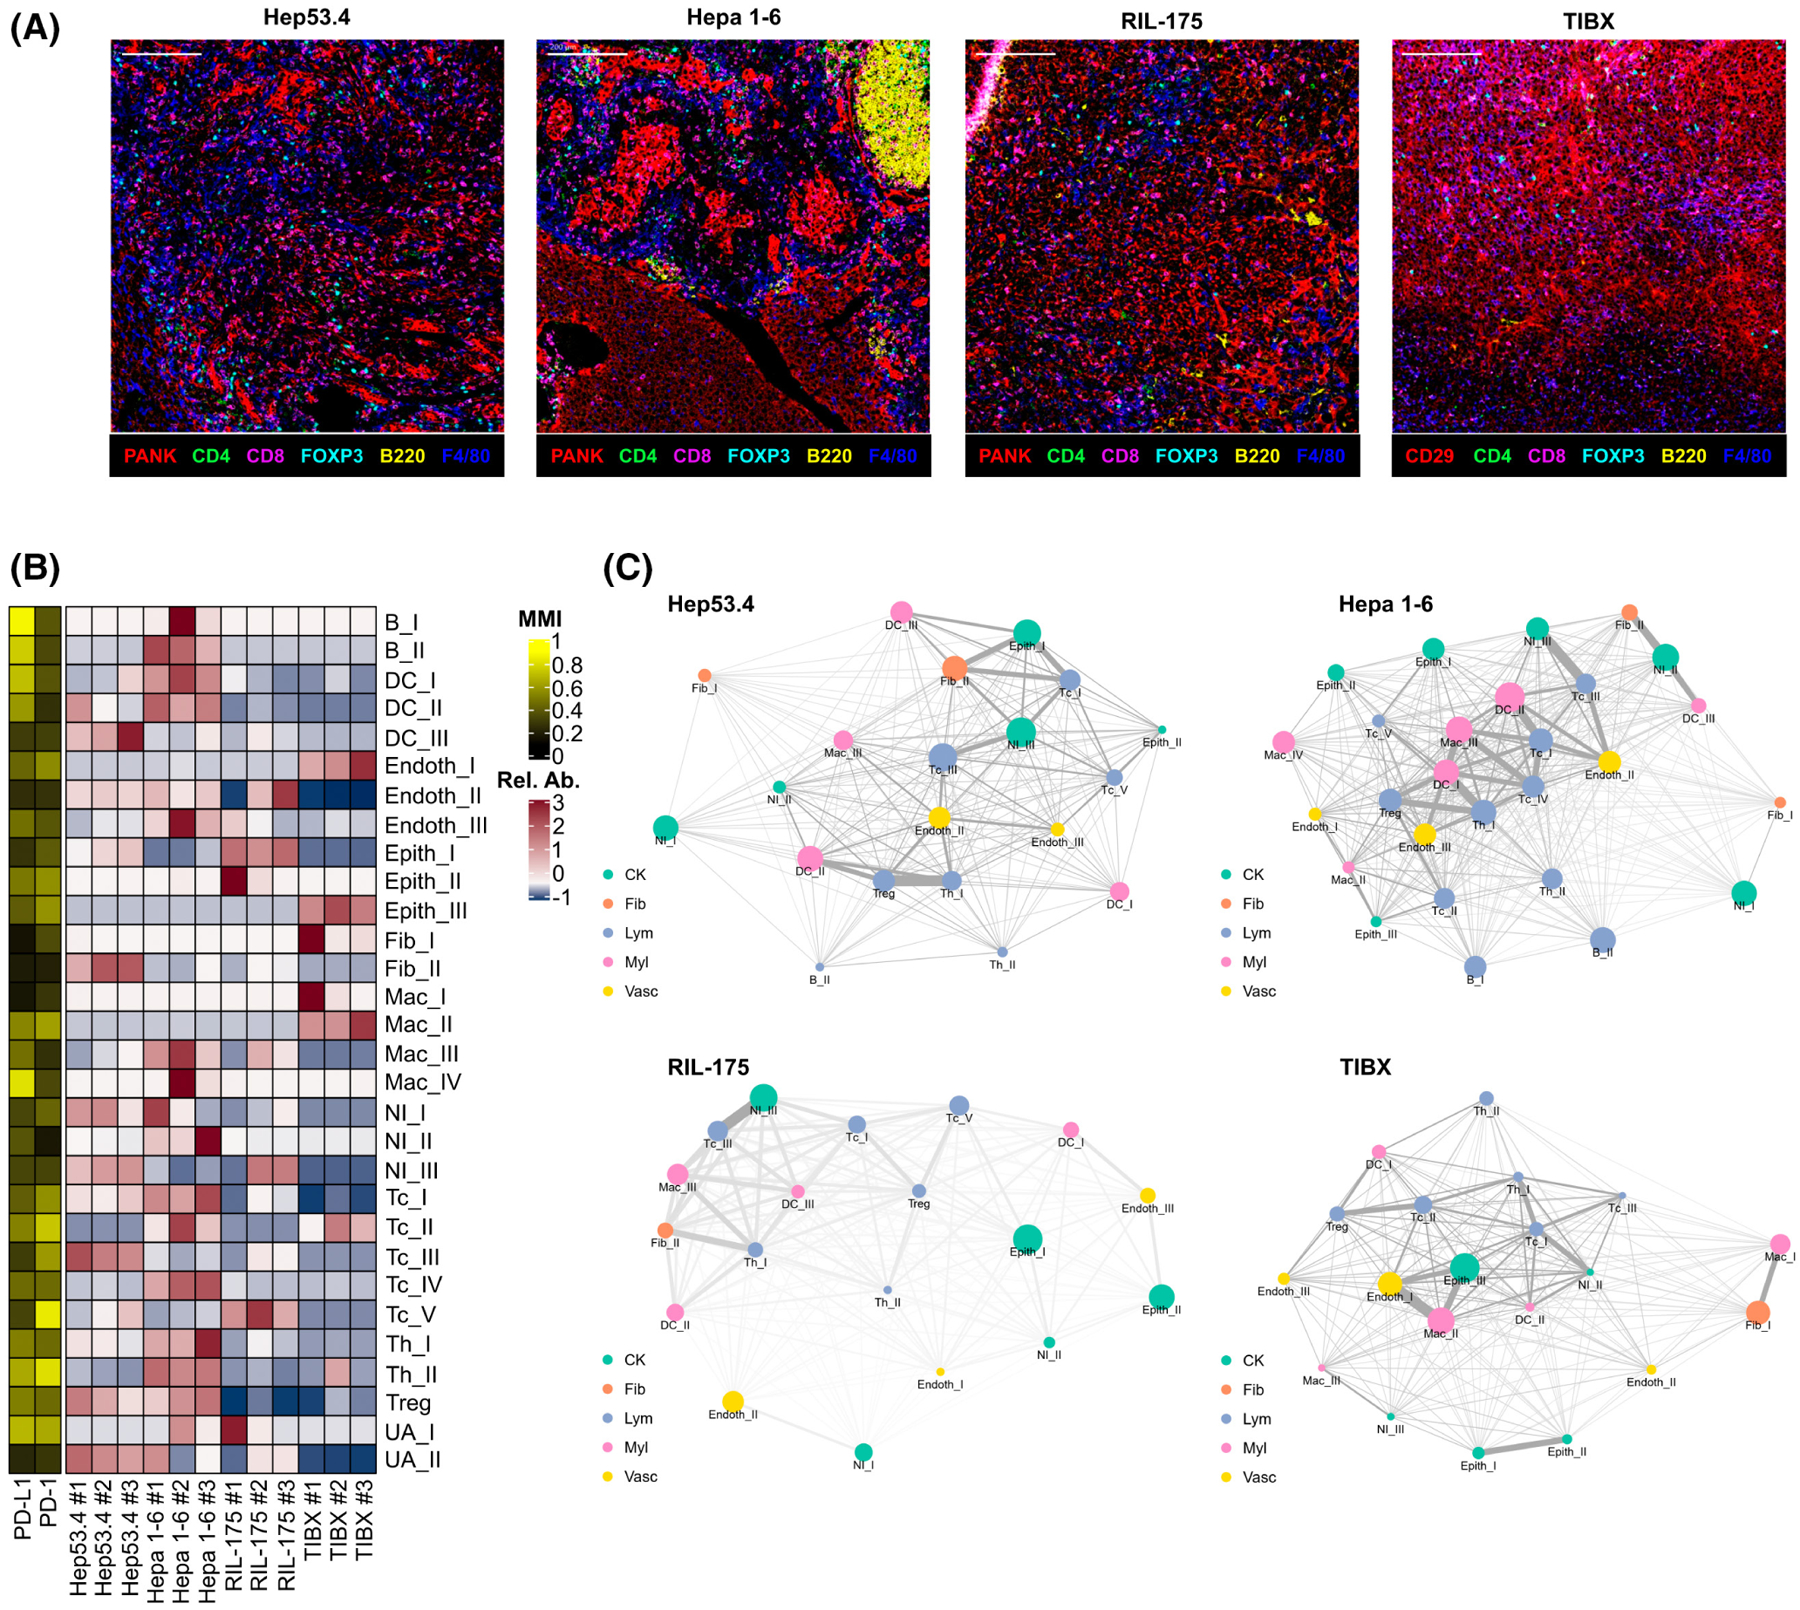
Tumor-infiltrating immune cells and their spatial relationships differ among mouse models of hepatocellular carcinoma (HCC). (A) Representative multicolor images from imaging mass cytometry (IMC) for orthotropic Hep53.4, Hepa 1–6, RIL-175, and TIBx tumors (one mouse from each cell line selected for representation; scale bar = 200 μm). (B) Heatmap showing relative abundance (Rel. Ab.) of 30 final annotated clusters and mean metal intensity (MMI) for programmed death-ligand 1 (PD-L1) and programmed cell death protein 1 (PD-1) from orthotopic liver tumors (n = 3 from each cell line; n = 113,628 cells in total). (C) Distance relationship network visualizations of IMC data from orthotopic liver tumors for each of the four HCC models. Colors represent broad category of clusters (CK, cytokeratin+ epithelial cluster, fib, fibroblast cluster, Lym, lymphocyte cluster, Myl, myeloid cell cluster, Vasc, endothelial cell cluster). Node sizes are proportional to the relative abundance of the indicated cell type, and thicker edges indicate closer cell type interactions based on distance.
Clustering analysis was performed to further subtype the infiltrating immune and nonimmune cell populations. Hepa 1–6 tumors were heavily infiltrated by immune cells such as cytotoxic T cells (Tc), helper T cells (Th), B cells, dendritic cells (DCs), and CD206−TAMs (Mac_III, Mac_IV) (Figure 1B, Figure S3). Hep53.4 tumors contained abundant Tc, Th, and DC cells but few TAMs (Figure 1B). In contrast, there were few Tc, Th, and DC cells in RIL-175 and TIBx tumors, with the exception of PD-1+ Tc cells (Tc_II) in TIBx tumors (Figure 1B).
Spatial analysis identifies increased DC and T cell interactions in Hepa 1–6 and Hep53.4 tumors
We generated distance relationship network visualizations from our cluster annotated IMC datasets to examine the spatial composition of the infiltrating immune cells across the HCC models. Both Hep53.4 and Hepa 1–6 tumors showed areas of rich interaction among multiple T cell subsets as well as DCs (Figure 1C, Figure S4A,B). These interactions between effector T cells and antigen-presenting cells may indicate greater immune recognition of Hep53.4 and Hepa 1–6 tumors compared with RIL-175 and TIBx.[25] Additionally, Hepa 1–6 tumors had close interactions between CD206− (Mac_III) TAMs and Tcs (Tc_IV). Given our clustering analysis identified Mac_III cells as proinflammatory “M1-like” in phenotype, this could be indicative of a primed antitumor immune response in Hepa 1–6 tumors. In contrast, TIBx tumors contained a high abundance of anti-inflammatory “M2-like” TAMs (CD206+; Mac_II) that had closer interactions to effector T cells than the other models (Figure 1C, Figure S4D).
Given the importance of cancer-associated fibroblasts (CAFs) in HCC,[26] we next defined interactions among immune cells and fibroblast populations in the HCC models. One fibroblast population (Fib_II) defined by strong α-smooth muscle actin (α-SMA) positivity was of particular interest given α-SMA+ CAFs are associated with decreased antitumor immunity through release of cytokines such as IL-6, IL-8, and transforming growth factor-β.[27] α-SMA+ CAFs neighbored T cells most closely in the Hepa 1–6 and RIL-175 tumors (Figure 1C), with the highest abundance found in Hep53.4 tumors (Figure S2). Overall, these results provide evidence of nonimmune cell–derived immunosuppressive cell populations and pathways present in these tumors can potentially reduce the efficacy of immune checkpoint inhibition.
We also performed IHC to validate the presence of CD8+ T cells, B cells, and programmed death-ligand 1 (PD-L1) expression in larger sections of each tumor model. IHC recapitulated key findings from the IMC data (Figure 2A, Table S6). Hepa 1–6 tumors contained significantly more CD8+ T cells than RIL-175 and TIBx (Figure 2B), and TIBx had fewer infiltrating CD8+ T cells than the other models. B cell infiltration was highest in Hepa 1–6 tumors, and TIBx tumors had the fewest infiltrating B cells. Finally, PD-L1 expression was highest in Hepa 1–6. High PD-L1 expression in the HCC TME is associated with response to anti–PD-1/PD-L1 therapy, although evidence exists showing increased PD-L1 expression on cancer cells themselves may not be predictive of response to ICIs.[28] Cross-referencing the IMC analysis, we found that macrophages subtypes rather than nonimmune cells were the predominant sources of PD-L1 expression in the TME across the models (Figure S1).
FIGURE 2.

Analysis of tumor-infiltrating immune cell populations by IHC in orthotopic mouse cell line models of HCC. (A) Representative images from the four cell line models (rows) showing staining by hematoxylin and eosin (H&E) and for CD8, B220, and programmed death-ligand 1 (PD-L1) in orthotopic tumors (scale bar = 200 μm). (B) Quantification of CD8+ (left), B220+ (middle), and PD-L1+ (right) cells per high powered field at 10× magnification presented as average ± SD. Five randomly selected fields were selected per marker for each cell line. Images were analyzed using halo image analysis software (Indica Laboratories). *p < 0.05, **p < 0.01, ***p < 0.001, ****p < 0.0001 for comparisons by unpaired t tests.
HCC models have unique tumor-infiltrating lymphoid and myeloid populations with variable degrees of PD-1 and PD-L1 expression
Although our IMC-based analyses identified unique compositions of infiltrating immune cell populations across the four cell line models, these analyses may be limited by sampling bias in that IMC is not necessarily reflective of cell populations across an entire tumor. Therefore, we performed CyTOF on single-cell suspensions from Hep53.4, Hepa 1–6, RIL-175, and TIBx orthotopic tumors. A 27-marker panel (Figure S5A) was used to further subtype the T cell populations into double negative, CD4+ naïve, CD4+ effector memory (ThEM), CD8+ naïve (TcN), CD8+ effector memory (TcEM), and two populations of regulatory T cells (Tregs) (Treg_I; killer cell lectin-like receptor G1 (KLRG1)− and Treg_II; KLRG1+) (Figure 3A, Figure S5B).
FIGURE 3.

Composition of tumor-infiltrating lymphoid and myeloid cell subsets in orthotopic hepatocellular carcinoma mouse models. (A) Abundance of each annotated lymphoid cell cluster as the percentage of total cells as defined by cytometry by time of flight (CyTOF) analysis in each orthotopic liver tumor (n ≥ 3 for each cell line model, N = 154,441 total number of lymphoid cells analyzed). (B) Metal intensities of PD-1 in lymphoid cell clusters from orthotopic liver tumors across cell line models. (C) Abundance of each annotated myeloid cell cluster as the percentage of total cells as defined by CyTOF analysis in each orthotopic liver tumor (n ≥ 3 for each cell line model, N = 241,784 total number of myeloid cells analyzed). (D) Metal intensities of programmed death-ligand 1 (PD-L1) in myeloid cell clusters from orthotopic liver tumors across cell line models (flase discovery rate-adjusted p values *p < 0.05, **p < 0.01, ***p < 0.001 for [B] and [D]). DC, dendritic cell; DNT, double negative T cell; GMDSC, granulocytic myeloid-derived suppressor cell; MMDSC, monocytic myeloid-derived suppressor cell; TcEM, CD8+ effector memory cell; TcN, CD8+ naïve T cell; ThEM, CD4+ effector memory cell; ThN, CD4+ naïve T cell; Treg, regulatory T cell.
Hepa 1–6 tumors showed the greatest T cell infiltration of all models in terms of absolute number of infiltrating cells, and CyTOF analysis demonstrates the lymphoid compartment is quite diverse among the CD4+ and CD8+ T cell subtypes (Figure 3A). In contrast, TIBx is consistent with an immune-resistant tumor profile based on a low percentage of CD8+ T cells and a high percentage of Tregs, particularly KLRG+ Tregs, which represent a highly activated Tregs.[29] We next examined PD-1 expression across the T cell subsets in our model systems. We observed that most T cells in Hep53.4 tumors have the lowest expression of PD-1, with a notable exception of ThEM cells expressing the least PD-1 in the Hepa 1–6 model (Figure 3B). T cells from TIBx exhibited the highest PD-1 expression, a finding correlated with tumor immune escape.[30] However, CD8+ T cells in both Hep53.4 and RIL-175 are more likely to be “inactive” as defined by low expression of Ki-67 and granzyme B (TcN and TcEM clusters) (Figure S6A). As illustrated by the IMC data, these T cell populations in Hep53.4 and RIL-175 are in close proximity to potentially immunosuppressive α-SMA+ CAFs (Figure 1C).
Differences in the myeloid cell infiltrate were also identified using CyTOF-based subtyping. Hepa 1–6 tumors showed relatively high infiltration of M1-like TAMs, few M2-like TAMs, and few monocytic myeloid-derived suppressor cells (M-MDSCs) and granulocytic myeloid-derived suppressor cells (G-MDSCs) (Figure 3C). This is consistent with an antitumor skewed immune TME, as M1-like TAMs can play a role in promoting antitumor immunity in HCC.[31] Hep53.4 and RIL-175 tumors had myeloid compartment compositions similar to each other when accounting for variability in the G-MDSC and M-MDSC prevalence across biologic replicates. Strikingly, the myeloid cell infiltrate in TIBx tumors was composed of many M2-like TAMs, G-MDSCs, and M-MDSCs with few M1-like TAMs (Figure 3C), consistent with IMC data that showed a high proportion of M2-like TAMs near putative effector immune cell populations (Figure 1C). Across the four models, macrophage-specific PD-L1 expression was the highest in Hepa 1–6 and RIL-175 models (Figure 3D).
Response to anti–PD-1 monoclonal antibody therapy differs among mouse models of HCC and is associated with an immune infiltrated TME prior to therapy initiation
To determine how the four models differ in their response to anti–PD-1 antibody therapy, we performed orthotopic liver injections for each syngeneic model. Mice received either anti–PD-1 antibody or isotype control antibody, and survival was measured (Figure 4A). Anti–PD-1 responsiveness differed across the models. Mice with TIBx tumors had no survival advantage with anti–PD-1, whereas other models showed varying degrees of anti–PD-1 responsiveness. Anti–PD-1 was most effective in the Hep53.4 model in which median survival significantly increased in anti–PD-1–treated compared to control. Anti–PD-1 did not alter median survival in RIL-175; however, a tail in the survival curve emerged in anti–PD-1–treated mice, suggesting that a subset of mice effectively controlled their tumor burden. Indeed, at 8 weeks, three surviving mice all had evidence of prior orthotopic injection, but two of the three had no tumor burden upon visual inspection (Table S7). Interestingly, mice injected with Hepa 1–6 experienced no mortality over the course of 8 weeks in both the anti–PD-1– and control-treated groups. This is in line with our IMC and CyTOF data showing robust immunes response elicited by the Hepa 1–6 model even in the absence of immune checkpoint inhibition. However, there was evidence of anti–PD-1 treatment effect in the orthotopic Hepa 1–6 model, as there were no visible tumors in the anti–PD-1–treated mice, whereas 20% of control-treated mice had tumor burden at 8 weeks (Table S7).
FIGURE 4.
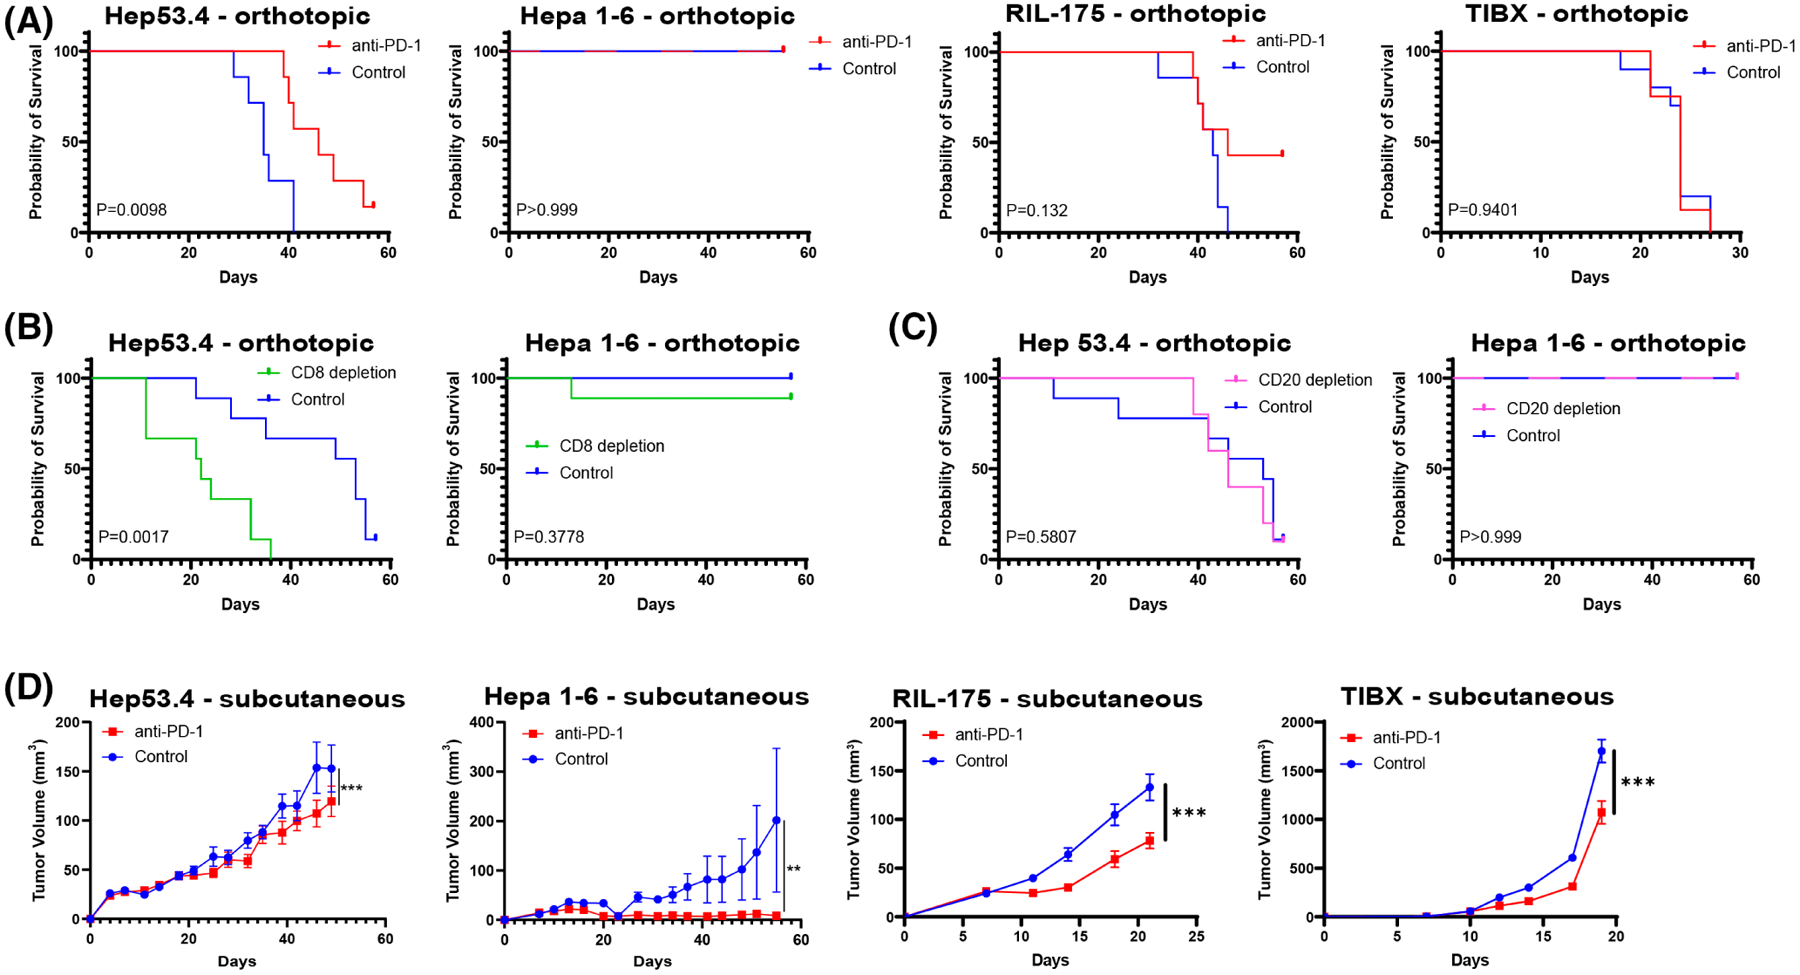
In vivo efficacy of anti–PD-1 therapy differs among hepatocellular carcinoma cell line models. (A) Kaplan–Meier survival curves for mice with orthotopic tumors treated with anti–programmed cell death protein 1(PD-1) or isotype control for hep 53.4 (n = 7 per group), Hepa 1–6 (n = 10 per group), RIL-175 (n = 7 per group), and TIBx (n = 10 per group). (B) Kaplan–Meier survival curves for mice with orthotopic tumors treated with anti-CD8a or isotype control for Hep53.4 (n = 9 per group) or Hepa 1–6 (n = 9 anti-CD8a group, n = 7 control group). (C) Kaplan–Meier survival curves for mice with orthotopic tumors treated with anti-CD20 or isotype control for Hep53.4 (n = 10 anti-CD20 group, n = 9 control group) or Hepa 1–6 (n = 9 anti-CD20 group, n = 10 control group). Log-rank p value for a comparison between experimental and control-treated groups indicated on each plot in (A)–(C). (D) Subcutaneous tumor volume curves comparing treatment with anti–PD-1 or isotype control for Hep53.4 (n = 7 control group, n = 8 anti–PD-1 group), Hepa 1–6 (n = 10 per group), RIL-175 (n = 10 per group), and TIBx (n = 10 per group). Error bars = SEM; *p < 0.05, **p < 0.01, ***p < 0.001.
Hep53.4 was responsive to anti-PD-1 in the orthotopic injection model, and it contained a high proportion of tumor-constraining cells (CD8+ T cells, M1-like TAMs) with moderate expression of PD-L1 (Figures 2B and 3D). Conversely, the limited response to anti–PD-1 in TIBx tumors was consistent with the infiltration of tumor-promoting immune cells (M2-like TAMs) and relatively low PD-L1 expression (Figures 2B and 3D). Survival advantage with anti–PD-1 correlated with increasing infiltration of B220+ cells, CD8+ cells, and PD-L1+ cells, with the notable exception of Hepa 1–6, in which survival was 100% in both the treatment and control groups (Figure 2B). Although we observed responses to anti–PD-1, the majority of mice did not experience complete responses in the Hep53.4, RIL-175, and TIBx models. Our CyTOF and IMC analyses highlight multiple immunosuppressive pathways present at baseline in each syngeneic model, notably the presence of potentially immunosuppressive α-SMA+ CAFs in close proximity to effector immune cells in the Hep53.4 and RIL-175 models (Figure 1B), providing rationale for targeting other immune and stromal pathways in additional to the PD-1/PD-L1 axis in preclinical models of HCC.
We sought to more discretely test if specific immune cell populations present in tumors before treatment with anti–PD-1 are involved as mediators of therapy response. We examined the effects of CD8+ T cell depletion in combination with anti–PD-1 therapy on survival in orthotopic liver injections of both Hep53.4 and Hepa 1–6. Depletion of CD8+ T cells in the Hep53.4 model resulted in the loss of survival benefit for anti–PD-1 (Figure 4B, Figure S7). In contrast, despite a high proportion of CD8+ T cells present in Hepa1-6 tumors at baseline, anti–PD-1 treatment and depletion of CD8+ T cells did not significantly reduce survival in this model (Figure 4B). However, at the end of the experiment, 30% of mice orthotopically injected with Hepa1-6 cells (compared with 0% of control-treated mice) had measurable tumor burden which was similar to mice that did not receive anti–PD-1 (Table S7). These data suggest that the action of effector T cells may help control Hepa 1–6 tumors but that there are other cell populations present that constrain tumor growth and preserve survival despite tumor cell injection.
Given the abundant B cell infiltrate in Hepa 1–6 tumors, we also examined the impact of B cell depletion using an anti-CD20 antibody in combination with anti–PD-1. Although different subpopulations of tumor-infiltrating B cells may have opposing effects on antitumor immunity, we hypothesized that B cells in Hepa 1–6 tumors may serve as antigen-presenting cells and aid antitumor immunity.[32] However, we found no difference in survival between anti-CD20 and isotype control-treated groups in the Hepa 1–6 or Hep53.4 groups (Figure 4C, Figure S7). There was also no evidence of tumor in surviving Hepa1-6 tumor-bearing mice treated with anti-CD20 at the end of the experiment (Table S7).
In addition to orthotopic injection of the four HCC models, we performed subcutaneous inoculation of tumor cells into the flanks of mice. This enabled longitudinal monitoring of tumor growth for robust therapy efficacy comparisons. The findings are largely consistent with our orthotopic survival data in that the effect of anti–PD-1, although statistically significant, is overall limited in these models with the exception of Hepa 1–6 (Figure 4D). In the subcutaneous model, Hepa 1–6 showed the greatest degree of tumor reduction with anti–PD-1 treatment. As described above, there were high rates of complete tumor clearance in the orthotopic Hepa 1–6 model and high variability in growth among anti–PD-1–treated mice in the subcutaneous Hepa1-6 model. In fact, tumors took longer to establish and experience sustained growth (around day 40) than other cell line models even in the absence of anti–PD-1 treatment. In contrast, control-treated TIBx tumors began to experience rapid growth by day 14, and anti–PD-1 treatment only modestly delayed the growth of these subcutaneous tumors. Anti–PD-1 treatment reduced Hep53.4 and RIL-175 subcutaneous tumor growth, but the extent of the therapeutic benefit was limited. Overall, these findings correlate with the model-specific immunological profiles defined in the IMC and CyTOF datasets.
Syngeneic mouse models of HCC reflect distinctive subsets of human HCC
Using our deep immune profiling of preclinical HCC models and publicly available data from human HCCs, we sought to determine whether any of the models mimicked the immune profiles of subsets of human disease. We leveraged RNA sequencing (RNA-seq) data from the LIHC TCGA cohort (n = 371) to identify common immune cell populations defined by CIBERSORT, an analysis tool that provides estimates of the abundances of cell types in a mixed cell population from bulk RNA-seq data.[33] We looked at how these immune profiles correlate with the immune profiles determined by CyTOF in orthotopic liver tumors (Table S3).
To facilitate comparisons between mouse models and human tumor samples, we created an infiltrating immune cell profile using our CyTOF dataset for each of the mouse models by averaging cell population proportions within each model and then converted these values to ranks across the four models. We converted the TCGA CIBERSORT values into ranks and assigned each HCC TCGA sample to one of four mouse model clusters using the maximum projection value (Figure 5A). This analysis revealed that the tumor immune profiles of most TCGA tumors were split among the Hep53.4 (124 samples), RIL-175 (109 samples), and TIBx (123 samples), and few samples, notable for marked B cell infiltration, had profiles that most closely matched the Hepa 1–6 profile (15 samples) (Figure 5B).
FIGURE 5.

Human hepatocellular carcinoma (HCC) tumor immune microenvironment can be represented by mouse models of HCC. (A) Ranks of proportions of CIBERSORT data from individual tumors from the HCC (LIHC) The Cancer Genome Atlas (TCGA) dataset. Each column represents an individual tumor sample (n = 371) with ranks assigned to the 10 cell type clusters shared between both CIBERSORT and cytometry by time of flight data. (B) Individual human HCC tumor samples were then assigned to one of four mouse model profiles by maximum projection value. (C) Demographic and clinical variables presented as proportion of tumors within each mouse model profile from the LIHC TCGA dataset. The p values for Pearson’s χ2 test reported for each panel with the exception of age at diagnosis where multiple unpaired t tests were used; ***p < 0.001. DC, dendritic cell; N/A, not applicable; ThEM, CD4+ effector memory cell; Treg, regulatory T cell.
We next examined differences in clinical or demographic variables among human tumor samples assigned to the mouse immune profiles. Sex, race, stage at diagnosis, tumor grade, and overall survival did not significantly differ in the human tumor samples assigned across the mouse immune profiles (Figure 5C). There was a clinically insignificant difference in age at diagnosis when comparing the TIBx and RIL-175 profiles. We next examined if the assigned immune profiles correlated with any of the three “integrated iCluster solutions” defined by specific sets of somatic mutations in the TCGA study.[34] Aside from the limited number of samples assigned to Hepa 1–6 all falling within iCluster 1, there was not a clear link between a mouse immune profile and specific iClusters (Figure S8A). In addition, the somatic mutation burden across the 26 defined “significantly mutated genes” from the TCGA study appeared similar among samples in each of the four mouse profiles (Figure S8B).
We also examined if certain mouse profiles were correlated with hepatitis B virus (HBV) and hepatitis C virus (HCV) infection status for the tumor samples from the TCGA for which there was patient-level viral infection data (n = 196). We found the TIBx profile group was significantly enriched with samples from patients known viral infection (Figure 5C). Understanding the implications of this immune TME profile for HCCs of viral etiology will require further study.
DISCUSSION
In this study, we offer an integrated view of the TME features of commonly used mouse HCC cell line models and response to anti–PD-1 (Table 1). Our results show that different syngeneic models recapitulate the diversity of human HCC, such as high M2 infiltration in the TIBx model and robust CD4+ T cell infiltration in the Hep53.4 model. The choice of HCC syngeneic model can be guided by which cell populations are subject to investigation.
TABLE 1.
Summary of key findings from anti-PD-1 therapy, tumor microenvironment profiling, and correlation to TCGA samples for four syngeneic mouse HCC tumor models
| Cell line model | TIBx | RIL-175 | Hep53.4 | Hepa1-6 |
|---|---|---|---|---|
| Anti–PD-1 response in orthotopic injection model | Resistant | Slightly responsive | Responsive | Tumor-clearing |
| Tumor immune microenvironment features | High “M2-like” macrophage infiltration. Low CD8 T cell infiltration. Increased Treg infiltration | Increased DC infiltration. High percentage of T cells with an inactive phenotype | High CD8 T cell infiltration. Majority of T cells have an inactive phenotype. High proportion of α-SMA+ CAFs | High CD8 T cell infiltration. High “M1-like” macrophage infiltration. Low MDSC infiltration |
| Correlation to human HCC samples | Higher proportion of HCC with viral etiology | Not representative of human HCC tumor immune microenvironment |
Abbreviations: CAF, cancer-associated fibroblast; DC, dendritic cell; HCC, hepatocellular carcinoma; MDSC, myeloid-derived suppressor cell; PD-1, programmed cell death protein 1; α-SMA, α-smooth muscle actin.
A consistent finding is that the Hepa 1–6 model in C57Bl/6J mice elicits robust immune response characterized by an eruptive T and B cell infiltration. Even though the Hepa 1–6 model in C57Bl/6 mice is among the most widely used for preclinical studies, Hepa 1–6 cells are syngeneic to C57/L mice. These two strains of mice have a minor MHC haplotype difference (H2b for C57Bl/6 and H2bc for C57/L), and prior experiments have shown that transplantation of cells from mice of one of these haplotypes into mice of the other can induce an alloreactive response.[35] To this point, our analyses identified immune clusters in Hepa 1–6 that incorporate B cells with rich spatial interactions with DCs, often seen in cases of allorejection.[36] Hepa 1–6 tumors are sensitive to anti–PD-1, which may be a function of the immune TME shaped by an HLA mismatch. Few human HCC samples had a similar composition of infiltrating immune cells to Hepa 1–6, further highlighting this model is not robustly representative of human HCC. Together these data indicate the potential for misleading preclinical results when Hepa is used in C57Bl/6 J mice for investigation of immunotherapies.
Hep53.4, RIL-175, and TIBx were all more representative of human HCC in our analyses. We show that key immunosuppressive pathways are pre-established in these models, which has important implications for the efficacy of anti–PD-1 monotherapy. For instance, we noted that a higher percentage of “inactive” T cells in Hep53.4 and RIL-175 tumors. Compared with RIL-175, Hep53.4 has greater overall T cell infiltration and PD-L1 expression, but both models demonstrated limited overall responses to anti–PD-1 therapy as evidenced by eventual progression of tumors in most treated mice. Other immunosuppressive cell populations present at baseline, including α-SMA+ CAFs, are important to consider in explaining this result. T cells in the Hep53.4 model are in close proximity to a high number of α-SMA+ CAFs. In contrast, T cells in RIL-175 are in in close proximity to these CAFs, but there are significantly fewer α-SMA+ CAFs in the TME. We believe it provides rationale for future work to mechanistically evaluate the actions of this CAF population in these two models.
We also describe the immune TME of TIBx tumors and show they contain a high proportion of M2-like TAMs. This finding may make the TIBx model particularly suited to the study of the emerging role of targeting M2-like TAMs as an adjunct to ICI therapy for patients with HCC.[37] Although the immunologic profiles projected onto TCGA data did not predict for differences in overall survival in patients, the TCGA cohort was not selected to only include patients who received ICI therapy. Nonetheless, profiling of the TME at a patient level may help inform rational combination therapy approaches.
One of the limitations of our study is that our models are not fully capable of recapitulating the wide spectrum of genetic and biological aspects of human HCC. Whereas approximately 90% of HCCs arise in the setting of cirrhosis secondary to HBV/HCV infection, alcohol, and NASH,[38] we evaluated orthotopic HCC models in the context of a normal liver. Recent preclinical research shows that etiology may affect the tumor immune microenvironment and response to systemic immunotherapy,[39,40] and further work is needed to explore the contributions of liver disease to immune infiltration and therapy response within the context of the orthotopic models described here. For example, although the TIBx model had an immune profile similar to a group of TCGA samples that was enriched for patients with a background of HBV and/or HCV infection, this model cannot recapitulate the effects of background viral infection on tumor development in vivo. There are a variety of strategies used to induce HCC in mice, involving genetic manipulation, mutagenic agents, and the use of immunologically humanized mice implanted with human HCC tumor cells that can complement the models used in our study.[41]
Strengths of this work include the use of deep and spatially preserved multiomic profiling of multiple preclinical models in parallel and the projection of these data to human data to understand the use of each model in representing the total diversity of human HCC. The concordance between the density of tumor-controlling immune subsets (e.g., effector T cells, B cells, and “M1-like” TAMs) and anti–PD-1 sensitivity across models re-affirms that these immune subsets may drive responses to anti–PD-1 therapy in HCC. The observed wide diversity of immune TMEs in both preclinical models and human HCCs suggests that the use of multiple syngeneic HCC models is needed to improve the translatability of preclinical discoveries to human HCC.
Supplementary Material
FUNDING INFORMATION
Emerson Collective Fund (Won Jin Ho), Convergence Institute (Won Jin Ho), National Institutes of Health (NIH) 5T32CA009071-40 (Daniel J. Zabransky), Cholangiocarcinoma Foundation Research Fellowship (Daniel J. Zabransky), Conquer Cancer Young Investigator Award (Daniel J. Zabransky), NIH P50CA062924 (Mark Yarchoan), NIH U01CA212007 (Mark Yarchoan), NIH P30CA006973 (Mark Yarchoan), NIH R50 CA243627 (Ludmila Danilova).
Funding information
Cholangiocarcinoma Foundation, Grant/Award Number: Research Fellowship; Conquer Cancer Foundation, Grant/Award Number: Young Investigator Award; Convergence Institute; Emerson Collective; National Institutes of Health, Grant/Award Number: 5T32CA009071-40, P30CA006973, P50CA062924, R50CA243627 and U01CA212007
CONFLICT OF INTEREST
Dr. Zabransky received grants from Roche/Genentech. Dr. Jaffee consults for NextCure, Carta, DragonFly, Achilles and Genocea. She received grants from Abmeta, Lustgarten, AstraZeneca, Break Through Cancer and Parker Institute. Dr. Yarchoan consults for Exelixis, Eisai and AstraZeneca.
Abbreviations:
- CAF
cancer-associated fibroblast
- CyTOF
cytometry by time of flight
- DC
dendritic cell
- FBS
fetal bovine serum
- G-MDSC
granulocytic myeloid-derived suppressor cell
- HBV
hepatitis B virus
- HCC
hepatocellular carcinoma
- HCV
hepatitis C virus
- ICI
immune checkpoint inhibitor
- IHC
immunohistochemistry
- IMC
imaging mass cytometry
- M-MDSC
monocytic myeloid-derived suppressor cell
- P/S
penicillin–streptomycin
- PD-1
programmed cell death protein 1
- PD-L1
programmed death-ligand 1
- TAM
tumor-associated macrophage
- Tc
cytotoxic T cell
- TCGA
The Cancer Genome Atlas
- Th
helper T cell
- TME
tumor microenvironment
- Treg
regulatory T cell
- α-SMA
α-smooth muscle actin
Footnotes
SUPPORTING INFORMATION
Additional supporting information can be found online in the Supporting Information section at the end of this article.
REFERENCES
- 1.Kim E, Viatour P. Hepatocellular carcinoma: old friends and new tricks. Exp Mol Med. 2020;52:1898–907. [DOI] [PMC free article] [PubMed] [Google Scholar]
- 2.Oura K, Morishita A, Tani J, Masaki T. Tumor immune microenvironment and immunosuppressive therapy in hepatocellular carcinoma: a review. Int J Mol Sci. 2021;22:5801. [DOI] [PMC free article] [PubMed] [Google Scholar]
- 3.Ho WJ, Zhu Q, Durham J, Popovic A, Xavier S, Leatherman J, et al. Neoadjuvant cabozantinib and nivolumab convert locally advanced hepatocellular carcinoma into resectable disease with enhanced antitumor immunity. Nat Cancer. 2021;2:891–903. [DOI] [PMC free article] [PubMed] [Google Scholar]
- 4.Sangro B, Sarobe P, Hervás-Stubbs S, Melero I. Advances in immunotherapy for hepatocellular carcinoma. Nat Rev Gastroenterol Hepatol. 2021;18:525–43. [DOI] [PMC free article] [PubMed] [Google Scholar]
- 5.Darlington GJ. Liver cell lines. Methods Enzymol. 1987;151:19–38. [DOI] [PubMed] [Google Scholar]
- 6.Lacoste B, Raymond V-A, Cassim S, Lapierre P, Bilodeau M. Highly tumorigenic hepatocellular carcinoma cell line with cancer stem cell-like properties. PLoS One. 2017;12:e0171215. [DOI] [PMC free article] [PubMed] [Google Scholar]
- 7.Han Z, Yang D, Trivett A, Oppenheim JJ. Therapeutic vaccine to cure large mouse hepatocellular carcinomas. Oncotarget. 2017;8:52061–71. [DOI] [PMC free article] [PubMed] [Google Scholar]
- 8.Chuang M-H, Chang JT, Hsu L-J, Jan M-S, Lu F-J. Antitumor activity of the Chinese medicine JC-001 is mediated by immunomodulation in a murine model of hepatocellular carcinoma. Integr Cancer Ther. 2017;16:516–25. [DOI] [PMC free article] [PubMed] [Google Scholar]
- 9.Kress S, König J, Schweizer J, Löhrke H, Bauer-Hofmann R, Schwarz M. p53 mutations are absent from carcinogen-induced mouse liver tumors but occur in cell lines established from these tumors. Mol Carcinog. 1992;6:148–58. [DOI] [PubMed] [Google Scholar]
- 10.Zender L, Xue W, Cordón-Cardo C, Hannon GJ, Lucito R, Powers S, et al. Generation and analysis of genetically defined liver carcinomas derived from bipotential liver progenitors. Cold Spring Harb Symp Quant Biol. 2005;70:251–61. [DOI] [PMC free article] [PubMed] [Google Scholar]
- 11.Brown ZJ, Heinrich B, Greten TF. Establishment of orthotopic liver tumors by surgical intrahepatic tumor injection in mice with under-lying non-alcoholic fatty liver disease. Methods Protoc. 2018;1:21. [DOI] [PMC free article] [PubMed] [Google Scholar]
- 12.Zanotelli VRT, Bodenmiller B. ImcSegmentationPipeline: a pixelclassification based multiplexed image segmentation pipeline [internet]. Zenodo. 2017. [cited February 11, 2022]. Available from: https://zenodo.org/record/3841961 [Google Scholar]
- 13.Carpenter AE, Jones TR, Lamprecht MR, Clarke C, Kang IH, Friman O, et al. CellProfiler: image analysis software for identifying and quantifying cell phenotypes. Genome Biol. 2006;7:R100. [DOI] [PMC free article] [PubMed] [Google Scholar]
- 14.Berg S, Kutra D, Kroeger T, Straehle CN, Kausler BX, Haubold C, et al. Ilastik: interactive machine learning for (bio)image analysis. Nat Methods. 2019;16:1226–32. [DOI] [PubMed] [Google Scholar]
- 15.Schapiro D, Jackson HW, Raghuraman S, Fischer JR, Zanotelli VRT, Schulz D, et al. histoCAT: analysis of cell phenotypes and interactions in multiplex image cytometry data. Nat Methods. 2017;14:873–6. [DOI] [PMC free article] [PubMed] [Google Scholar]
- 16.Epskamp S, Cramer AOJ, Waldorp LJ, Schmittmann VD, Borsboom D. qgraph: network visualizations of relationships in psychometric data. J Stat Softw. 2012;48:1–18. [Google Scholar]
- 17.Ho WJ, Erbe R, Danilova L, Phyo Z, Bigelow E, Stein-O’Brien G, et al. Multi-omic profiling of lung and liver tumor microenvironments of metastatic pancreatic cancer reveals site-specific immune regulatory pathways. Genome Biol. 2021;22:154. [DOI] [PMC free article] [PubMed] [Google Scholar]
- 18.Charmsaz S, Gross N, Jaffee E, Ho WJ. A global live cell bar-coding approach for multiplexed mass cytometry profiling of mouse tumors. JCI Insight. 2021;6:e143283. [DOI] [PMC free article] [PubMed] [Google Scholar]
- 19.Weber LM, Nowicka M, Soneson C, Robinson MD. Diffcyt: differential discovery in high-dimensional cytometry via high-resolution clustering. Commun Biol. 2019;2:183. [DOI] [PMC free article] [PubMed] [Google Scholar]
- 20.Van Gassen S, Callebaut B, Van Helden MJ, Lambrecht BN, Demeester P, Dhaene T, et al. FlowSOM: using self-organizing maps for visualization and interpretation of cytometry data. Cytometry A. 2015;87:636–45. [DOI] [PubMed] [Google Scholar]
- 21.Becht E, McInnes L, Healy J, Dutertre CA, Kwok IWH, Ng LG, et al. Dimensionality reduction for visualizing single-cell data using UMAP. Nat Biotechnol. 2018;37:38–44. [DOI] [PubMed] [Google Scholar]
- 22.Thorsson V, Gibbs DL, Brown SD, Wolf D, Bortone DS, Ou Yang T-H, et al. The immune landscape of cancer. Immunity. 2018;48:812–30.e14. [DOI] [PMC free article] [PubMed] [Google Scholar]
- 23.ProjectR [Internet]. Github; [cited 2022 Feb 11]. Available from: https://github.com/genesofeve/projectR
- 24.Li H, Liu H, Fu H, Li J, Xu L, Wang G, et al. Peritumoral tertiary lymphoid structures correlate with protective immunity and improved prognosis in patients with hepatocellular carcinoma. Front Immunol. 2021;12:648812. [DOI] [PMC free article] [PubMed] [Google Scholar]
- 25.Chudnovskiy A, Pasqual G, Victora GD. Studying interactions between dendritic cells and T cells in vivo. Curr Opin Immunol. 2019;58:24–30. [DOI] [PMC free article] [PubMed] [Google Scholar]
- 26.Zhang J, Gu C, Song Q, Zhu M, Xu Y, Xiao M, et al. Identifying cancer-associated fibroblasts as emerging targets for hepatocellular carcinoma. Cell Biosci. 2020;10:127. [DOI] [PMC free article] [PubMed] [Google Scholar]
- 27.Liu T, Han C, Wang S, Fang P, Ma Z, Xu L, et al. Cancer-associated fibroblasts: an emerging target of anti-cancer immunotherapy. J Hematol Oncol. 2019;12:86. [DOI] [PMC free article] [PubMed] [Google Scholar]
- 28.Macek Jilkova Z, Aspord C, Decaens T. Predictive factors for response to PD-1/PD-L1 checkpoint inhibition in the field of hepatocellular carcinoma: current status and challenges. Cancers (Basel). 2019;11:1554. [DOI] [PMC free article] [PubMed] [Google Scholar]
- 29.Yuan X, Cheng G, Malek TR. The importance of regulatory T-cell heterogeneity in maintaining self-tolerance. Immunol Rev. 2014;259:103–14. [DOI] [PMC free article] [PubMed] [Google Scholar]
- 30.Jiang Y, Chen M, Nie H, Yuan Y. PD-1 and PD-L1 in cancer immunotherapy: clinical implications and future considerations. Hum Vaccin Immunother. 2019;15:1111–22. [DOI] [PMC free article] [PubMed] [Google Scholar]
- 31.Ao J-Y, Zhu X-D, Chai Z-T, Cai H, Zhang Y-Y, Zhang K-Z, et al. Colony-stimulating factor 1 receptor blockade inhibits tumor growth by altering the polarization of tumor-associated macrophages in hepatocellular carcinoma. Mol Cancer Ther. 2017;16:1544–54. [DOI] [PubMed] [Google Scholar]
- 32.Qin M, Wang D, Fang Y, Zheng Z, Liu X, Wu F, et al. Current perspectives on B lymphocytes in the immunobiology of hepatocellular carcinoma. Front Oncol. 2021;11:647854. [DOI] [PMC free article] [PubMed] [Google Scholar]
- 33.Newman AM, Steen CB, Liu CL, Gentles AJ, Chaudhuri AA, Scherer F, et al. Determining cell type abundance and expression from bulk tissues with digital cytometry. Nat Biotechnol. 2019;37:773–82. [DOI] [PMC free article] [PubMed] [Google Scholar]
- 34.Ally A, Balasundaram M, Carlsen R, Chuah E, Clarke A, Dhalla N, et al. Comprehensive and integrative genomic characterization of hepatocellular carcinoma. Cell. 2017;169:1327–41.e23. [DOI] [PMC free article] [PubMed] [Google Scholar]
- 35.Snell GD, Graff RJ, Cherry M. Histocompatibility genes of mice. Transplantation. 1971;11:525–30. [PubMed] [Google Scholar]
- 36.Kim TJ. The role of B cells in transplantation rejection. J Korean Soc Transplant. 2018;32:1. [Google Scholar]
- 37.Xiang X, Wang J, Lu D, Xu X. Targeting tumor-associated macrophages to synergize tumor immunotherapy. Signal Transduct Target Ther. 2021;6:75. [DOI] [PMC free article] [PubMed] [Google Scholar]
- 38.Llovet JM, Kelley RK, Villanueva A, Singal AG, Pikarsky E, Roayaie S, et al. Hepatocellular carcinoma. Nat Rev Dis Primers. 2021;7:6. [DOI] [PubMed] [Google Scholar]
- 39.Pfister D, Núñez NG, Pinyol R, Govaere O, Pinter M, Szydlowska M, et al. NASH limits anti-tumour surveillance in immunotherapy-treated HCC. Nature. 2021;592:450–6. [DOI] [PMC free article] [PubMed] [Google Scholar]
- 40.Wabitsch S, McCallen JD, Kamenyeva O, Ruf B, McVey JC, Kabat J, et al. Metformin treatment rescues CD8+ T-cell response to immune checkpoint inhibitor therapy in mice with NAFLD. J Hepatol. 2022;77:748–60. [DOI] [PMC free article] [PubMed] [Google Scholar]
- 41.Brown ZJ, Heinrich B, Greten TF. Mouse models of hepatocellular carcinoma: an overview and highlights for immunotherapy research. Nat Rev Gastroenterol Hepatol. 2018;15:536–54. [DOI] [PubMed] [Google Scholar]
Associated Data
This section collects any data citations, data availability statements, or supplementary materials included in this article.