

Abstract
Background
Physician time is a valuable yet finite resource. Whether such time is apportioned equitably among population subgroups, and how the provision of that time has changed in recent decades, is unclear.
Objective
To investigate trends and racial/ethnic disparities in the receipt of annual face time with physicians in the USA.
Design
Repeated cross-sectional.
Setting
National Ambulatory Medical Care Survey, 1979–1981, 1985, 1989–2016, 2018.
Participants
Office-based physicians.
Measures
Exposures included race/ethnicity (White, Black, and Hispanic); age (<18, 18–64, and 65+); and survey year. Our main outcome was patients’ annual visit face time with a physician; secondary outcomes include annual visit rates and mean visit duration.
Results
Our sample included n=1,108,835 patient visits. From 1979 to 2018, annual outpatient physician face time per capita rose from 40.0 to 60.4 min, an increase driven by a rise in mean visit length and not in the number of visits. However, since 2005, mean annual face time with a primary care physician has fallen, a decline offset by rising time with specialists. Face time provided per physician changed little given growth in the physician workforce. A racial/ethnic gap in physician visit time present at the beginning of the study period widened over time. In 2014–2018, White individuals received 70.0 min of physician face time per year, vs. 52.4 among Black and 53.0 among Hispanic individuals. This disparity was driven by differences in visit rates, not mean visit length, and in the provision of specialist but not primary care.
Limitation
Self-reported visit length.
Conclusion
Americans’ annual face time with office-based physicians rose for three decades after 1979, yet is still allocated inequitably, particularly by specialists; meanwhile, time spent by Americans with primary care physicians is falling. These trends and disparities may adversely affect patient outcomes. Policy change is needed to assure better allocation of this resource.
Supplementary Information
The online version contains supplementary material available at 10.1007/s11606-022-07688-x.
BACKGROUND
“Time,” the general practitioner and epidemiologist Julian Tudor Hart averred, “is the real currency of primary care ...”,1 words that ring true for many specialties. Acquiring a history, performing a physical exam, interpreting a study, formulating a diagnosis, conducting a procedure, providing counseling, and developing a well-considered treatment plan all require the expenditure of time by an individual clinician to an individual patient.
Yet physician time is a finite resource. Whether such time is allocated equitably among patient populations, and how the provision of that time has changed over the decades, is uncertain.
Twenty years ago, Mechanic et al. reported that between 1989 and 1998, the average duration of visits with office-based physicians rose from 16.3 to 21.5 min, a finding that undercut perceptions of declining visit length during the managed care era.2 A more recent analysis found that average visit duration continued to rise through 20103; two other studies reported similar trends for primary care visits, as well as a decline in the number of primary care visits per capita.4,5 None of these analyses, however, focused on trends in patients’ overall face time with physicians over the course of a year, or on racial/ethnic disparities in the allocation of that time.
Recent studies have identified substantial racial disparities in expenditures for outpatient care and in rates of ambulatory care visits. Black patients have approximately 26% lower healthcare expenditures on outpatient care compared to the population mean.6 Relative to Whites, Black adults have fewer visits per year with nearly every type of specialist.7 Such disparities in the quantity of visits could be compounded, or attenuated, by differences in visit duration,8 and both could be affected by recent changes in health coverage (e.g., implementation of the Affordable Care Act), delivery modes (e.g., growth of Accountable Care Organizations), and broader economic shifts (e.g., rising income inequality). Such inequities in ambulatory utilization could, in turn, contribute to longstanding racial/ethnic disparities in disease detection and management, and health outcomes.9–12
We investigated trends and racial/ethnic disparities in annual face time with office-based physicians in the USA from 1979 to 2018.
METHODS
Data
We analyzed data from the National Ambulatory Medical Care Survey (NAMCS), a nationally representative survey of office-based physicians conducted annually since 1973 by the National Center for Health Statistics (NCHS).
The survey’s procedures, detailed elsewhere, remained largely consistent over time.13 In brief, the NAMCS employs a multistage probability design with a sampling frame that includes physicians identified from the American Medical Association (AMA) and American Osteopathic Association (AOA) master files. Throughout the period, sampled physicians were (a) office-based; (b) “principally engaged in patient care activities”; (c) not specialized in anesthesiology, pathology, or radiology; and (d) non-federally employed. Beginning in 2012, physicians over age 85 were excluded; beginning in 2014, AMA physicians classified as hospital-employed were explicitly included to ensure that office-based physicians in the growing number of hospital-owned practices were not omitted. Throughout the study period, physicians provided detailed data on a random sample of visits conducted over the course of one randomly selected week during the survey year. The primary unit of observation is the patient visit; sample weights provided by the NCHS permit annual national estimates.
We analyzed all available years of NAMCS data beginning in 1979 (when detailed race/ethnicity data was first collected) through 2018, the most recent data available. Data were available for 1979–1981, 1985, 1989–2016, and 2018; 2017 data had not yet been released by the NCHS at the time of the study. As advised in the NAMCS documentation, we excluded the community health center stratum (survey years 2006–2011) for consistency across samples (n=21,408 of the total sample of 1,131,999).
To estimate physician time per capita for individual age and racial/ethnic groups, we used 1979–2018 Census Bureau Current Population Survey (CPS) microdata (obtained from IPUMS) to calculate population denominators.14
Variables
Our primary exposures were patients’ race/ethnicity, age, and year of survey.
Race/ethnicity was categorized as non-Hispanic White, non-Hispanic Black, and Hispanic. Individuals of other/multiple races were excluded from race/ethnicity analyses given low sample sizes in individual years. Appendix Table 1 provides details on how NAMCS race and ethnicity variables were aligned across study years; Appendix Note 1 provides details on NAMCS’ approach to imputation of missing race/ethnicity data. One thousand seven hundred four individuals (0.15% of the total sample of 1,110,591 individuals) with missing, non-imputed race (all in the 1989–1990 samples) were excluded (Appendix Figure 1 provides a flow-chart of study population formation).
We also stratified visits by patient age (<18 years, 18–64, and 65+ years). While age at the time of interview is provided for most years in NAMCS data, for years 1973–1981, it was not. For these years, we estimated age from month and two-digit year of birth and the NAMCS interview (details are provided in Appendix Note 2). From 2005 onward, we also examined visits according to physician specialty category (primary care specialty, medical specialty, and surgical specialty).
Our primary outcome was the total number of minutes outpatient physicians spent with patients (hereinafter “face time”) annually, which is equivalent to the product of mean visit duration by number of visits. We also report annual visit numbers and mean visit duration.
Physician practices were instructed to report the duration of each visit (in minutes) as time the clinician spent actually seeing the patient. For instance, in 2018, the sample visit form instructed “Enter estimated time spent with sampled provider”; supplementary instructions used by data collection agents further noted that this should only include time actually spent with the patient.15 We applied top-coding (90 min)—initiated in 2013—to previous years for consistency. Visit time was imputed by the NHAMCS when missing (with the exception of n=52 visits in 2004 which we excluded; Appendix Figure 1). The model for imputation is described in Appendix Note 1.16
To assess average annual face time per NAMCS physician, we estimated annual weighted physician counts from 2005 onward, the year when physician-level weights were first provided by the NAMCS. For earlier years, we used the number of physicians in the NAMCS’ sampling universe downwardly adjusted by the proportion of physicians in the universe determined to not meet NAMCS eligibility criteria after screening (for 1979 only, when this data was unavailable, we estimated the figure using linear interpolation between 1976 and 1980). For a sensitivity analysis, we used OECD figures on the total number of US licensed physicians for each year available (1980, 1985, 1990, 1992–2018), which is also based on the AMA master file.17
Analysis
To examine historical trends in physicians’ face time with outpatients (1979–2018), we calculated annual physician face time per capita by year, age, and race/ethnicity. We then calculated visit count per capita and mean visit duration for each year and subgroup, as well as annual physician face time per NAMCS physician and per US licensed physician.
From 2005 onward, we examined trends in the three metrics of utilization (and annual minutes per NAMCS physician) by physician specialty.
Finally, we combined the four most recent survey years (2014, 2015, 2016, and 2018) to improve precision in estimating contemporary disparities in utilization.
We present 3-year moving averages in all graphical depictions of data. When describing changes over time, we compared moving averages (e.g., 2016–2018 to 1979–1981, or 2016–2018 to 2005–2007).
We used STATA/SE 16 for all analyses, and NAMCS-provided sampling weights to produce national estimates. For the contemporary analysis (2014–2018), we used strata and sampling unit variables provided by the NHAMCS to estimate standard errors, and assumed that the census-based population denominators have negligible sampling error.
The Cambridge Health Alliance IRB does not consider analysis of publicly available de-identified data to be human subjects research.
RESULTS
Our primary sample included n=1,108,835 office-based patient visits (Appendix Figure 1). We first present trends in physician face time, followed by racial/ethnic disparities in annual face time.
Trends in Physician Visit Time
Figure 1 provides 1979–2018 trends in physician face time per capita and per physician. Over this period, annual outpatient total face time/capita (panel A) rose from 40.0 to 60.4 min. However, annual minutes spent with patients per NAMCS physician appeared largely stable from 1979 to 2004, increased from 2004 to 2005 (the year when our method of calculating the physician denominator changed), and again changed little from 2005 to 2018 (panel B). Annual minutes per all US licensed physicians similarly exhibited little net change over the study period (Appendix Figure 2).
Fig. 1.
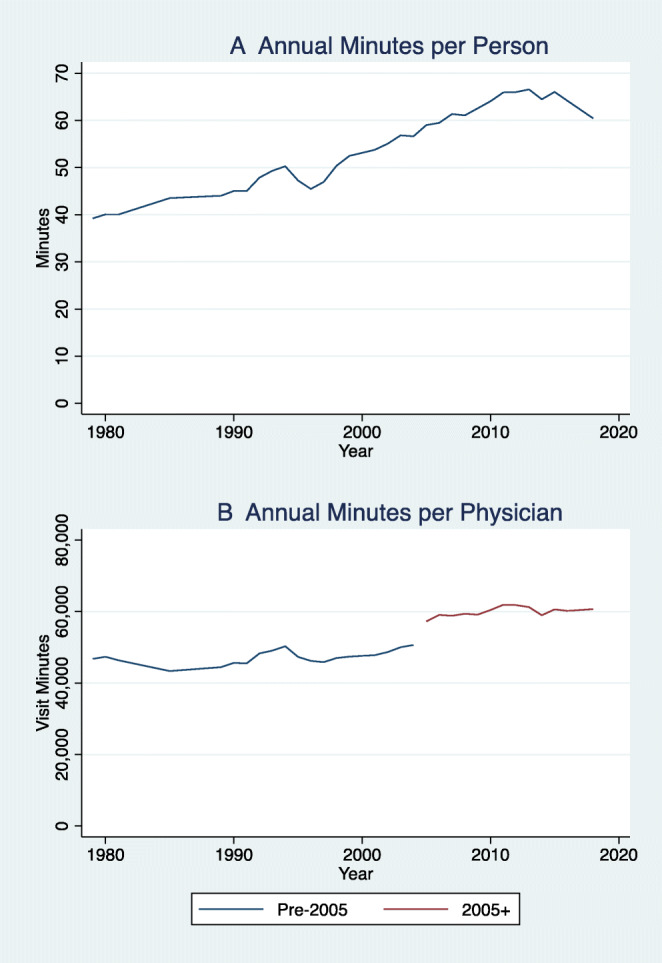
Trends in annual physician visit time per capita and per physician, 1979–2018. N= 1,108,835 NAMCS patient visits. Data points are 3-year moving averages. Years without NAMCS data (1982–1984; 1986–1988; 2017) are excluded. Line break in annual minutes per physician represents change in method of calculating annual physician count in 2005, as described in the manuscript.
The rise in physician face time per capita from 1979 to 2018 was driven by a rise in average visit duration (from 15.4 to 22.2 min), not an increase in the number of visits per capita (Appendix Figure 3). While visits per capita rose somewhat in the first three decades after 1979, they fell in the most recent decade, with little net change between 1979 and 2018 (~2.6–2.7 visits per capita).
Appendix Figure 4 displays annual per capita time patients spent with physicians stratified by specialty for years 2005–2018. Mean annual face time with primary care physicians fell from 33.8 to 30.4 min per capita (driven by a fall in mean annual visit numbers that exceeded the rise in visit duration). In contrast, face time with surgeons rose slightly from 12.1 to 12.6 min, and with medical specialists more substantially from 15.4 to 17.4 min. Differential trends in annual face time per capita by specialty were driven by declining visit rates to primary care physicians while visit rates to specialists were stable; mean visit duration rose among all three groups (Appendix Figure 4).
Changes in mean annual face time by specialty mirrored changes in the number of physicians: from 2005 to 2018, despite population growth, the weighted number of primary care physicians in the NAMCS sample fell from 151,836 to 147,494, while the number of surgeons rose from 68,398 to 69,031 and of medical specialists from 86,611 to 103,452 (data not shown). Consequently, annual face time per physician remained relatively stable for all three specialty groups (Appendix Figure 5). Annual face time per primary care physician changed little (65.4 to 66.0 thousand minutes per physician), and rose modestly among surgeons (52.2 to 58.5 thousand minutes) and medical specialists (52.4 to 54.1 thousand minutes).
Racial/Ethnic Disparities in Physician Face Time
Figure 2 provides 1979–2018 trends in physician face time by age and race/ethnicity. Between 1979 and 2018, mean annual physician face time per capita rose from 42.7 to 68.0 min among White individuals, from 29.6 to 45.1 min among Black individuals, and from 31.1 to 53.3 min among Hispanic individuals. Hence, the White-Black gap rose from 13.1 to 22.9 min, and the White-Hispanic gap from 11.6 to 14.7 min. Racial/ethnic disparities persisted throughout the study period among persons age <18 and 18–64, but were narrower among those ages 65 and older.
Fig. 2.

Trends in annual physician visit minutes per capita by age and race/ethnicity, 1979–2018. N= 1,071,899 NAMCS total patient visits. Data points are three-year moving averages. Years without NAMCS data (1982–1984; 1986–1988; 2017) are excluded.
Appendix Figures 6 and 7 display trends in average visit duration and the number of visits per capita for each racial/ethnic group, respectively. These indicate that growing racial/ethnic disparities in annual face time were mostly attributable to the widening gap in visit numbers; disparities in average visit duration at the beginning of the period narrowed over time.
Table 1 provides detailed 2014–2018 estimates of annual face time with physicians per capita, stratified by race/ethnicity, age, and physician specialty. White individuals of all ages received 70.0 min (95% CI 67.2, 72.8) of physician face time per year, compared to 52.4 (95% CI 47.3, 57.6) among Black individuals and 53.0 (95% CI 46.7, 59.3) among Hispanic individuals. However, time disparities differed by physician specialty. White, Black, and Hispanic individuals spent similar amounts of time with primary care physicians, i.e., 31.7, 29.4, and 33.2 min annually, respectively. Yet White individuals spent substantially more face time with medical specialists and surgical specialists relative to the other groups. For instance, White individuals of all ages received > 50% more medical specialist face time (22.9 min) than Black (13.2 min) or Hispanic (9.8 min) individuals.
Table 1.
Annual physician visit time with a physician by specialty, race/ethnicity, and age, 2014–2016 and 2018 (n=97,160 visits)
| Total annual physician visit minutes per person (95% CI) | ||||
|---|---|---|---|---|
| Primary care | Surgical care specialty | Medical specialty | All providers | |
| Overall | ||||
| Non-Hispanic White | 31.7 (29.6, 33.7) | 15.4 (14.1, 16.7) | 22.9 (21.0, 24.8) | 70.0 (67.2, 72.8) |
| Non-Hispanic Black | 29.4 (25.0, 33.7) | 9.8 (7.7, 12.0) | 13.2 (11.1, 15.3) | 52.4 (47.3, 57.6) |
| Hispanic | 33.2 (27.5, 39.0) | 10.0 (7.8, 12.1) | 9.8 (8.0, 11.5) | 53.0 (46.7, 59.3) |
| Total | 31.1 (29.1, 33.0) | 13.0 (11.8, 14.2) | 18.9 (17.2, 20.5) | 62.9 (60.4, 65.5) |
| Age < 18 years | ||||
| Non-Hispanic White | 34.6 (30.6, 38.6) | 4.1 (3.4, 4.8) | 9.0 (6.7, 11.2) | 47.7 (43.2, 52.2) |
| Non-Hispanic Black | 25.6 (19.6, 31.6) | 2.0 (1.4, 2.6) | 6.0 (3.7, 8.3) | 33.5 (27.1, 39.9) |
| Hispanic | 34.2 (23.1, 45.3) | 2.4 (1.6, 3.2) | 4.7 (2.1, 7.3) | 41.3 (30.0, 52.6) |
| Total | 32.0 (28.0, 35.9) | 3.2 (2.7, 3.8) | 7.5 (5.3, 9.7) | 42.6 (38.3, 47.0) |
| Ages 18–64 years | ||||
| Non-Hispanic White | 26.7 (24.6, 28.8) | 13.1 (11.4, 14.8) | 20.2 (18.4, 22.0) | 60.0 (57.1, 63.0) |
| Non-Hispanic Black | 27.6 (22.6, 32.7) | 9.3 (6.4, 12.3) | 11.8 (9.6, 14.1) | 48.8 (42.7, 54.9) |
| Hispanic | 28.0 (22.7, 33.3) | 9.5 (7.4, 11.5) | 9.9 (8.1, 11.8) | 47.4 (41.4, 53.3) |
| Total | 26.5 (24.4, 28.7) | 11.4 (9.9, 13.0) | 16.8 (15.3, 18.4) | 54.8 (52.0, 57.6) |
| Ages 65+ years | ||||
| Non-Hispanic White | 44.9 (40.3, 49.6) | 34.7 (32.1, 37.3) | 46.4 (41.6, 51.2) | 126.0 (119.2, 132.9) |
| Non-Hispanic Black | 49.1 (35.8, 62.4) | 32.0 (24.3, 39.6) | 38.9 (29.1, 48.6) | 120.0 (102.0, 138.0) |
| Hispanic | 76.0 (51.3, 100.7) | 50.6 (35.4, 65.8) | 32.9 (22.2, 43.6) | 159.5 (128.8, 190.3) |
| Total | 48.5 (43.3, 53.7) | 35.1 (32.2, 38.0) | 45.0 (40.1, 49.9) | 128.6 (121.2, 136.0) |
Total includes individuals of other/multiple races
Among children and non-elderly adults, patterns of racial/ethnic disparities according to physician specialty were similar to those for the overall population (Table 1). For instance, White children had nearly double the annual face time with surgical specialists as Black children (4.1 min versus 2.0 min). However, patterns differed among those ages 65 years and older; in that age group, Hispanic individuals had higher overall annual face time than other groups.
Racial/ethnic disparities in face time with specialists, like the disparities in overall visit time, were attributable to differences in visit rates (Table 2), not to differences in visit duration (Appendix Table 2). For example, White individuals received 0.9 medical specialty visits per year (95% CI 0.9, 1.0), roughly double that of Black (0.5 visits; 95% CI 0.4, 0.6) and Hispanic individuals (0.4 visits; 95% CI 0.3, 0.5), while mean visit durations were similar at 24.2, 25.7, and 24.6 min, respectively.
Table 2.
Annual physician visits by specialty, race/ethnicity, and age, 2014–2016 and 2018 (n=97,160 visits)
| Annual physician visits per person | ||||
|---|---|---|---|---|
| Primary care | Surgical care specialty | Medical specialty | All providers | |
| Total visits by race, overall | ||||
| Non-Hispanic White | 1.5 (1.4, 1.6) | 0.7 (0.7, 0.8) | 0.9 (0.9, 1.0) | 3.2 (3.1, 3.3) |
| Non-Hispanic Black | 1.4 (1.2, 1.6) | 0.4 (0.3, 0.5) | 0.5 (0.4, 0.6) | 2.3 (2.1, 2.5) |
| Hispanic | 1.5 (1.3, 1.8) | 0.4 (0.3, 0.5) | 0.4 (0.3, 0.5) | 2.4 (2.1, 2.6) |
| Total | 1.5 (1.4, 1.6) | 0.6 (0.5, 0.6) | 0.8 (0.7, 0.8) | 2.8 |
| Total visits by race, age < 18 years | ||||
| Non-Hispanic White | 1.8 (1.6, 2.0) | 0.2 (0.2, 0.2) | 0.3 (0.3, 0.4) | 2.3 (2.1, 2.6) |
| Non-Hispanic Black | 1.2 (0.9, 1.4) | 0.1 (0.1, 0.1) | 0.2 (0.1, 0.3) | 1.5 (1.2, 1.7) |
| Hispanic | 1.6 (1.2, 2.0) | 0.1 (0.1, 0.1) | 0.2 (0.1, 0.2) | 1.9 (1.5, 2.3) |
| Total | 1.6 (1.4, 1.8) | 0.2 (0.1, 0.2) | 0.3 (0.2, 0.3) | 2.0 |
| Total visits by race, age 18–64 years | ||||
| Non-Hispanic White | 1.3 (1.2, 1.4) | 0.6 (0.5, 0.7) | 0.8 (0.8, 0.9) | 2.7 (2.6, 2.8) |
| Non-Hispanic Black | 1.3 (1.1, 1.5) | 0.4 (0.3, 0.5) | 0.5 (0.4, 0.6) | 2.1 (1.9, 2.4) |
| Hispanic | 1.3 (1.1, 1.6) | 0.4 (0.3, 0.5) | 0.4 (0.3, 0.5) | 2.1 (1.9, 2.4) |
| Total | 1.3 (1.2, 1.4) | 0.5 (0.4, 0.6) | 0.7 (0.6, 0.7) | 2.5 |
| Total visits by race, age 65+ years | ||||
| Non-Hispanic White | 2.1 (1.8, 2.3) | 1.7 (1.5, 1.8) | 2.0 (1.8, 2.2) | 5.7 (5.4, 6.0) |
| Non-Hispanic Black | 2.3 (1.6, 2.9) | 1.3 (1.0, 1.5) | 1.5 (1.2, 1.9) | 5.1 (4.3, 5.8) |
| Hispanic | 3.4 (2.3, 4.4) | 2.1 (1.6, 2.7) | 1.4 (1.0, 1.8) | 6.9 (5.7, 8.2) |
| Total | 2.2 (2.0, 2.5) | 1.6 (1.5, 1.7) | 1.9 (1.7, 2.1) | 5.8 |
Total includes those of other/multiple race
DISCUSSION
After 1979, American patients’ annual face time with office-based physicians rose for some three decades before plateauing, although annual face time provided per physician changed little because the number of physicians grew. Such overall trends, however, obscure differences among patient subgroups and by physician specialty. Since 2005, patients’ annual face time with primary care physicians has declined, a reduction offset by rising face time with specialists; absolute overall racial/ethnic disparities in annual face time with physicians are wider now than 40 years ago. Today, White patients spend, on average, 70 min with office-based doctors annually relative to 52–53 min among Black and Hispanic patients.
Several studies have examined trends in the duration of ambulatory visits in the USA. At least four previous analyses of the NAMCS found evidence of rising mean visit duration, albeit over shorter time periods.2–4,18 Such findings (and ours) appear to contradict general perceptions of increasingly rushed visits. However, our examination of aggregate annual physician time presents a more complex, and less sanguine picture. Over the last 15 years, rising average visit duration has not increased the face time patients spend with doctors over the course of a year because per capita visit rates have fallen. Indeed, Americans’ annual face time with primary care physicians has declined, which may help explain why the amount of care that has to be provided per primary visit has increased.4
Our findings of declining primary care visit rates and face time are consistent with previous analyses focused on per-capita visit rates,4,19,20 and may help explain worsening population-level control of two conditions—hypertension9 and diabetes10—that are mostly managed by primary care practitioners.
We also observed marked disparities in annual physician face time to the present, a finding consistent with studies demonstrating racial/ethnic-,6,21,22 language-,23 and socioeconomic-24 based disparities in healthcare utilization. However, fewer analyses have examined disparities in visit duration. Two, using older NAMCS data, found little evidence of disparities in mean visit length,5,25 while in contrast a third identified a 4-min disparity in average psychiatric visit duration between Black and White patients.8 While we did not find substantive differences in mean visit duration in 2014–2018, we identified large racial disparities in annual face time driven by disparities in the number of visits/capita to surgeons and medical specialists.
Multiple factors could contribute to such inequities, including lower rates of insurance coverage among Black and Hispanic individuals:26 a disproportionate effect of cost-barriers such as copayments and deductibles on lower-income individuals, inequitable geographic access to physicians,27,28 and past and present racism in the healthcare system that engenders mistrust and deters use.29,30
Our finding that absolute disparities in physician face time have widened since the late-1970s is concerning. Our (and others’) findings suggest that income and racial disparities in care improved in the wake of the 1965 passage Medicare and Medicaid, but may have subsequently widened24,31–33—similar to the face time-focused findings of this study. Further research is needed into the cause of such widening utilization disparities. Notably, however, we found little evidence for large contemporary Black:White disparities in annual physician face time among elderly individuals, consistent with a recent study which identified an attenuation in racial access disparities with onset of Medicare eligibility,34 suggesting that coverage inequities may play an important role.
The rise in annual physician face time per capita that we observed, mostly in the late-twentieth century, is likely explained by expansion of the physician workforce. In conjunction with other recent investigations, this finding reinforces the hypothesis that aggregate society-wide healthcare utilization is predominantly determined by supply-side factors.35–39 It may also bolster the case for increasing the primary care workforce as a means to improve equity.
Our study has limitations. While the NAMCS’ visit duration variable has been used in studies spanning decades,2,3,5,8,18,40,41 it is reported by physician practices rather than directly observed. One study of 30 family practice physicians in Ohio found that physician-reported time using a NAMCS-questionnaire overestimated mean visit length by 3.7 min relative to direct observation by nurses,42 possibly because the physicians inappropriately included other work (e.g., chart completion) in their visit length estimates. However, it is unclear if that study is generalizable, and imprecision in measurement would not readily explain the differences between groups, or changes over time, that we observed. Another analysis, moreover, found a concordance of trends in self-measured visit duration between the NAMCS and an AMA physician survey.2 Additionally, multiple studies have demonstrated that visit duration in the NAMCS is correlated with patient, visit, and clinician factors expected to drive visit duration, e.g., provision of counseling, supporting the validity of the measure.3,5,18
The NAMCS has substantial missing data on visit duration and race/ethnicity. However, the NCHS imputes this data using appropriate methods. We also lacked sufficient data to examine utilization trends among understudied groups, including American Indians, Alaskan Natives, Asian Americans, Native Hawaiians, Pacific Islanders, and other/multiracial groups. Additionally, the NAMCS includes visits to office-based but not hospital outpatient-department (OPD) physicians. Unfortunately, comparable data on the latter is only available from 1992 to 2011. Yet in 2011, OPD visits accounted for ~11% of total (i.e., OPD + office-based) visits; hence, their exclusion is unlikely to substantially affect our overall results. Additionally, both the NAMCS and OPD data exclude visits provided to inpatients, and in nursing homes and prisons; hence, our findings are not applicable to those populations. There were changes in eligibility criteria over time, but these were minor (e.g., exclusion of physicians > 85 years old) and are unlikely to have affected overall trends. Additionally, we assessed only the quantity of face time, not how that time was spent; an increasing proportion of visit time, for instance, may involve data entry into the electronic health record (EHR) with the patient present. We similarly could not assess time spent on patient care outside of office visits, including during non-office surgical procedures.
Finally, our study was not designed to examine the clinical implications of disparities in physician time: while time is needed for clinicians to diagnose and manage disease, better health is ultimately the outcome of principal importance to patients.
CONCLUSION
The allocation of physician time sheds light on the priorities of a healthcare system. Declining per-capita receipt of annual primary care face time, driven by declining annual visits rather than reductions in visit length, is likely caused by the shrinking primary care physician workforce, and suggests a devaluing of this bedrock form of care, despite clear evidence of its benefits.43 Meanwhile, the inequitable allocation of physician time among racial and ethnic groups suggests that structural racism within the health system places lower value on some lives than others. The two phenomena may be linked: the shift from primary to specialist care could have exacerbated racial/ethnic disparities in utilization.
Such disparities matter. Time devoted to a patient is the sine qua non of good doctoring; indispensable for consideration, contemplation, and care-giving, as Henry James aptly depicted the “mere minutes which he yet placed at her service so crystal-clean the great empty cup of attention that he set between them on the table.”44 Policy changes are needed to assure the rational and fair distribution of this precious resource.
Supplementary information
(DOCX 358 kb)
Declarations
Conflict of Interest
Adam Gaffney, David Himmelstein, Steffie Woolhandler, Chris Cai, and Danny McCormick are, or have served as, leaders of Physicians for a National Health Program (PNHP), a non-profit organization that favors coverage expansion through a single payer program; however, none of them receive any compensation from that group, although some of Dr. Gaffney’s travel on behalf of the organization has been reimbursed by it. The spouse of Adam Gaffney is an employee of Treatment Action Group (TAG), a non-profit research and policy think tank focused on HIV, TB, and Hepatitis C treatment. In 2020, Chris Cai worked as a paid policy intern to US Representative Pramila Jayapal.
Footnotes
Publisher’s Note
Springer Nature remains neutral with regard to jurisdictional claims in published maps and institutional affiliations.
Contributor Information
Adam Gaffney, Email: agaffney@cha.harvard.edu.
David U. Himmelstein, Email: dhimmels@hunter.cuny.edu.
Samuel Dickman, Email: samdickman@gmail.com.
Danny McCormick, Email: dmccormick@challiance.org.
Christopher Cai, Email: chrislcai@gmail.com.
Steffie Woolhandler, Email: swoolhan@hunter.cuny.edu.
References
- 1.Hart JT. Two paths for medical practice. The Lancet. 1992;340(8822):772–5. doi: 10.1016/0140-6736(92)92304-X. [DOI] [PubMed] [Google Scholar]
- 2.Mechanic D, McAlpine DD, Rosenthal M. Are Patients’ Office Visits with Physicians Getting Shorter? N Engl J Med. 2001;344(3):198–204. doi: 10.1056/NEJM200101183440307. [DOI] [PubMed] [Google Scholar]
- 3.Shaw MK, Davis SA, Fleischer AB, Feldman SR. The Duration of Office Visits in the United States, 1993 to 2010. Am J Manag Care [Internet]. 2014 Oct 16 [cited 2021 Aug 30];20(10). Available from: https://www.ajmc.com/view/the-duration-of-office-visits-in-the-united-states-1993-to-2010 [PubMed]
- 4.Rao A, Shi Z, Ray KN, Mehrotra A, Ganguli I. National Trends in Primary Care Visit Use and Practice Capabilities, 2008-2015. Ann Fam Med. 2019;17(6):538–44. doi: 10.1370/afm.2474. [DOI] [PMC free article] [PubMed] [Google Scholar]
- 5.Chen LM, Farwell WR, Jha AK. Primary Care Visit Duration and Quality: Does Good Care Take Longer? Arch Intern Med. 2009;169(20):1866–72. doi: 10.1001/archinternmed.2009.341. [DOI] [PubMed] [Google Scholar]
- 6.Dieleman JL, Chen C, Crosby SW, Liu A, McCracken D, Pollock IA, et al. US Health Care Spending by Race and Ethnicity, 2002-2016. JAMA. 2021;326(7):649–59. doi: 10.1001/jama.2021.9937. [DOI] [PMC free article] [PubMed] [Google Scholar]
- 7.Cai C, Gaffney A, McGregor A, Woolhandler S, Himmelstein DU, McCormick D, et al. Racial and Ethnic Disparities in Outpatient Visit Rates Across 29 Specialties. JAMA Intern Med. 2021;181(11):1525–7. doi: 10.1001/jamainternmed.2021.3771. [DOI] [PMC free article] [PubMed] [Google Scholar]
- 8.Olfson M, Cherry DK, Lewis-Fernández R. Racial differences in visit duration of outpatient psychiatric visits. Arch Gen Psychiatry. 2009;66(2):214–21. doi: 10.1001/archgenpsychiatry.2008.523. [DOI] [PubMed] [Google Scholar]
- 9.Muntner P, Hardy ST, Fine LJ, Jaeger BC, Wozniak G, Levitan EB, et al. Trends in Blood Pressure Control Among US Adults With Hypertension, 1999-2000 to 2017-2018. JAMA. 2020;324(12):1190–200. doi: 10.1001/jama.2020.14545. [DOI] [PMC free article] [PubMed] [Google Scholar]
- 10.Fang M, Wang D, Coresh J, Selvin E. Trends in Diabetes Treatment and Control in U.S. Adults, 1999–2018. N Engl J Med. 2021;384(23):2219–28. doi: 10.1056/NEJMsa2032271. [DOI] [PMC free article] [PubMed] [Google Scholar]
- 11.Hsueh L, Wu W, Hirsh AT, de Groot M, Mather KJ, Stewart JC. Undiagnosed diabetes among immigrant and racial/ethnic minority adults in the United States: National Health and Nutrition Examination Survey 2011-2018. Ann Epidemiol. 2020;51:14–9. doi: 10.1016/j.annepidem.2020.07.009. [DOI] [PMC free article] [PubMed] [Google Scholar]
- 12.Boonyasai R, Azam I, Hahn C, Bonnett D, Goldstein E, Gyawali S, et al. 2021 National Healthcare Quality and Disparities Report. 316.
- 13.Center for Disease control and Prevention. 2018 NAMCS Micro-Data File Documentation. [cited 2021 Dec 29]; Available from: https://ftp.cdc.gov/pub/Health_Statistics/NCHS/Dataset_Documentation/NAMCS/doc2018-508.pdf
- 14.Flood S, King M, Rodgers R, Ruggles JR. Integrated Public Use Microdata Series, Current Population Survey: Version 7.0 [dataset] [Internet]. Minneapolis, MN: IPUMS; 2020. Available from: 10.18128/D030.V7.0
- 15.Centers for Disease Control and Prevention. Sample National Ambulatory Medical Care Survey 2019 Patient Record. [cited 2021 Dec 29]; Available from: https://www.cdc.gov/nchs/data/namcs/2019_NAMCS_patient_record_sample_blank-508.pdf
- 16.2018 NAMCS MICRO-DATA FILE DOCUMENTATION. Available from: https://www.cdc.gov/nchs/ahcd/datasets_documentation_related.htm
- 17.OECD Statistics: Health Care Resources [Internet]. [cited 2022 Jan 25]. Available from: https://stats.oecd.org/Index.aspx?ThemeTreeId=9
- 18.Causino N, Chang Y, Culpepper L, Marder W, Saglam D, Stafford R, et al. The Duration of Ambulatory Visits to Physicians. J Fam Pract. 1999;48(4):264–71. [PubMed] [Google Scholar]
- 19.Ganguli I, Shi Z, Orav EJ, Rao A, Ray KN, Mehrotra A. Declining Use of Primary Care Among Commercially Insured Adults in the United States, 2008–2016. Ann Intern Med. 2020;172(4):240–7. doi: 10.7326/M19-1834. [DOI] [PubMed] [Google Scholar]
- 20.Ganguli I, Lee TH, Mehrotra A. Evidence and Implications Behind a National Decline in Primary Care Visits. J Gen Intern Med. 2019;34(10):2260–3. doi: 10.1007/s11606-019-05104-5. [DOI] [PMC free article] [PubMed] [Google Scholar]
- 21.Gornick ME, Eggers PW, Reilly TW, Mentnech RM, Fitterman LK, Kucken LE, et al. Effects of Race and Income on Mortality and Use of Services among Medicare Beneficiaries. N Engl J Med. 1996;335(11):791–9. doi: 10.1056/NEJM199609123351106. [DOI] [PubMed] [Google Scholar]
- 22.Cai C, Gaffney A, McGregor A, Woolhandler S, Himmelstein DU, McCormick D, et al. Racial and Ethnic Disparities in Outpatient Visit Rates Across 29 Specialties. JAMA Intern Med. 2021 Jul 19; [DOI] [PMC free article] [PubMed]
- 23.Himmelstein J, Himmelstein DU, Woolhandler S, Bor DH, Gaffney A, Zallman L, et al. Health Care Spending And Use Among Hispanic Adults With And Without Limited English Proficiency, 1999–2018. Health Aff (Millwood). 2021;40(7):1126–34. doi: 10.1377/hlthaff.2020.02510. [DOI] [PubMed] [Google Scholar]
- 24.Dickman SL, Woolhandler S, Bor J, McCormick D, Bor DH, Himmelstein DU. Health spending for low-, middle-, and high-income americans, 1963–2012. Health Aff Millwood. 2016;35(7):1189–96. doi: 10.1377/hlthaff.2015.1024. [DOI] [PubMed] [Google Scholar]
- 25.Ray KN, Chari AV, Engberg J, Bertolet M, Mehrotra A. Disparities in Time Spent Seeking Medical Care in the United States. JAMA Intern Med. 2015;175(12):1983–6. doi: 10.1001/jamainternmed.2015.4468. [DOI] [PMC free article] [PubMed] [Google Scholar]
- 26.Cohen RA. Health insurance coverage: Early release of estimates from the National Health Interview Survey, 2020. 2020;23.
- 27.Brown EJ, Polsky D, Barbu CM, Seymour JW, Grande D. Racial Disparities In Geographic Access To Primary Care In Philadelphia. Health Aff (Millwood). 2016;35(8):1374–81. doi: 10.1377/hlthaff.2015.1612. [DOI] [PubMed] [Google Scholar]
- 28.Tsui J, Hirsch JA, Bayer FJ, Quinn JW, Cahill J, Siscovick D, et al. Patterns in Geographic Access to Health Care Facilities Across Neighborhoods in the United States Based on Data From the National Establishment Time-Series Between 2000 and 2014. JAMA Netw Open. 2020;3(5):e205105. doi: 10.1001/jamanetworkopen.2020.5105. [DOI] [PMC free article] [PubMed] [Google Scholar]
- 29.Musa D, Schulz R, Harris R, Silverman M, Thomas SB. Trust in the Health Care System and the Use of Preventive Health Services by Older Black and White Adults. Am J Public Health. 2009;99(7):1293–9. doi: 10.2105/AJPH.2007.123927. [DOI] [PMC free article] [PubMed] [Google Scholar]
- 30.Alsan M, Wanamaker M, Hardeman RR. The Tuskegee Study of Untreated Syphilis: A Case Study in Peripheral Trauma with Implications for Health Professionals. J Gen Intern Med. 2020;35(1):322–5. doi: 10.1007/s11606-019-05309-8. [DOI] [PMC free article] [PubMed] [Google Scholar]
- 31.Rogers DE, Blendon RJ. The changing american health scene: Sometimes things get better. JAMA. 1977;237(16):1710–4. doi: 10.1001/jama.1977.03270430052019. [DOI] [PubMed] [Google Scholar]
- 32.Link CR, Long SH, Settle RF. Equity and the utilization of health care services by the medicare elderly. J Hum Resour. 1982;17(2):195–212. doi: 10.2307/145469. [DOI] [PubMed] [Google Scholar]
- 33.Gaffney A, McCormick D, Bor D, Woolhandler S, Himmelstein D. Coverage Expansions and Utilization of Physician Care: Evidence From the 2014 Affordable Care Act and 1966 Medicare/Medicaid Expansions. Am J Public Health. 2019;17:e1–8. doi: 10.2105/AJPH.2019.305330. [DOI] [PMC free article] [PubMed] [Google Scholar]
- 34.Wallace J, Jiang K, Goldsmith-Pinkham P, Song Z. Changes in Racial and Ethnic Disparities in Access to Care and Health Among US Adults at Age 65 Years. JAMA Intern Med. 2021;181(9):1207–15. doi: 10.1001/jamainternmed.2021.3922. [DOI] [PMC free article] [PubMed] [Google Scholar]
- 35.Neprash HT, Zink A, Sheridan B, Hempstead K. The Effect of Medicaid Expansion on Medicaid Participation, Payer Mix, and Labor Supply in Primary Care. J Health Econ. 2021;12:102541. doi: 10.1016/j.jhealeco.2021.102541. [DOI] [PubMed] [Google Scholar]
- 36.Glied S, Hong K. Health care in a multi-payer system: Spillovers of health care service demand among adults under 65 on utilization and outcomes in medicare. J Health Econ. 2018;60:165–76. doi: 10.1016/j.jhealeco.2018.05.001. [DOI] [PubMed] [Google Scholar]
- 37.McInerney M, Mellor JM, Sabik LM. The Effects of State Medicaid Expansions for Working-Age Adults on Senior Medicare Beneficiaries. Am Econ J Econ Policy. 2017;9(3):408–38. doi: 10.1257/pol.20150402. [DOI] [Google Scholar]
- 38.Gaffney A, Himmelstein DU, Woolhandler S, Kahn JG. Pricing Universal Health Care: How Much Would The Use Of Medical Care Rise? Health Aff (Millwood). 2021;40(1):105–12. doi: 10.1377/hlthaff.2020.01715. [DOI] [PubMed] [Google Scholar]
- 39.Gaffney A, Woolhandler S, Himmelstein D. The Effect of Large-scale Health Coverage Expansions in Wealthy Nations on Society-Wide Healthcare Utilization. J Gen Intern Med. 2019 Nov 19; [DOI] [PMC free article] [PubMed]
- 40.Coco A, Mainous AG. Relation of Time Spent in an Encounter With the Use of Antibiotics in Pediatric Office Visits for Viral Respiratory Infections. Arch Pediatr Adolesc Med. 2005;159(12):1145–9. doi: 10.1001/archpedi.159.12.1145. [DOI] [PubMed] [Google Scholar]
- 41.Ma J, Stafford RS. Quality of US Outpatient Care: Temporal Changes and Racial/Ethnic Disparities. Arch Intern Med. 2005;165(12):1354–61. doi: 10.1001/archinte.165.12.1354. [DOI] [PubMed] [Google Scholar]
- 42.Gilchrist VJ, Stange KC, Flocke SA, McCord G, Bourguet C. A Comparison of the National Ambulatory Medical Care Survey (NAMCS) Measurement Approach With Direct Observation of Outpatient Visits. Med Care. 2004;42(3):276–80. doi: 10.1097/01.mlr.0000114916.95639.af. [DOI] [PubMed] [Google Scholar]
- 43.Basu S, Berkowitz SA, Phillips RL, Bitton A, Landon BE, Phillips RS. Association of Primary Care Physician Supply With Population Mortality in the United States, 2005-2015. JAMA Intern Med. 2019;179(4):506–14. doi: 10.1001/jamainternmed.2018.7624. [DOI] [PMC free article] [PubMed] [Google Scholar]
- 44.James H. The Wings of the Dove. Scribner; 1937. 336 p.
Associated Data
This section collects any data citations, data availability statements, or supplementary materials included in this article.
Supplementary Materials
(DOCX 358 kb)