

Abstract
Head and neck squamous cell carcinoma (HNSCC), which originates from mucosal epithelium in the oral cavity, pharynx and larynx, is the sixth most common malignancy in the world. The prognosis of HNSCC is not satisfactory due to metastasis, resulting in 5-year survival rates ranging from 65.9 to 67.2%. Previously, we developed a method to evaluate the effect prodrug-activating suicide gene (PA-SG) therapy on the proliferation of HNSCC. The present study investigated PA-SG therapy on metastatic HNSCC by wound-healing assay and our previously established method. HSC-3 cells with stable expression of suicide genes thymidine kinase (TK) or cytosine deaminase (CD) were treated with prodrugs ganciclovir (GCV) or 5-fluorocytosine (5-FC), respectively. Both GCV and 5-FC inhibited HSC-3 proliferation while the bystander effect of CD/5-FC was greater compared with that of TK/GCV. GCV showed a greater anti-migration effect compared with that of 5-FC. To the best of our knowledge, the present study is the first to evaluate the anti-migratory and anti-proliferative effects of PA-SG therapies on metastatic HNSCC. This may also serve as a general method to quantify other types of PA-SC therapy. The present results demonstrated that PA-SG therapy is a promising treatment for anti-metastatic HNSCC therapy development.
Keywords: head and neck squamous cell carcinoma, head and neck squamous cell carcinoma, metastasis, suicide gene therapy, prodrug, thymidine kinase and ganciclovir, cytosine deaminase and 5-fluorocytosine
Introduction
Head and neck squamous carcinoma (HNSCC), including oral cavity, lip, laryngeal, nasopharyngeal, oropharyngeal, hypopharyngeal and salivary glands cancer, is known to be the sixth most common malignancy in the world (1,2). More than 931,000 individuals were diagnosed with HNSCC and >467,000 patients died from HNSCC worldwide in 2020(1). The overall 5-year survival rate was 65.9% in 2002-2006(3) and 67.2% in a retrospective study (4). Tumour metastasis is one of the leading causes of death in HNSCC, with ~10% of patients diagnosed with metastatic HNSCC at initial clinical presentation and 20-30% of patients developing metastasis during their disease duration (5). The prognosis of metastatic HNSCC is poor with a median of 10.1 months for overall survival even with improved systemic therapy (6).
Patients with metastatic HNSCC typically receive systemic therapy following surgery. The current systemic treatments include chemotherapy, targeted therapy and immunotherapy. Platinum-based therapy is the foundation of HNSCC chemotherapy where the single-agent platinum therapy is superior to non-platinum chemotherapies or combination platinum therapies in terms of survival for chemotherapy (7). Targeted therapy is an emerging treatment for metastatic HNSCC. High epidermal growth factor receptor (EGFR) expression is associated with poor overall survival and disease-free survival (8). Cetuximab, a monoclonal antibody blocking EGFR signalling, significantly increases patient survival when combined with radiotherapy (9). Cetuximab in combination with platinum-fluorouracil chemotherapy has achieved the longest survival rates in patients with metastatic HNSCC (6,7). Programmed cell death protein 1 (PD-1) and programmed cell death ligand 1 (PD-L1) are immune checkpoint proteins that suppress the anticancer progress of the immune system (10). Antibodies blocking PD-1 or PD-L1 have been approved for recurrent or metastatic HNSCC (11,12). The benefits of immunotherapy are low toxicity and satisfactory efficacy. However, only a small portion of patients respond to the PD-1 or PD-L1 treatment, ranging from 13.3 to 16.0% for HNSCC in the US (13).
Our previous study investigated the effect of prodrug-activating suicide gene (PA-SG) therapy on proliferation of HNSCC and established a method to quantify the effects of PA-SG therapy (14). The present study aimed to investigate the effect of PA-SG therapy on metastatic HNSCC, especially on cancer cell migration. The HSC-3 cell line was chosen as the metastatic cell model. This cell line is derived from tongue cancer with lymph node metastasis (15) and is human papillomavirus 16-negative (16). Inoculation of HSC-3 in nude mice causes lymph node metastasis (15,17). In the present study, two well-studied PA-SG therapies were investigated, which are thymidine kinase (TK) with ganciclovir (GCV) and cytosine deaminase (CD) with 5-fluorocytosine (5-FC) (18,19). To the best of our knowledge, the present study is the first to quantify the anti-migratory and anti-proliferative effects of PA-SG therapies.
Materials and methods
Selection of metastatic HNSCC cell line
The present study aimed to investigate PA-SG therapy on metastatic HNSCC cell lines. Information on seven HNSCC cell lines was searched in the Cellosaurus (20) for a suitable metastatic HNSCC, such as HSC-1, HSC-2, HSC-3, HSC-4, Ca9-22, KB (15,21-23) and SAS (24) HSC-3 is the most suitable cell line for the present study being one of the first metastatic HNSCC cells established (Table I) (15). Moreover, the metastasis phenotype of HSC-3 in nude mice has been supported by an independent study (17). The other cells were not suitable for our current study, because they were not HNSCC (HSC-1), lacked the metastatic mice phenotype (HSC-2, HSC-4 and SAS) or were contaminated by another cell type (Ca9-22 and KB).
Table I.
Information on cell lines.
| First author/s, year | Cell line | Disease site | Note | (Refs.) |
|---|---|---|---|---|
| Kondo and Aso, 1981 | HSC-I | Squamous cell carcinoma of the skin | Not HNSCC | (21) |
| Momose et al, 1989 | HSC-2 | Squamous cell carcinoma of the oral cavity | No metastasis phenotype in nude mice | (15) |
| Momose et al, 1989 | HSC-3 | Squamous cell carcinoma of the oral tongue | Metastasis phenotype in nude mice | (15,17) |
| Matsui et al, 1998 | ||||
| Momose et al, 1989 | HSC-4 | Squamous cell carcinoma of the oral tongue | No metastasis phenotype in nude mice | (15) |
| Horikoshi et al, 1974 | Ca9-22 | Squamous cell carcinoma of the oral cavity | Partially contaminated with MSK-922 | (23) |
| SAS | Squamous cell carcinoma of the oral tongue | No metastasis phenotype in nude mice | (24) | |
| Eagle, 1955 | KB | Human papillomavirus-related endocervical adenocarcinoma | Contaminated with a HeLa derivative | (22) |
Cell culture
The HSC-3 cell line was purchased from Merck KGaA (cat. no. SCC193). Cells were cultured in DMEM (cat. no. 10569010; Thermo Fisher Scientific, Inc.) supplemented with 10% FBS (cat. no. 26140079; Thermo Fisher Scientific, Inc.) and 1% penicillin-streptomycin antibiotics (cat. no. 15140122l; Thermo Fisher Scientific, Inc.) at 37˚C with 5% CO2. Cells were subcultured every 2-3 days by digestion with TrypLE™ (Thermo Fisher Scientific, Inc.). The subculture ratio is 1:6.
Generation of stable cell lines
Stable cell lines were generated as previously described (14). Briefly, yeast CD (pCMVtight-UPRT-T2A-RFP-IRES-CD; cat. no. 126677; Addgene, Inc.) and HSV type 1 TK (pAL119-TK; cat. no. 21911; Addgene, Inc.) suicide genes were amplified by PCR and ligated to mVenus in the pROSA26 vector with human ROSA26 1 kb sequence (AC018506.5; bp 114,245 to 115,244) and promoter and polyA signal for mVenus. The resulting plasmids are mVenus-CD and mVenus-TK, which serve as templates. The single guide (sg)RNA targeting sequences were sgRNA1: 5'-TGTCGAGGTTATTGTAATAA-3' and sgRNA4: 5'-CCGTGGGAAGATAAACTAAT-3'. The sgRNA sequences were synthesized by Integrated DNA Technologies (Integrated DNA Technologies Pte. Ltd.) and cloned into pX330 vector according to instruction in the reference (25). The templates, sgRNA1, and sgRNA4 were co-transfected into HSC-3 cells to integrate the suicide genes into the ROSA26 locus. One day before transfection, 1x10⁵ HSC-3 cells were seeded into one well of a 12-well plate with 1 ml culture medium and cultured at 37˚C with 5% CO2. On the day of transfection, 1 µg template encoding mVenus-TK, mVenus-CD or mVenus only with 1 µg sgRNA plasmid targeting the ROSA26 locus were transfected at 37˚C overnight into HSC-3 cells using FuGENE HD Transfection Reagent kit (cat. no. E2311; Promega Corporation). One day after transfection, the transfected HSC-3 cells were trypsinized and subcultured into a 96-well plate at a density of 1 cell/well. After 8 days of culture at 37˚C fluorescence-positive cell colonies were collected. The fluorescent images of HSC-3 mVenus-CD or mVenus-TK cell colonies were taken under Nikon inverted microscope (Eclipse Ti2-U, Nikon Instruments Inc.) with longpass GFP filter cube (excitation filter 480/30 nm, dichroic mirror 505 nm, barrier filter 515 nm) with the same exposure time and objective. The fluorescent intensity of ~20-40 individual cells was measure by ImageJ Software (Version 1.53a, National Institutes of Health). The cell colony with the highest fluorescent intensity was chosen for the experiments.
Verification of insertion of the suicide gene in HSC-3 cells
To extract genomic DNA, 1x10⁶ HSC-3 cells were incubated in 300 µl 0.5 M NaOH for 30 min at 37˚C. After centrifuging at 10,000 x g at room temperature for 10 min, HSC-3 supernatant was diluted to 1:1,000 in 0.1 M Tris-HCl (pH 8.0) as a template. The suicide gene inserts at the ROSA36 locus were amplified by Taq DNA Polymerase (cat. No. 11304011; Thermo Fisher Scientific, Inc.) using the following primer pair: Forward, 5'-CGGCCGAGACTTCTGGATGG-3' and reverse, 5'-CCCAGCTAAGGAAAAAGGATAAAATGAAAATCAAG-3', which target to ROSA26 locus, The thermocycling conditions used for PCR were as follows: Initial denaturation at 95˚C for 30 sec followed by 30 cycles at 95˚C for 30 sec, annealing at 60˚C for 15 sec and elongation at 72˚C for 90 sec. The PCR products were resolved on 1% agarose gel with ethidium bromide.
Prodrug treatment
GCV and 5-FC were purchased from Sigma-Aldrich (cat. nos. PHR1593 and F7129, respectively). GCV was dissolved in DMSO at a concentration of 30 mM as a stock solution. 5-FC was dissolved in water at a concentration of 100 mM. HSC-3 mVenus-TK cells were treated with GCV and HSC-3 mVenus-CD cells were treated with 5-FC at 37˚C at indicated concentration for indicated duration. For the dose-response experiment, HSC-3 cells were treated with two-fold dilution of GCV or 5-FC ranging from ~0.1 µM to 100 µM for 3 days at 37˚C. For the time-course response experiment, HSC-3 mVenus-TK cells were treated with 25 µM GCV and HSC-3 mVenus-CD cells were treated with 100 µM 5-FC for 0, 24, 48, 72, and 96 h respectively at 37˚C. For the bystander effect experiment, the cells were treated with 25 µM GCV or 100 µM 5-FC for 72 h at 37˚C. Before treating cells, drugs were diluted to the desired concentration using the culture medium. For the prodrug treatments, the old culture medium was replaced with medium containing the prodrug.
Cell viability analysis via MTT assay
MTT was dissolved in PBS at a concentration of 5 mg/ml (cat. no. M2003-1G; Signa-Aldrich; Merck KGaA). A total of 1x10⁴ cells was seeded into each well of a 96-well plate. Following drug treatment, 10 µl MTT reagent was added to each well. Following 1 h incubation at 37˚C, 100 µl solubilization solution (10% SDS in 0.01 M HCl) was added to each well. The plate was kept at 37˚C overnight. The soluble formazan was measured by using FlexStation 3 Multi-Mode Microplate Reader (Molecular Devices, LLC) at 570 nm wavelength. For the dose-response experiment, MTT assay was performed 3 days after drug treatment. For the time-course response experiment, MTT assays were performed every 24 h from 0 to 96 h. For the bystander effect experiment, MTT assay was carried out after prodrug treatment for 72 h.
Quantitation of bystander effect
Bystander effect is a phenomenon of suicide gene therapy, in which adjacent cancer cells that do not express suicide gene are killed by prodrug treatment. Bystander effects were quantitively measured using a method described previously (14). HSC-3 mVenus-TK or mVenus-CD cells were mixed with HSC-3 mVenus cells at the ratios of 100, 75, 50, 25 and 0% of suicide gene-positive cells. Then, the cell mixtures were treated with GCV at 25 µM or with 5-FC at 100 µM for three days. Next, cell viabilities were measured by MTT assay. The cell viability was plotted against the percentage of suicide gene positive cells ratio. The data were fitted to exponential equation: y=a*e-bx + c, where y is cell viability and x is percentage of suicide gene positive cells. In this exponential equation, b is the decay constant, which represents how fast the cell viability decrease with increase of percentage of suicide gene positive cell. The bigger b value means prodrug will kill more cells with the same ratio of suicide gene positive cells. Thus, a bigger b value represents a better bystander effect.
Wound healing assay and prodrug treatment
A total of 6x10⁵ cells was seeded into a 6-well plate with 2 ml culture medium with 10% FBS. Serum starvation was not performed during wound healing assay because serum starvation may complex HSC-3 cell migration (26) and would healing assay protocol without serum starvation is feasible (27). The wound was generated by using 1 ml pipette tip. Detached cells and cell debris were removed by washing with medium. Wound images were captured immediately with a Nikon inverted light microscope equipped with a 10x objective (Nikon Corporation). The healing images were captured after 24 h culture at 37˚C. Inhibition of cell migration was calculated as the ratio of the wound area of the healing image and the mean area of the wound image at three time intervals: 0-24, 24-48, and 48-72 h. Wound areas were measured using ImageJ Software (Version 1.53a, National Institutes of Health) with the Wound Healing Tool (28).
Wound healing was measured at three time periods: 0-24, 24-48 and 48-72 h. For the 0-24 h period experiment, a wound was generated immediately before prodrug treatment and the healing images were captured after 24 h prodrug treatment. For the 24-48 h period experiment, cells were treated with prodrug for 24 h before wound generation while the healing image was captured after a further 24 h for a total of 48 h prodrug treatment. For the 48-72 h experiment, cells were treated with prodrug for 48 h before the wound strip generation while the healing images were captured after a further 24 h for a total of 72 h prodrug treatment.
Statistical analysis
GraphPad Prism 9 software (GraphPad Software, Inc.) was used to perform statistical analysis. One-way analysis of variance with Tukey's post hoc test was performed for multiple comparisons. Data are expressed as the mean ± standard deviation or standard error of the mean from three independent experiments. P<0.05 was considered to indicate a statistically significant difference.
Results
Properties of HSC-3 cell lines stably expressing CD or TK
HSC-3 cell lines stably expressing mVenus tagged TK (mVenus-TK) or CD (mVenus-CD) were generated. The mVenus tag serves as a fluorescent marker to facilitate the screening of stable cell lines. A control cell line, which expresses the mVenus tag only, was generated as a negative control. Most HSC-3 cells were fluorescence-positive, indicating the three stable cell lines were homogenous (Fig. 1). To demonstrate the incorporation of genes into the ROSA26 locus, PCR was performed to amplify the DNA sequence around the insert site of the ROSA26 locus from HSC-3 mVenus, mVenus-CD or mVenus-TK cells. mVenus and suicide genes were successfully inserted into the ROSA26 locus of HSC-3 (Fig. S1A). The proliferation curve of HSC-3 mVenus and HSC3 mVenus-CD cells were the same as the wild-type HSC-3 cells. However, HSC-3 mVenus-TK cells grew more slowly than wild-type HSC-3 cells (Fig. S1). The proliferation rate of other independent HSC-3 mVenus-TK cells was also measured, which showed a slower proliferation rate than wild-type HSC-3 cells (data not shown). This indicated that the expression of mVenus-TK reduces the HSC-3 cell proliferation rate.
Figure 1.

HSC-3 stable cell lines expressing mVenus, mVenus-CD or mVenus-TK. Representative microscopy images of HSC-3 cells stably expressing mVenus, mVenus-CD or mVenus-TK. Scale bar, 50 µm. CD, cytosine deaminase; TK, thymidine kinase.
Dose-response of HSC-3 cells to GCV or 5-FC
To evaluate the response of HSC-3 cells to GCV and 5-FC, HSC-3 cells expressing TK or CD were treated with a series of 2-fold dilutions of GCV or 5-FC for three days. The highest concentration of prodrug was 100 µM.
For HSC-3 mVenus-TK cells, GCV concentrations from 0.2 µM started to inhibit HSC-3 cell viability increase (Fig. 2A). However, high concentrations of GCV, including 50 and 100 µM GCV, inhibited HSC-3 mVenus cells viability increase, which did not express TK (Fig. 2A). The highest concentration of GCV that did not inhibit HSC-3 mVenus viability increase was 25 µM. At this concentration, GCV inhibited 83% of HSC-3 mVenus-TK cell viability increase. Cell viability reduction rate increased at GCV concentration >3.1 µM (Fig. 2A). Consequently, the dose-response curve was divided into two phases based on the viability reduction rate: i) A slow phase at GCV <3.1 µM and ii) a quick phase at GCV ≥3.1 µM. The shape of each phase was sigmoidal, whereas the dose-response curve of HSC-3 mVenus-TK to GCV was double sigmoidal (Fig. 2A).
Figure 2.

Dose-response of HSC-3 cells to GCV or 5-FC treatment. (A) Dose-response curve of HSC-3 cells treated with GCV. HSC-3 mVenus or HSC-3 mVenus-TK cells were treated with 2-fold dilutions of GCV ranging from 0.1 to 100.0 µM for three days. (B) Dose-response curve of HSC-3 cells treated with 5-FC. HSC-3 mVenus or HSC-3 mVenus-CD cells were treated with 2-fold dilutions of 5-FC ranging from 0.01 to 100.0 µM for three days. Cell viability was measured and normalized to untreated cells. Data are presented as mean ± SD of three experiments. CD, cytosine deaminase; TK, thymidine kinase; GCV, ganciclovir; 5-FC, 5-fluorocytosine; SD, standard deviation.
5-FC started to inhibit the viability increase of HSC-3 mVenus-CD cells at a concentration of 3.1 µM (Fig. 2B). The inhibitory effect plateaued at 50 µM 5-FC. At 100 µM, 5-FC caused 78% inhibition of HSC-3 mVenus-CD cells viability increase, whereas 5-FC at this concentration did not inhibit the viability increase of HSC-3 mVenus cells (Fig. 2B).
Time-course response of HSC-3 cells to prodrug treatment
To evaluate time-course response, HSC-3 mVenus-TK and HSC-3 mVenus-CD cells were treated with GCV at 25 µM and 5-FC at 100 µM. The cell viability was measured via MTT assay every 24 h.
GCV and 5-FC treatments started to inhibit the viability increase of HSC-3 mVenus-TK and HSC-3 mVenus-CD cells after 24 h treatment (Fig. 3A and B). By contrast, the two prodrugs did not inhibit HSC-3 mVenus cells viability increase. Compared with HSC-3 mVenus cells, cell viability of HSC-3 mVenus-TK and HSC-3 mVenus-CD cells was 78 and 107% after 96 h treatment with GCV and 5-FC, respectively. By contrast, viability of HSC-3 cells reached to 795 and 866% respectively. The time-course response profiles of HSC-3 cells to GCV or 5-FC treatment exhibited a similar profile (Fig. S2).
Figure 3.

Time-course response of HSC-3 cells to GCV or 5-FC . (A) Time-course response of HSC-3 mVenus and HSC-3 mVenus-TK cells to 25 µM of GCV. (B) Time-course response of HSC-3 mVenus cells and HSC-3 mVenus-CD cells to 100 µM 5-FC. Cell viability was measured via MTT assay every 24 h. Cell viability was normalized to the MTT reading at 0 h. Data are presented as the mean ± SD of three experiments. CD, cytosine deaminase; TK, thymidine kinase; GCV, ganciclovir; 5-FC, 5-fluorocytosine; SD, standard deviation.
Bystander effect of TK/GCV and CD/5-FC on HSC-3 cells
Bystander effects of TK/GCV and CD/5-FC on HSC-3 cells were investigated. The cell viability and the percentage of suicide gene positive cells were fitted to the exponential equation: y=a*e-bx + c. The fitting results is satisfactory with R2 equal to 0.9995 and 0.9934 for CD/5-FC and TK/GCV respectively (Table II). It was found that CD/5-FC pair had a bigger b value than the TK/GCV pair (Fig. 4 and Table II), indicating that CD/5-FC had a better bystander effect than TK/GCV on HSC-3 cells.
Table II.
Quantitative evaluation of bystander effects of prodrug-activating-suicide gene therapies on HSC-3 cells.
| Cell-prodrug pair | Prodrug concentration | R2 | b-value | % of area |
|---|---|---|---|---|
| Cytosine deaminase/5-fluorocytosine | 100 µM | 0.9995 | 4.14 | 31.4 |
| Thymidine kinase/ganciclovir | 25 µM | 0.9934 | 1.51 | 13.2 |
Figure 4.
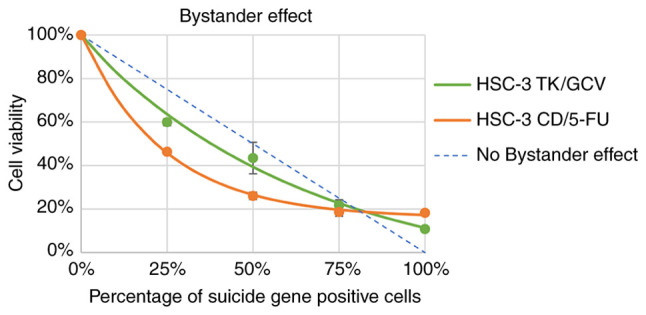
Bystander effects of GCV and 5-FC on HSC-3 cells. HSC-3 mVenus-TK or HSC-3 mVenus-CD cells were mixed with HSC-3 mVenus cells to a final percentage of suicide gene positive of 0, 25, 50, 75 and 100%. The cell mixtures were treated with 25 µM GCV or 100 µM 5-FC for 72 h. Cell viability was measured via MTT and normalized to the MTT reading of HSC-3 mVenus cells. Cell viability was plotted against the percentage of suicide gene-positive cells. Data are represented as the mean ± standard deviation of three experiments. CD, cytosine deaminase; TK, thymidine kinase; GCV, ganciclovir; 5-FC, 5-fluorocytosine.
To measure the overall bystander effect, the % of area was calculated based on curves in Fig. 4. First, the area between fitted exponential curve and theoretical no bystander effect curve was calculated. This area is directly related to by-stander effect of suicide gene. Then the percentage of this area to the area of triangle surrounded by x-axis, y-axis, and the theoretical no bystander effect curve was calculated. As shown in Table II, CD/5-FC still has a larger % of area than TK/GCV (31.4 vs 13.2%), confirming that CD/5-FC has a better bystander effect than TK/GCV on HSC-3 cells.
Inhibition of HSC-3 cell migration by PA-SG therapy
To investigate the effect of prodrugs on HSC-3 cell migration, an improved wound-healing assay was performed. In the improved wound-healing assay, instead of evaluating prodrug effects within the first 24 h treatment, the effect of prodrugs on cell migration was evaluated during the last 24 h of prodrug treatment.
For HSC-3 mVenus-TK cells, 25 µM GCV inhibited cell migration at all three different prodrug treatment durations. By contrast, migration of HSC-3 mVenus cells was not affected by GCV treatment (Fig. 5A-C). GCV inhibited 57-95% of HSC-3 mVenus-TK cell migration in all prodrug treatment durations and the inhibitory effect increased by increasing the duration of treatments (Fig. 5D).
Figure 5.

Inhibition of HSC-3 mVenus-TK cell migration following treatment with GCV. (A) GCV treatment inhibited HSC-3 mVenus-TK but not HSC-3 mVenus cell migration during the 0-24 h period. Following generation of the wound, scratch images were captured and cells were treated with 25 µM GCV. The healing images were captured after a further 24 h GCV treatment (scale bar, 100 µm). (B) GCV treatment inhibited HSC-3 mVenus-TK cell migration during the 24-48 h period. HSC-3 mVenus and HSC-3 mVenus-TK cells were treated with 25 µM GCV for 24 h and wounds were generated. After taking the scratch images, cells were treated with 25 µM GCV for a further 24 h, then the healing images were captured (scale bar, 100 µm). (C) GCV treatment inhibited HSC-3 mVenus-TK cell migration during the 48-72 h period. The wounds were generated after cells were treated with 25 µM GCV for 48 h. The cells were treated for a further 24 h, then healing images were captured. Scale bar, 100 µm. (D) Quantification of inhibition of cell migration for treatment durations. The percentage of migration inhibition is the ratio of the area of healing images to the average strip area of the scratch images. Data are presented as the mean ± SD of >3 healing images. Data were analysed using one-way ANOVA followed by Tukey's post hoc test for multiple comparisons. ****P<0.0001. CD, cytosine deaminase; TK, thymidine kinase; GCV, ganciclovir; SD, standard deviation.
For HSC-3 mVenus-CD cells, 100 µM 5-FC inhibited cell migration in all treatment durations but had no effects on the HSC-3 mVenus cells (Fig. 6A-C). However, the inhibitory effect decreased from 98 to 89% during the last 24 h of the longest prodrug treatment (Fig. 6C and D).
Figure 6.

Inhibition of HSC-3 mVenus-CD cell migration by 5-FU. (A) 5-FU treatment inhibited HSC-3 mVenus-CD but not HSC-3 mVenus cell migration during the 0-24 h period. Following wound generation, scratch images were captured and cells were treated with 100 µM 5-FC. The healing images were captured after 5-FC treatment for 24 h. Scale bar, 100 µm. (B) 5-FU treatment inhibited HSC-3 mVenus-CD cell migration during the 24-48 h period. HSC-3 mVenus and HSC-3 mVenus-CD cells were treated with 100 µM 5-FC for 24 h and wounds were generated. After taking the scratch images, cells were continuously treated with 100 µM 5-FC for another 24 h. The healing images were captured at 48 h. Scale bar, 100 µm. (C) 5-FU treatment inhibited HSC-3 mVenus-CD cell migration during the 48-72 h period. The wounds were generated after cells were treated with 100 µM 5-FU for 48 h. The healing images were captured at 72 h. Scale bar, 100 µm. (D) Quantification of inhibition of cell migration of the three periods. The percentage of migration inhibition is the ratio of the area of healing images to mean area of the scratch images. Data are presented as the mean ± SD of >3 healing images. Data were analysed using one-way ANOVA followed by Tukey's post hoc test for multiple comparisons. ***P<0.001 and ****P<0.0001. CD, cytosine deaminase; 5-FC, 5-fluorocytosine; SD, standard deviation.
Discussion
In the present study, the anti-proliferative and anti-migratory effects of two well-studied PA-SG therapies on metastatic HSC-3 cells were quantitively evaluated (18,19). To the best of our knowledge, the present study is the first quantitative study of anti-migratory effects of PA-SG therapy on a metastatic HNSCC cell model. In addition, the methods used in the present study are common and can be used to evaluate other PA-SG therapies for various types of cancer.
The anti-migration effect of TK/GCV was different from CD/5-FC. TK/GCV continuously inhibited HSC-3 migration during 72 h treatment, whereas the anti-migration effect of CD/5-FC decreased during the 48-72 h treatment period. This difference implied that the anti-migratory mechanisms were different between TK/GCV and CD/5-FC. In a previous study, a mechanistic difference was observed between CD/5-FC and TK/GCV in terms of cell-killing effect (29). TK/GCV rapidly induces phosphorylation of Bcl-xL and consequently apoptotic cell death. By contrast, CD/5-FC treatment decreases expression of Bcl-xL. This implies that TK/GCV and CD/5-FC activate different intracellular signalling pathways. These differences between TK/GCV and CD/5-FC may be associated with differences in the anti-migratory effect found in the present study. The anti-migratory mechanisms of TK/GCV and CD/5-FC are clear. TK/GCV and CD/5-FC block DNA synthesis and cause cell cycle arrest. However, their effects on cell cycle arrest are different. 5-fluorouracil, which is an effective product of CD/5-FC, blocks two thirds of cells in G0/G1 phase and one-third of cells at S phase (30). By contrast, TK/GCV arrests more cells at the S phase than CD/5-FC (31). A previous study reported that, when arrested in S phase, cells are not sensitive to movement stimulation (32). Thus TK/GCV has an improved anti-migratory effect compared with that of CD/5-FC, potentially due to TK/GCV arresting more cells at the S phase than CD/5-FC and S phase cells having weaker mobility.
The dose-response curve of HSC-3 cells was compared with the previous CAL-27 cell results (14). The IC50, which is the concentration when prodrug inhibits 50% of cell viability increase, of GCV to HSC-3 and CAL-27 were 3.96 and 0.024 µM, respectively. These results showed that HSC-3 cells were less sensitive to GCV treatment than CAL-27 cells. It was previously demonstrated that HSC-3 cells are more malignant and tend to metastasize following implantation into immunodeficient mice (17). In the present study, the IC50 of GCV for HSC-3 cells was 165-fold higher than that for CAL-27 cells. At 0.39 µM, GCV effectively kills most of the CAL-27 cells (14). By contrast, in the present study, 25 µM GCV killed most HSC-3 cells (Fig. 2A), which is consistent with the malignancy of HSC-3 cells (17). Dose-response curve of HSC-3 mVenus-TK-GCV was double sigmoid. The underlying mechanism remains unclear. HSC-3 cells may express endogenous protein that processes TK to decrease its activity. This protein may not be potent and only be activated at a high concentration of GCV. IC50 of 5-FC for HSC-3 cells was 2-fold higher than that for CAL-27 cells, which also showed the malignancy of HSC-3 cells.
The time-course response of HSC-3 cells to prodrugs' treatment was compared with CAL-27 cells' response . It was found that HSC-3 mVenus cells proliferated more quickly than the CAL-27 mVenus cells in the presents of prodrugs. Consistent with the dose-response result, HSC-3 cells expressing suicide genes were less sensitive to prodrug treatment than CAL-27 cells in the time-course response. After 96 h treatment, HSC-3 mVenus-TK and mVenus-CD cell viabilities were 78 and 107% for GCV and 5-FC treatment respectively. By contrast, prodrugs can kill >85% of CAL-27 cells (14), indicating that HSC-3 cells are more resistant to PA-SC therapies than CAL-27 cells.
In the present study, CD/5-FC has a stronger bystander effect than TK/GCV on HSC-3 cells (Fig. 4 and Table II). This phenomenon was also observed on CAL-27 cells, in which bystander effect of CD/5-FC was stronger than that of TK/GCV (Table SI) (14). We also found that the bystander effects of CD/5-FC and TK/GCV on HSC-3 cells were weaker than that on CAL-27 cells The b-value of 5-FC on HSC-3 was 4.14, whereas the b-value of 5-FC on CAL-27 is 14.0. The percentage of area (% of area) was 31.4 and 63.2% for CD/5-FC on HSC-3 and CAL-27 cells respectively. The TK/GCV also has a weaker bystander effect on HSC-3 than on CAL-27 (HSC-3 vs CAL-27 b-value: 1.51 vs 5.85; % of are: 13.2 vs 52.3%). These results indicated that HSC-3 cells were more malignant than CAL-27 cells.
Despite advances in cancer treatment, cancer metastasis is a major concern for solid tumour treatment (33). TK/GCV may be more beneficial on patients with HNSCC than CD/5-FC because the present study found that TK/GCV had an improved anti-migratory effect compared with that of CD/5-FC. Prevention of metastasis of cancer may lead to improved morbidity and mortality (34).
In the present study, the human ROSA26 locus was selected for the knock-in site of suicide genes, which is located on human chromosome 3(35). HSC-3 cell line is a near-triploid cell line with at least three copies of chromosome 3(36). Compared with normal diploid cells, chromosome 3 is not evenly distributed into daughter cells after mitosis (36). As a result, one copy of suicide gene integration would not be sufficient for stable cell screening. In the process of stable cell screening, a portion of cells lost fluorescence following cell division into one single colony (data not shown). Consequently, in the present study, the number of HSC-3 cell colonies screened to obtain a stable cell line was higher than that for CAL-27 cells. Therefore, it is recommended to use a novel knock-in locus instead of ROSA26 for HSC-3 cell line.
The method in the present study could be extended to evaluate PA-SG therapies on metastatic NHSCC models in vivo. HSC-3 cells develop lymph nodes and pulmonary metastasis following injection into the tongue of a immunodeficient mouse model (17). A similar animal model could be used to inoculate HSC-3 mVenus-TK and mVenus-CD cells in the tongues of immunodeficient mice. Finally, lymph node and pulmonary metastases could be evaluated with or without prodrugs.
Supplementary Material
Acknowledgements
Not applicable.
Funding Statement
Funding: The present study was supported by the National Science Foundation of China (grant no. 31670728), Hong Kong Special Administrative Region (grant nos. 16103719 and 16101120), Research Program of Shenzhen Innovation Council (grant nos. JCYJ20200109140208058 and JCYJ20190809104803572), Guangdong Basic and Applied Basic Research Foundation (grant no. 2021A1515220104), Shenzhen Fund for Guangdong Provincial High-level Clinical Key Specialties (grant no. SZGSP008) and Sanming Project of Medicine in Shenzhen (grant no. SZSM 202111012; Oral and Maxillofacial Surgery Team, Peking University Hospital of Stomatology).
Availability of data and materials
The datasets used and/or analysed during the current study are available from the corresponding author on reasonable request.
Authors' contributions
NX, HT and HY participated in the research design. NX, HT, CF, YL and YC performed the experiments, analysed data and wrote the manuscript. YS, GZ, CG and HY provided technical guidance and participated in data acquisition and analysis. YS and HY confirm the authenticity of all the raw data. All authors have read and approved the final manuscript.
Ethics approval and consent to participate
Not applicable.
Patient consent for publication
Not applicable.
Competing interests
The authors declare that they have no competing interests.
References
- 1.Sung H, Ferlay J, Siegel RL, Laversanne M, Soerjomataram I, Jemal A, Bray F. Global cancer statistics 2020: GLOBOCAN estimates of incidence and mortality worldwide for 36 cancers in 185 countries. CA Cancer J Clin. 2021;71:209–249. doi: 10.3322/caac.21660. [DOI] [PubMed] [Google Scholar]
- 2.Cramer JD, Burtness B, Le QT, Ferris RL. The changing therapeutic landscape of head and neck cancer. Nat Rev Clin Oncol. 2019;16:669–683. doi: 10.1038/s41571-019-0227-z. [DOI] [PubMed] [Google Scholar]
- 3.Pulte D, Brenner H. Changes in survival in head and neck cancers in the late 20th and early 21st century: A period analysis. Oncologist. 2010;15:994–1001. doi: 10.1634/theoncologist.2009-0289. [DOI] [PMC free article] [PubMed] [Google Scholar]
- 4.Gonzalez-Garcia R, Naval-Gias L, Roman-Romero L, Sastre-Perez J, Rodriguez-Campo FJ. Local recurrences and second primary tumors from squamous cell carcinoma of the oral cavity: A retrospective analytic study of 500 patients. Head Neck. 2009;31:1168–1180. doi: 10.1002/hed.21088. [DOI] [PubMed] [Google Scholar]
- 5.Pisani P, Airoldi M, Allais A, Valletti PA, Battista M, Benazzo M, Briatore R, Cacciola S, Cocuzza S, Colombo A, et al. Metastatic disease in head & neck oncology. Acta Otorhinolaryngol Ital. 2020;40:S1–S86. doi: 10.14639/0392-100X-suppl.1-40-2020. [DOI] [PMC free article] [PubMed] [Google Scholar]
- 6.Vermorken JB, Mesia R, Rivera F, Remenar E, Kawecki A, Rottey S, Erfan J, Zabolotnyy D, Kienzer HR, Cupissol D, et al. Platinum-based chemotherapy plus cetuximab in head and neck cancer. N Engl J Med. 2008;359:1116–1127. doi: 10.1056/NEJMoa0802656. [DOI] [PubMed] [Google Scholar]
- 7.Price KA, Cohen EE. Current treatment options for metastatic head and neck cancer. Curr Treat Options Oncol. 2012;13:35–46. doi: 10.1007/s11864-011-0176-y. [DOI] [PubMed] [Google Scholar]
- 8.Ang KK, Berkey BA, Tu X, Zhang HZ, Katz R, Hammond EH, Fu KK, Milas L. Impact of epidermal growth factor receptor expression on survival and pattern of relapse in patients with advanced head and neck carcinoma. Cancer Res. 2002;62:7350–7356. [PubMed] [Google Scholar]
- 9.Bonner JA, Harari PM, Giralt J, Azarnia N, Shin DM, Cohen RB, Jones CU, Sur R, Raben D, Jassem J, et al. Radiotherapy plus cetuximab for squamous-cell carcinoma of the head and neck. N Engl J Med. 2006;354:567–578. doi: 10.1056/NEJMoa053422. [DOI] [PubMed] [Google Scholar]
- 10.Han Y, Liu D, Li L. PD-1/PD-L1 pathway: Current researches in cancer. Am J Cancer Res. 2020;10:727–742. [PMC free article] [PubMed] [Google Scholar]
- 11.Ferris RL, Blumenschein G Jr, Fayette J, Guigay J, Colevas AD, Licitra L, Harrington K, Kasper S, Vokes EE, Even C, et al. Nivolumab for recurrent squamous-cell carcinoma of the head and neck. N Engl J Med. 2016;375:1856–1867. doi: 10.1038/s41572-020-00224-3. [DOI] [PMC free article] [PubMed] [Google Scholar]
- 12.Cohen EEW, Soulieres D, Le Tourneau C, Dinis J, Licitra L, Ahn MJ, Soria A, Machiels JP, Mach N, Mehra R, et al. Pembrolizumab versus methotrexate, docetaxel, or cetuximab for recurrent or metastatic head-and-neck squamous cell carcinoma (KEYNOTE-040): A randomised, open-label, phase 3 study. Lancet. 2019;393:156–167. doi: 10.1016/S0140-6736(18)31999-8. [DOI] [PubMed] [Google Scholar]
- 13.Haslam A, Prasad V. Estimation of the percentage of us patients with cancer who are eligible for and respond to checkpoint inhibitor immunotherapy drugs. JAMA Netw Open. 2019;2(e192535) doi: 10.1001/jamanetworkopen.2019.2535. [DOI] [PMC free article] [PubMed] [Google Scholar]
- 14.Xu N, Tian H, Fung CP, Lin Y, Zhu G, Shen Y, Yang H. Quantitative evaluation and comparison of two prodrug-activating suicide gene therapies on oral squamous cell carcinoma. Am J Cancer Res. 2021;11:1672–1682. [PMC free article] [PubMed] [Google Scholar]
- 15.Momose F, Araida T, Negishi A, Ichijo H, Shioda S, Sasaki S. Variant sublines with different metastatic potentials selected in nude mice from human oral squamous cell carcinomas. J Oral Pathol Med. 1989;18:391–395. doi: 10.1111/j.1600-0714.1989.tb01570.x. [DOI] [PubMed] [Google Scholar]
- 16.Sugiyama M, Bhawal UK, Dohmen T, Ono S, Miyauchi M, Ishikawa T. Detection of human papillomavirus-16 and HPV-18 DNA in normal, dysplastic, and malignant oral epithelium. Oral Surg Oral Med Oral Pathol Oral Radiol Endod. 2003;95:594–600. doi: 10.1067/moe.2003.36. [DOI] [PubMed] [Google Scholar]
- 17.Matsui T, Ota T, Ueda Y, Tanino M, Odashima S. Isolation of a highly metastatic cell line to lymph node in human oral squamous cell carcinoma by orthotopic implantation in nude mice. Oral Oncol. 1998;34:253–256. [PubMed] [Google Scholar]
- 18.Karjoo Z, Chen X, Hatefi A. Progress and problems with the use of suicide genes for targeted cancer therapy. Adv Drug Deliv Rev. 2016;99:113–128. doi: 10.1016/j.addr.2015.05.009. [DOI] [PMC free article] [PubMed] [Google Scholar]
- 19.Bali A, Bali D, Sharma A. An overview of gene therapy in head and neck cancer. Indian J Hum Genet. 2013;19:282–290. doi: 10.4103/0971-6866.120811. [DOI] [PMC free article] [PubMed] [Google Scholar]
- 20.Bairoch A. The cellosaurus, a cell-line knowledge resource. J Biomol Tech. 2018;29:25–38. doi: 10.7171/jbt.18-2902-002. [DOI] [PMC free article] [PubMed] [Google Scholar]
- 21.Kondo S, Aso K. Establishment of a cell line of human skin squamous cell carcinoma in vitro. Br J Dermatol. 1981;105:125–132. doi: 10.1111/j.1365-2133.1981.tb01196.x. [DOI] [PubMed] [Google Scholar]
- 22.Eagle H. Propagation in a fluid medium of a human epidermoid carcinoma, strain KB. Proc Soc Exp Biol Med. 1955;89:362–364. doi: 10.3181/00379727-89-21811. [DOI] [PubMed] [Google Scholar]
- 23.Horikoshi M, Kimura Y, Nagura H, Ono T, Ito H. A new human cell line derived from human carcinoma of the gingiva. I. Its establishment and morphological studies. Nihon Koku Geka Gakkai Zasshi. 1974;20:100–106. doi: 10.5794/jjoms.20.100. (In Japanese) [DOI] [PubMed] [Google Scholar]
- 24.Takahashi K, Kanazawa H, Akiyama Y, Tazaki S, Takahara M, Muto T, Tanzawa H, Sato KI. Establishment and characterization of a cell line (SAS) from poorly differentiated human squamous cell carcinoma of the tongue. J Jpn Stomatol Soc. 1989;38:20–28. [Google Scholar]
- 25.Cong L, Ran FA, Cox D, Lin S, Barretto R, Habib N, Hsu PD, Wu X, Jiang W, Marraffini LA, Zhang F. Multiplex genome engineering using CRISPR/Cas systems. Science. 2013;339:819–823. doi: 10.1126/science.1231143. [DOI] [PMC free article] [PubMed] [Google Scholar]
- 26.Pirkmajer S, Chibalin AV. Serum starvation: Caveat emptor. Am J Physiol Cell Physiol. 2011;301:C272–C279. doi: 10.1152/ajpcell.00091.2011. [DOI] [PubMed] [Google Scholar]
- 27.Yarrow JC, Perlman ZE, Westwood NJ, Mitchison TJ. A high-throughput cell migration assay using scratch wound healing, a comparison of image-based readout methods. BMC Biotechnol. 2004;4(21) doi: 10.1186/1472-6750-4-21. [DOI] [PMC free article] [PubMed] [Google Scholar]
- 28.Jonkman JE, Cathcart JA, Xu F, Bartolini ME, Amon JE, Stevens KM, Colarusso P. An introduction to the wound healing assay using live-cell microscopy. Cell Adh Migr. 2014;8:440–451. doi: 10.4161/cam.36224. [DOI] [PMC free article] [PubMed] [Google Scholar]
- 29.Fischer U, Steffens S, Frank S, Rainov NG, Schulze-Osthoff K, Kramm CM. Mechanisms of thymidine kinase/ganciclovir and cytosine deaminase/ 5-fluorocytosine suicide gene therapy-induced cell death in glioma cells. Oncogene. 2005;24:1231–1243. doi: 10.1038/sj.onc.1208290. [DOI] [PubMed] [Google Scholar]
- 30.Gao J, Yan Q, Liu S, Yang X. Knockdown of EpCAM enhances the chemosensitivity of breast cancer cells to 5-fluorouracil by downregulating the antiapoptotic factor Bcl-2. PLoS One. 2014;9(e102590) doi: 10.1371/journal.pone.0102590. [DOI] [PMC free article] [PubMed] [Google Scholar]
- 31.Liang L, Bi W, Chen W, Lin Y, Tian Y. Combination of MPPa-PDT and HSV1-TK/GCV gene therapy on prostate cancer. Lasers Med Sci. 2018;33:227–232. doi: 10.1007/s10103-017-2331-6. [DOI] [PubMed] [Google Scholar]
- 32.Bonneton C, Sibarita JB, Thiery JP. Relationship between cell migration and cell cycle during the initiation of epithelial to fibroblastoid transition. Cell Motil Cytoskeleton. 1999;43:288–295. doi: 10.1002/(SICI)1097-0169(1999)43:4<288::AID-CM2>3.0.CO;2-Y. [DOI] [PubMed] [Google Scholar]
- 33.Pulley JM, Jerome RN, Ogletree ML, Bernard GR, Lavieri RR, Zaleski NM, Hong CC, Shirey-Rice JK, Arteaga CL, Mayer IA, et al. Motivation for launching a cancer metastasis inhibition (CMI) program. Target Oncol. 2018;13:61–68. doi: 10.1007/s11523-017-0542-1. [DOI] [PMC free article] [PubMed] [Google Scholar]
- 34.Eccles SA, Welch DR. Metastasis: Recent discoveries and novel treatment strategies. Lancet. 2007;369:1742–1757. doi: 10.1016/S0140-6736(07)60781-8. [DOI] [PMC free article] [PubMed] [Google Scholar]
- 35.Irion S, Luche H, Gadue P, Fehling HJ, Kennedy M, Keller G. Identification and targeting of the ROSA26 locus in human embryonic stem cells. Nat Biotechnol. 2007;25:1477–1482. doi: 10.1038/nbt1362. [DOI] [PubMed] [Google Scholar]
- 36.Ribeiro IP, Rodrigues JM, Mascarenhas A, Kosyakova N, Caramelo F, Liehr T, Melo JB, Carreira IM. Cytogenetic, genomic, and epigenetic characterization of the HSC-3 tongue cell line with lymph node metastasis. J Oral Sci. 2018;60:70–81. doi: 10.2334/josnusd.16-0811. [DOI] [PubMed] [Google Scholar]
Associated Data
This section collects any data citations, data availability statements, or supplementary materials included in this article.
Supplementary Materials
Data Availability Statement
The datasets used and/or analysed during the current study are available from the corresponding author on reasonable request.