

Abstract
How species respond to climate change may impact their extinction probability. Here we link climatology and ecology to tackle a globally important conservation question. For sea turtles, there are concerns that climate warming will cause both the feminization of populations as well as reduced hatchling survival. For 58 nesting sites across the world spanning all seven sea turtle species, we investigated whether warming might be avoided by shifts in nesting phenology to a cooler part of the year. We show that even with the most extreme phenological shift that has been reported to date—an 18-day advance in nesting per °C increase in sea surface temperature (SST)—temperatures will continue to increase at nesting sites with climate warming. We estimate that SST at nesting sites will rise by an average of 0.6°C (standard deviation = 0.9°C, n = 58) when we model a 1.5°C rise in SST combined with a best-case-scenario shift in nesting. Since sea turtles exhibit temperature-dependent sex determination, these temperature rises could lead to increasingly female-biased sex ratios as well as reduced hatchling production at sites across the world. These findings underscore concerns for the long-term survival of this iconic group.
Keywords: climate change adaptation, marine turtles, climatology, conservation, endangered species
1. Introduction
The pace at which animals respond and adapt to climate change may be central to their survival [1,2]. There are different means by which species may adapt to a changing environment. For example, rapid evolutionary change offers potential for adaptation for species with short-generation times, such as some plankton [3]. However, when generation times are longer (e.g. several decades), rapid genetic adaptations in the face of climate change are unlikely [4]. Range changes offer another way to adapt to a changing climate and have been seen widely across diverse taxa such as butterflies, plankton, birds and amphibians [5]. For species that are vulnerable to climate change but are unable to undergo rapid genetic adaptation or to change their range, other adaptive measures are needed to avoid local extinctions.
Of the seven extant sea turtle species, six appear on the IUCN Red List of Threatened Species (www.iucnredlist.org): greens (Chelonia mydas, globally endangered), hawksbills (Eretmochelys imbricata, globally critically endangered), Kemp's ridleys (Lepidochelys kempii, globally critically endangered), leatherbacks (Dermochelys coriacea, globally vulnerable), loggerheads (Caretta caretta, globally vulnerable) and olive ridleys (Lepidochelys olivacea, globally vulnerable). Flatbacks (Natator depressus) are classified as ‘data deficient’. Climate change is impacting sea turtles in a number of ways throughout their life cycle [6]. Potential impacts range from the loss of nesting beaches due to sea-level rise and increased erosion [7] to changes in oceanic distribution due to the alteration of wind patterns and ocean currents [8]. Increased exposure to extreme thermal events (e.g. marine or air heatwaves) may also impact sea turtle foraging grounds and threaten their reproductive output [9,10]. Sea turtles have also long been considered to be at high risk from climate warming since they have temperature-dependent sex determination [11–13]. Adult females nest on beaches across the world in the tropical, sub-tropical and temperate zones [14]. They lay their eggs in nest chambers dug several tens of centimetres deep and then cover their eggs with sand. No parental care is given thereafter. Incubation typically lasts between 40 and 80 days, depending on the species and incubation temperature (e.g. [15]). Females are produced at warmer incubation temperatures [16], and so there is concern that climate warming might cause the production of highly female-skewed hatchling cohorts, which could ultimately lead to population extinction [6,17]. In addition, lower hatch success at high incubation temperatures threatens population survival [18–20]. Currently across species, most sea turtle nesting beaches around the globe produce hatchling sex ratios that are already heavily female-biased [21]. Recently, the largest green sea turtle rookery in the world was shown to be extremely female-biased [22,23].
Sea turtles have long generation times (several decades), which precludes rapid evolution of the pivotal temperature for sex determination as a means to adapt to climate change. In addition, females exhibit tight fidelity to their nesting area [24], which suggests turtles cannot readily change their range to accommodate warming temperatures [25]. Because of this tight natal fidelity and long generation time, phenological shifts in nesting (i.e. changes in the timing of nesting events) have been widely proposed as the most likely means by which sea turtles could adapt to warming temperatures [26–28]. Marked phenological changes have been observed widely across taxa (e.g. insects, amphibians and birds; [29,30]) and with sea turtles there is empirical evidence that warming temperatures can result in earlier nesting [26,27,31]. However, it is not known if the rate of phenological shifting is sufficient to mitigate future climate warming across species and populations. Here, we investigate how the thermal niche used by sea turtles is likely to change with a combination of climate warming and shifts in nesting phenology. In short, we define the current thermal niche sea turtles use at 58 rookeries across the world and project how these thermal niches would change under a scenario in which sea surface temperatures (SST) rise and turtles nest earlier in the year. We define the thermal niche turtles use with SST measurements recorded adjacent to their nesting beaches.
Previous studies have modelled how SST are likely to vary at different breeding sites within a specified timeframe (e.g. 50, 100 or 200 years) and under various climate warming scenarios (e.g. [28,32]). Here, we present a different conceptual approach and propose the question: can see turtles adapt to a 1.5°C increase in SST by shifting their nesting season to a cooler time of the year? In this manner, we consider whether phenological shifts in nesting could preserve the current thermal niche for sea turtles around the world, regardless of which climate warming scenario is followed. We projected a 1.5°C increase in SST, as this warming is very likely to happen before the end of the century (e.g. under ‘Middle of the Road’ scenario SSP2–4.5 it is projected that SST will increase by 1–4°C globally by 2081–2100 relative to 1850–1900; [33,34]).
2. Material and methods
2.1. Conceptual framework
We conceptualized how rising SST and a shift in nesting phenology might interact to impact future conditions (figure 1). Here we describe the conceptual framework in four steps. Details for different steps are given thereafter in §2.2.
-
1.
We consider a seasonal cycle of SST adjacent to a sea turtle nesting area.
-
2.
We increase the SST at each site by 1.5°C.
-
3.
We shift the nesting phenology forward by 27 days (i.e. the most extreme phenological shift reported in the literature for a 1.5°C rise in SST).
-
4.
We observe the difference between the projected and current SST during peak nesting season. If this value is less than 1.5°C we consider that part (or all) of the warming was mitigated due to the phenological shift (figure 1).
Figure 1.
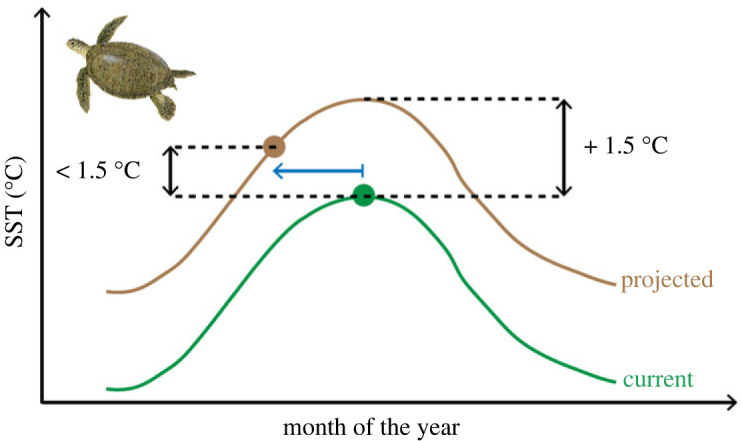
Conceptual framework for how a rise in SST may be mitigated by a phenological shift of the nesting season. The green and brown lines represent the current and projected SST. The filled circles represent the peak of the sea turtle nesting season. In this case, a projected 1.5°C rise in SST translates to less than 1.5°C rise in SST during peak nesting season due to a phenological shift to earlier nesting (blue arrow). The turtle image was kindly provided by NOAA Fisheries (www.fisheries.noaa.gov).
This combination of increased SST and phenological shift in nesting can potentially lead to an increase, decrease or no change in SST, depending on the nature of the seasonal change in SST and nesting seasonality. Using this conceptual framework, we parameterized the interaction of climate warming and a phenological shift in nesting for 58 sites around the world (figures 2–4).
Figure 2.
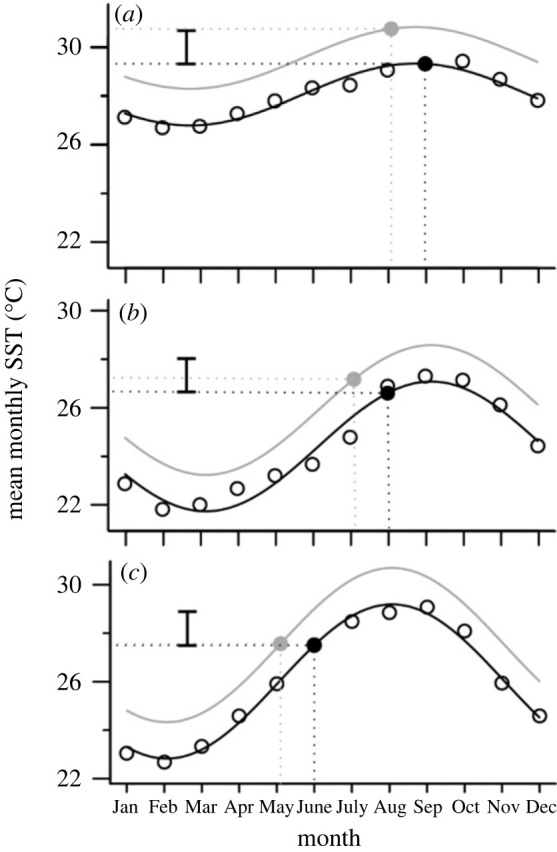
Phenological shifts of the nesting season have variable impacts at different sites. We modelled how a 1.5°C rise in SST combined with a 27-day advance of the nesting season would impact SST at 58 sea turtle nesting sites. Here we highlight three case examples: (a) On Saint Eustatius in the Caribbean, a shift of the nesting season does not mitigate any warming SST. (b) On Sal in the Northeast Atlantic, a shift of the nesting season mitigates approximately 60% of a 1.5°C rise in SST. (c) In Florida in the Northwest Atlantic (c), almost 100% of warming is mitigated by a best-case-scenario phenological shift. Open circles represent mean monthly SST and the black line represents the sine fit. The grey line represents projected conditions after a 1.5°C rise in SST. The filled circles represent a month during the peak of the nesting season in their respective scenarios. For easy comparison between subpanels, the vertical bars represent 1.5°C. The geographical location of these three study sites is highlighted in figure 3.
Figure 4.
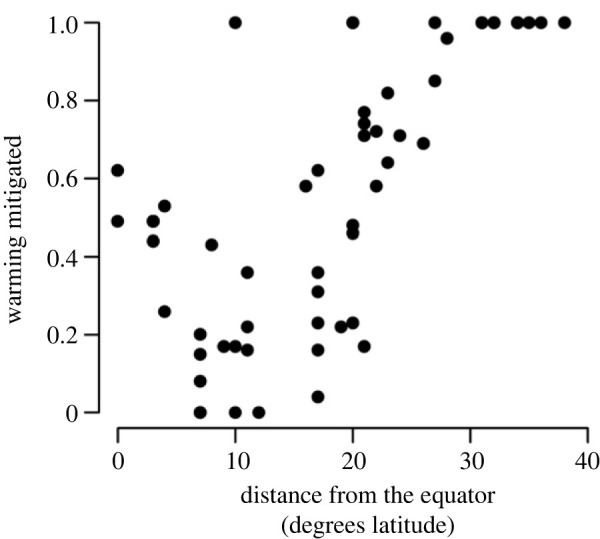
Phenological shifts in nesting at sites farthest from the equator have more impact on mitigating warming SST. The proportion of warming that was mitigated is plotted across sites. A 27-day shift in nesting in response to a 1.5°C rise in SST was most effective at maintaining current SST at sites greater than 30° latitude
2.2. Empirical datasets
2.2.1. Sea surface temperature
We obtained SST from the International Comprehensible Ocean-Atmosphere Data Set (ICOADS) through the National Center for Atmospheric Research (http://rda.ucar.edu/datasets/ds540.1/). The ICOADS is an extensive surface marine dataset compiled from different monitoring systems, including coastal meteorological stations, moored buoys, research vessels and surface drifters. We used the Enhanced ICOADS Monthly Summary Statistics Release 3.0.0 to obtain SST for the 2° by 2° quadrats that encompass relevant sea turtle nesting sites (i.e. the selected quadrats contained the nesting beaches as well as the area adjacent to the beaches). If a turtle rookery consisted of more than one nesting beach, we used the nesting beach with the largest turtle aggregation as the reference point around which to place the quadrat (electronic supplementary material, table S1). We used mean monthly SST recorded between January 2009 and December 2019 to describe recent annual fluctuations in SST at each nesting site. A sine function was fitted to these mean monthly SST to model year-round SST (figure 2).
To model future climate warming, we increased modelled SST by 1.5°C (figure 1) since the Intergovernmental Panel on Climate Change (IPCC) warns that a 1.5°C increase in SST is very likely to happen before the end of the century [33,34]. We compared current SST experienced during the peak of the nesting season (see point 2.2.2 Nesting seasonality, below) to projected SST after a 1.5°C increase in SST and corresponding phenological shift to earlier nesting were modelled to establish if any warming was mitigated due to the phenological shift (figure 1).
2.2.2. Nesting seasonality
We extracted nesting seasonality data and coordinates of as many sea turtle rookeries as possible from literature sources (electronic supplementary material, table S2). Sources included research articles published in peer-reviewed journals, reports from the International Union for Conservation of Nature and Natural Resources (www.iucn.org) and reports published by The State of the World's Sea Turtles (www.seaturtlestatus.org). When different seasonality information was given for different sites, we used the most recent source. We searched for data for all seven extant sea turtle species—flatbacks, greens, hawksbills, Kemp's ridleys, leatherbacks, loggerheads and olive ridleys—including small nesting aggregations (e.g. leatherbacks nesting in Saint Eustatius, the Caribbean) as well as some of the world's largest rookeries (e.g. greens nesting in Raine Island, South Pacific). If the peak of the nesting season was not given in the publication, we assumed that the peak occurred in the middle of the nesting season, since sea turtle nesting seasons generally follow a relatively symmetric bell-shaped pattern [35].
We defined the nesting seasonality and SST for 62 nesting sites around the world, including all seven species of sea turtles (electronic supplementary material, table S2). A sine function fitted to mean monthly SST recorded between January 2009 and December 2019 described annual fluctuations in SST well at 58 out of the 62 nesting sites (i.e. the model's p-value was less than 0.05; electronic supplementary material, figure S1). We excluded from our analysis the four sites with a poor model fit (i.e. four out of 62 sites). We checked normality of the residuals through visual inspection of the residual plots. Inter-annual variability was homogeneous between months and so did not affect the model's output.
2.2.3. Phenological changes
We searched the literature for publications that report phenological shifts in nesting sea turtles (electronic supplementary material, table S3). We entered the search terms ‘phenological shift’ and ‘sea turtle’ as TOPIC in Web of Science (apps.webofknowledge.com). We did a backward and a forward citation search on relevant articles to find further articles. To provide the most optimistic scenario for how a phenological shift in nesting might help mitigate climate warming, we used the most extreme published relationship for the link between SST and nesting dates—an 18-day advance in nesting per 1°C increase in SST reported for loggerheads (electronic supplementary material, table S3), which translates into a 27-day advance of the nesting season for a 1.5°C rise in SST in our study.
3. Results
3.1. Sea surface temperature and nesting seasonality
In the majority of cases, sea turtles nest during the warmer months of the year (electronic supplementary material, figure S1). The northernmost nesting sites in our study were Zakynthos in Greece and Fethiye in Turkey, and the southernmost nesting site were KwaZulu-Natal in South Africa and Dirk Hartog Island in Australia (figure 3). 25 of the sites used in our study are loggerhead nesting sites, ten are leatherback sites, seven are green sites, six are hawksbills, six are olive ridley sites, three are flatbacks, and one is a Kemp's ridley nesting site (i.e. the only nesting site colonized without human intervention; figure 3).
Figure 3.

Global patterns for the interaction of rising SST and shifting nesting phenology. We show how a 27-day shift of the nesting in response to a 1.5°C rise in SST would affect SST at all 58 sites used in our study. The filled slice of each pie chart represents the proportion of the 1.5°C rise in SST that occurred, such that a completely full pie indicates that no warming is mitigated. Colours represent the different turtle species. The sites highlighted in figure 2 are indicated here: (a) Saint Eustatius (the Netherlands) in the Caribbean, (b) Sal (Cape Verde) in the Northeast Atlantic and (c) Florida (United States of America) in the Northwest Atlantic.
3.2. Phenological changes
We found 18 relationships between SST and phenological shift from nine publications (electronic supplementary material, table S3). Relationships were given for loggerhead, leatherback and green turtles nesting at seven different sites. The longest study period was 25 years on loggerheads nesting on Zakynthos, Greece, between 1984 and 2009 [36]. The most extreme phenological change observed was an 18-day advance in nesting per 1°C increase in SST and was reported at two sites: Zakynthos, Greece [37] and Bald Head Island, United States of America [38]. We used this value to present the most optimistic scenario for how a phenological shift in nesting might help mitigate climate warming. In our study, since we are projecting a 1.5°C rise in SST, the resulting best-case-scenario phenological shift would be of 27 days.
3.3. Warming mitigated
The interaction of a 1.5°C warming and a 27-day phenological shift in nesting was variable across sites (figures 2–4). For example, a 27-day advance of the nesting season was unable to mitigate 1.5°C SST warming on Saint Eustatius (in the Caribbean; figure 2a). By contrast, on Sal (in the Northeast Atlantic), the same phenological shift in nesting mitigated 62% of a 1.5°C rise in SST (figure 2b). In Florida (Northwest Atlantic), nearly all warming was avoided by the same phenological shift (figure 2c). Note that we are referring here to the Peninsular Florida subpopulation (a loggerhead subpopulation defined by Loggerhead Turtle Expert Working Group), which includes nesting beaches that are geographically close and have the same nesting season ([39]; electronic supplementary material, table S1).
Rising SST were entirely mitigated by phenological shifts at 14 sites, while at four sites no warming was mitigated (figure 3). For all 58 sites, phenological shifts mitigated on average 55% of warming SST (standard deviation = 34%, min = 0, max = 100, n = 58; electronic supplementary material, table S4).
In addition, we found a broad latitudinal effect (logistic fit, p < 0.05, r2 = 0.49, n = 58), with phenological shifts at higher latitudes having more impact on mitigating warming temperatures (figure 4). This effect likely occurs because of the more marked seasonality in SST at higher latitudes (electronic supplementary material figure S1).
4. Discussion
Climate change is having many ecological impacts, including changes in species ranges and the phenology of seasonal events such as migration and breeding [30,40,41]. While many of these changes are well described, much less clear is whether taxa can preserve their current thermal niche through the interaction of rising temperatures with changes in range or phenology [42,43]. Yet the outcome of this interaction may have strong implications for species survival, particularly when species are already threatened by various anthropogenic impacts such as habitat loss and harvesting. Our findings suggest that, all else being equal, even the maximum reported rate of phenological shift in nesting will often not be enough for sea turtles to fully mitigate rising temperatures occurring as part of climate change. Our results extend and reiterate the conclusions from previous studies at a few key sites [28,44]. Here we offer a global view of this research topic that includes all seven species of sea turtles. Additionally, a result emerging from our analysis is that the impact of a phenological shift in nesting will vary around the world, and that at higher latitudes more of the future rises in SST will likely be mitigated by phenological changes. Taken together, a key message is that we cannot assume that turtles nesting around the world will always be able to naturally mitigate climate warming impacts by a phenological shift in nesting.
Most concerning is that we explored a best-case-scenario, so it is likely that sea turtles have less adaptive potential than presented here. We likely provide an overly optimistic view of the impact of a shift in nesting, since we used the maximum reported rate for this phenological shift. Running the same analysis using the average phenological shift reported in the literature (i.e. a 9-day advance in nesting per °C increase in SST; electronic supplementary material, table S3) reveals that SST at nesting sites will rise by an average 1.0°C (standard deviation = 0.4°C, n = 58). Using a 4-day advance in nesting per °C increase in SST (as reported in 2009 by [45]) results in SST rising by an alarming 1.4°C (standard deviation = 0.1°C, n = 58).
It may be that different species of sea turtles are not able to respond to warming temperatures in the same way. Relationships between phenological shifts in relation to sea surface temperatures were available from seven different sea turtle nesting sites (electronic supplementary material, table S3) but only for three species (i.e. loggerheads, leatherbacks and greens). Furthermore, at some sites there was no evidence for earlier initiation of the nesting in response to warmer temperatures [46]. More data are needed to better inform how different species are likely to fare in the face of climate warming. In addition, some sea turtle populations already nest at the coolest time of the year (e.g. flatback turtles nesting at Cape Domett in Australia; [47]) so a shift in the phenology of nesting will not mitigate increases in SST at these nesting locations. Indeed, a shift in phenology of nesting—if it occurred—would increase temperatures even more.
Rising SST are a threat to sea turtles because of the close relationship between SST and sand temperature, i.e. the environment in which sea turtle eggs incubate. Previous work has shown that SST and air temperature (AT) measured over large scales near nesting sites are tightly correlated with sand temperature at nest depths [48–51]. More recently it was shown that the gradients of these relationships are consistent across sites, and that for every 1°C increase in AT, sand temperature at nest depth increases by an average 0.86°C (standard deviation = 0.26°C, n = 36; [52]). Similarly, for every 1°C increase in SST, sand temperature increases by an average 0.72–0.83°C [48,52]. In other words, because of the tight positive relationship between SST and sand temperature it is very likely that if SST rises at one site, so will sand temperature at nest depth. In general terms, a 1.5°C rise in SST—as modelled in our analyses—would translate into approximately 1.1°C rise in sand temperatures at nest depth, although the absolute values are likely to vary slightly between sites. Due to the steep relationship between incubation temperature and hatchling sex ratio [53], a 1.1°C difference in nest temperature can be the difference between an all-male and an all-females nest, so 1.1°C is not a negligible value.
At sites around the world, it will be important to maintain empirical measurements to detect climate warming impacts on incubation conditions and so we emphasize the importance of long-term monitoring as is done in many ecosystems [54]. There are various ways in which the signs of excessive feminization might be detected. First, direct measurements of hatchling sex ratios or sand temperature at nest depths may show long-term feminization or warming respectively. Since direct measurements of sex ratios are fatal, an alternative is to estimate hatchling sex ratios using temperature-based models [55]. At sites where long-term measurements of sex ratios are not available, indications of warming might still be evident since very female-biased hatching sex ratios are accompanied by high in-nest embryo mortality [19,56] and lower hatchling quality [57–59]. Consequently, simple measures such as hatchling success (the proportion of eggs developing into hatchlings) may provide an alert to feminization that could then be substantiated by targeted measurements of hatchling sex ratios.
Because of the negative effects of warming temperatures on hatchling production and sex ratios, methods to reduce sand temperatures at nesting beaches are being explored. Strategies to artificially cool nests, such as through shading or watering, have already been trialled on different nesting beaches and offer promising results [20,60–62]. For example, shading was shown to decrease sand temperatures by an average 0.60°C on a nesting beach in Saint Eustatius (figure 2; [60]). Similarly, irrigating artificial green sea turtle nests with seawater or freshwater resulted in an immediate 1.3°C drop in nest temperatures on Heron Island (Australia; [63]). Such strategies could be implemented at sites where excessive feminization or hatchling mortality is occurring but require careful consideration. For example, there are concerns that lowering nest temperatures would alter sex ratios in a detrimental way, since having fewer females would reduce future population reproduction output [20,64]. Therefore these mitigation strategies should not only consider short-term benefits (e.g. increased hatchling production) but also promote positive long-term outcomes (e.g. population recovery or stability). Finally, it is important to note that such mitigation strategies would only offer a temporary ‘Band-Aid’ solution, as the underlying issues of climate change are not being addressed. Solutions to address climate change, like reducing greenhouse gas emissions, switching to renewable energies, and changing land-use patterns are required to reduce future climate change impacts.
There are clearly caveats to any predictions for how ecosystems will change in the face of climate warming, and this applies universally and not just to SST as seen in our study [65–67]. Our methods could be refined in various ways, such as by considering likely temperatures across entire nesting seasons rather than at just one point. Access to local SST datasets with better resolution and accuracy could also improve the model's output. Since variability in thermal niches exists within nesting grounds, our broad approach could also be refined for sites with inter-annual and intra-beach temperature data available. There also remain a number of uncertainties for how climate change will impact temperatures at sea turtle nesting sites. For example, there are uncertainties for how patterns of rainfall will change in the future [68,69]. In some nesting sites it has been shown that heavy rainfall may be sufficient to cool the sand to the extent that more male hatchlings are produced [61,70,71], so one scenario is that increased heavy rainfall may help mitigate climate warming. Second, it is possible that sea turtles might colonize new cooler nesting sites in the future. Generally, turtles have tight fidelity to their natal nesting areas, with flipper tagging showing turtles returning to broadly the same area to nest [24,72]. However, occasional breakdowns in fidelity are recorded [73–75] with, exceptionally, turtles nesting at sites 100s of km apart (e.g. [76]). Furthermore, when nesting beaches become less suitable, e.g. through increased light pollution due to development or beach erosion, turtles may shift nesting to nearby beaches [77]. It is possible that these breakdowns in fidelity could have helped with adapting to past climatic cycles, as a species' range could have expanded and contracted spatially as groups or individuals departed from philopatry. However, it remains unknown if the speed at which new sites are colonized will be sufficient to prevent feminization in nesting populations in the face of warming.
Finally, climate warming may not apply equally across seasons [78,79] and so our calculations could be refined as more information emerges on likely site-specific changes in SST seasonality. Elegant mechanistic approaches have been used to assess the drivers of incubation temperatures [47,80] and although these models are still susceptible to uncertainties on how environmental conditions such as rainfall may change [6], they provide another approach to assessing likely future changes in temperatures at sea turtle nesting sites. While both correlative and mechanistic models produce very similar results [50,81], the mechanistic approach has the advantage that it can be forced with novel combinations of environmental variables to explore different climate change scenarios. Unfortunately, it was not possible to use microclimate models in our study since the input parameters (e.g. beach properties and local meteorological data) required to run the models were not available for all study sites. However, microclimate models offer great potential in this area and may help shed further light on expected changes in incubation temperatures in the face of climate warming [47,50].
Our approach to examine how phenological shifts could mitigate climate warming can be applied broadly to other species faced with adapting to climate change. For example, our methods could be applied to other organisms that exhibit temperature-dependent sex determination, such as crocodiles and tortoises [82]. Similarly, it would be possible to assess if the rate of phenological change some migratory species exhibit would allow them to maintain their thermal niche as seasonal cycles change [83]. Since the data needed to apply our methods— i.e. temperature records, nesting seasonality data, and phenological change rates—are often commonly monitored as part of conservation and research, applying our methods could be easily done for a wide range of study organisms.
While uncertainties remain for the likely impacts of climate warming on sea turtles, our results add to the growing evidence that a phenological shift in nesting will often be insufficient, by itself, to maintain current thermal conditions [28,44]. Future work might consider how a range of processes (e.g. geographical range shifts) may buffer climate-warming impacts for sea turtles.
Data accessibility
The data are provided in electronic supplementary material [84].
Authors' contributions
J-O.L.: conceptualization, data curation, formal analysis, investigation, methodology, visualization, writing—original draft, writing—review and editing; G.H.: conceptualization, formal analysis, funding acquisition, investigation, methodology, visualization, writing—original draft, writing—review and editing.
All authors gave final approval for publication and agreed to be held accountable for the work performed therein.
Conflict of interest declaration
The authors declare no conflict.
Funding
This work was supported by the Bertarelli Foundation as part of the Bertarelli Programme in Marine Science (grant no. BPMS-2017-4).
References
- 1.Urban MC. 2015. Accelerating extinction risk from climate change. Science 348, 571-573. ( 10.1126/science.aaa4984) [DOI] [PubMed] [Google Scholar]
- 2.Jezkova T, Wiens JJ. 2016. Rates of change in climatic niches in plant and animal populations are much slower than projected climate change. Proc. R. Soc. B 283, 20162104. ( 10.1098/rspb.2016.2104) [DOI] [PMC free article] [PubMed] [Google Scholar]
- 3.O'Dea SA, Gibbs SJ, Bown PR, Young JR, Poulton AJ, Newsam C, Wilson PA. 2014. Coccolithophore calcification response to past ocean acidification and climate change. Nat. Commun. 5, 5363-5369. ( 10.1038/ncomms6363) [DOI] [PMC free article] [PubMed] [Google Scholar]
- 4.Pörtner HO, Farrell AP. 2008. Physiology and climate change. Science 322, 690-692. ( 10.1126/science.1163156) [DOI] [PubMed] [Google Scholar]
- 5.Parmesan C, et al. 1999. Poleward shifts in geographical ranges of butterfly species associated with regional warming. Nature 399, 579-583. ( 10.1038/21181) [DOI] [Google Scholar]
- 6.Patrício AR, Hawkes LA, Monsinjon JR, Godley BJ, Fuentes MMPB. 2021. Climate change and marine turtles: recent advances and future directions. Endang. Species Res. 44, 363-395. ( 10.3354/esr01110) [DOI] [Google Scholar]
- 7.Varela MR, et al. 2019. Assessing climate change associated sea-level rise impacts on sea turtle nesting beaches using drones, photogrammetry and a novel GPS system. Glob. Change Biol. 25, 753-762. ( 10.1111/gcb.14526) [DOI] [PubMed] [Google Scholar]
- 8.Poloczanska ES, Limpus CJ, Hays GC. 2009. Vulnerability of marine turtles to climate change. Adv. Mar. Biol. 56, 151-211. ( 10.1016/S0065-2881(09)56002-6) [DOI] [PubMed] [Google Scholar]
- 9.Turkozan O, Almpanidou V, Yılmaz C, Mazaris AD. 2021. Extreme thermal conditions in sea turtle nests jeopardize reproductive output. Climat. Change 167, 30. ( 10.1007/s10584-021-03153-6) [DOI] [Google Scholar]
- 10.Konsta A, et al. 2022. Marine heatwaves threaten key foraging grounds of sea turtles in Southeast Asian Seas. Reg. Environ. Change 22, 97. ( 10.1007/s10113-022-01952-w) [DOI] [Google Scholar]
- 11.Hamann M, Fuentes MMPB, Ban NC, Mocellin VJL. 2013. Climate change and marine turtles. In The biology of Sea turtles (eds Wyneken J, Lohmann KJ, Musick JA), pp. 353-358. Boca Raton, FL: CRC Press. [Google Scholar]
- 12.Butler CJ. 2019. A review of the effects of climate change on chelonians. Diversity 11, 138. ( 10.3390/d11080138) [DOI] [Google Scholar]
- 13.Godley BJ, et al. 2020. Reflections on sea turtle conservation. Oryx 54, 287-289. ( 10.1017/S0030605320000162) [DOI] [Google Scholar]
- 14.Spotila JR. 2004. Sea turtles: a complete guide to their biology, behavior, and conservation, 227 pp. Baltimore, MD: The John Hopkins University Press. [Google Scholar]
- 15.Matsuzawa Y, Sato K, Sakamoto W, Bjorndal KA. 2002. Seasonal fluctuations in sand temperature: effects on the incubation period and mortality of loggerhead sea turtle (Caretta caretta) pre-emergent hatchlings in Minabe, Japan. Mar. Biol. 140, 639-646. ( 10.1007/s00227-001-0724-2) [DOI] [Google Scholar]
- 16.Yntema CL, Mrosovsky N. 1982. Critical periods and pivotal temperatures for sexual differentiation in loggerhead sea turtles. Can. J. Zool. 60, 1012-1016. ( 10.1139/z82-141) [DOI] [Google Scholar]
- 17.Booth DT, Dunstan A, Bell I, Reina R, Tedeschi J. 2020. Low male production at the world's largest green turtle rookery. Mar. Ecol. Prog. Ser. 653, 181-190. ( 10.3354/meps13500) [DOI] [Google Scholar]
- 18.Laloë J-O, Cozens J, Renom B, Taxonera A, Hays GC. 2017. Climate change and temperature-linked hatchling mortality at a globally important sea turtle nesting site. Glob. Change Biol. 23, 4922-4931. ( 10.1111/gcb.13765) [DOI] [PubMed] [Google Scholar]
- 19.Morales Mérida A, Helier A, Cortés-Gómez AA, Girondot M. 2021. Hatching success rather than temperature-dependent sex determination as the main driver of olive ridley (Lepidochelys olivacea) nesting activity in the Pacific coast of Central America. Anim. 11, 3168. ( 10.3390/ani11113168) [DOI] [PMC free article] [PubMed] [Google Scholar]
- 20.Santidrián Tomillo P, Wallace BP, Paladino FV, Spotila JR, Genovart M. 2021. Short-term gain, long-term loss: how a widely-used conservation tool could further threaten sea turtles. Biol. Cons. 261, 109260. ( 10.1016/j.biocon.2021.109260) [DOI] [Google Scholar]
- 21.Hays GC, Mazaris AD, Schofield G. 2014. Different male vs. female breeding periodicities help mitigate offspring sex ratios skews in sea turtles. Front. Mar. Sci. 1, 43. ( 10.3389/fmars.2014.00043) [DOI] [Google Scholar]
- 22.Jensen MP, Allen CD, Eguchi T, Bell IP, LaCasella EL, Hilton WA, Hof CA, Dutton PH. 2018. Environmental warming and feminization of one of the largest sea turtle populations in the world. Curr. Biol. 28, 154-159. ( 10.1016/j.cub.2017.11.057) [DOI] [PubMed] [Google Scholar]
- 23.Jensen MP, Eguchi T, FitzSimmons NN, McCarthy MA, Fuentes MM, Hamann M, Limpus CJ, Bell IP, Read MA. 2022. Integrating climate change and management scenarios in population models to guide the conservation of marine turtles. Bull. Mar. Sci. 98, 131-154. ( 10.5343/bms.2021.0033) [DOI] [Google Scholar]
- 24.Meylan AB, Bowen BW, Avise JC. 1990. A genetic test of the natal homing versus social facilitation models for green turtle migration. Science 248, 724-727. ( 10.1126/science.2333522) [DOI] [PubMed] [Google Scholar]
- 25.Schroth W, Streit B, Schierwater B. 1996. Evolutionary handicap for turtles. Nature 384, 521-522. ( 10.1038/384521a0) [DOI] [Google Scholar]
- 26.Weishampel JF, Bagley DA, Ehrhart LM. 2004. Earlier nesting by loggerhead sea turtles following sea surface warming. Glob. Change Biol. 10, 1424-1427. ( 10.1111/j.1529-8817.2003.00817.x) [DOI] [Google Scholar]
- 27.Mazaris AD, Kallimanis AS, Pantis JD, Hays GC. 2013. Phenological response of sea turtles to environmental variation across a species' northern range. Proc. R. Soc. B 280, 20122397. ( 10.1098/rspb.2012.2397) [DOI] [PMC free article] [PubMed] [Google Scholar]
- 28.Monsinjon JR, et al. 2019. The climatic debt of loggerhead sea turtle populations in a warming world. Ecol. Indic. 107, 105657. ( 10.1016/j.ecolind.2019.105657) [DOI] [Google Scholar]
- 29.Parmesan C, Yohe G. 2003. A globally coherent fingerprint of climate change impacts across natural systems. Nature 421, 37-42. ( 10.1038/nature01286) [DOI] [PubMed] [Google Scholar]
- 30.Charmantier A, Gienapp P. 2014. Climate change and timing of avian breeding and migration: evolutionary versus plastic changes. Evol. Appl. 7, 15-28. ( 10.1111/eva.12126) [DOI] [PMC free article] [PubMed] [Google Scholar]
- 31.Mazaris AD, Kallimanis AS, Tzanopoulos J, Sgardelis SP, Pantis JD. 2009. Sea surface temperature variations in core foraging grounds drive nesting trends and phenology of loggerhead turtles in the Mediterranean Sea. J. Exp. Mar. Biol. Ecol. 379, 23-27. ( 10.1016/j.jembe.2009.07.026) [DOI] [Google Scholar]
- 32.Almpanidou, et al. 2008.
- 33.IPCC. 2018. Global warming of 1.5°C . In An IPCC special report on the impacts of global warming of 1.5°C above pre-industrial levels and related global greenhouse gas emission pathways, in the context of strengthening the global response to the threat of climate change, sustainable development, and efforts to eradicate poverty (eds Masson-Delmotte V, et al.), 32 pp. Geneva, Switzerland: World Meteorological Organization. [Google Scholar]
- 34.IPCC. 2021. Climate Change 2021: The Physical Science Basis. In Contribution of working group I to the sixth assessment report of the intergovernmental panel on climate change (eds Masson-Delmotte V, et al.), Cambridge, United Kingdom and New York, NY: Cambridge University Press. [Google Scholar]
- 35.Girondot M. 2010. Estimating density of animals during migratory waves: a new model applied to marine turtles at nesting sites. Endang. Species Res. 12, 95-105. ( 10.3354/esr00292) [DOI] [Google Scholar]
- 36.Patel SH, Morreale SJ, Saba VS, Panagopoulou A, Margaritoulis D, Spotila JR. 2016. Climate impacts on sea turtle breeding phenology in Greece and associated foraging habitats in the wider Mediterranean region. PLoS One 11, e0157170. ( 10.1371/journal.pone.0157170) [DOI] [PMC free article] [PubMed] [Google Scholar]
- 37.Mazaris AD, Kallimanis AS, Sgardelis SP, Pantis JD. 2008. Do long-term changes in sea surface temperature at the breeding areas affect the breeding dates and reproduction performance of Mediterranean loggerhead turtles? Implications for climate change. J. Exp. Mar. Biol. Ecol. 367, 219-226. ( 10.1016/j.jembe.2008.09.025) [DOI] [Google Scholar]
- 38.Hawkes LA, Broderick AC, Godfrey MH, Godley BJ. 2007. Investigating the potential impacts of climate change on a marine turtle population. Glob. Change Biol. 13, 1-10. ( 10.1111/j.1365-2486.2007.01320.x) [DOI] [Google Scholar]
- 39.TEWG. 2009. An assessment of the loggerhead turtle population in the western North Atlantic Ocean. NOAA Tech Memo NMFS-SEFSC-575. See www.sefsc.noaa.gov/seaturtletechmemos.jsp
- 40.McCarty JP. 2001. Ecological consequences of recent climate change. Cons. Biol. 15, 320-331. ( 10.1046/j.1523-1739.2001.015002320.x) [DOI] [Google Scholar]
- 41.Kubelka V, Sandercock BK, Székely T, Freckleton RP. 2021. Animal migration to northern latitudes: environmental changes and increasing threats. Trends Ecol. Evol. 37, 30-41. ( 10.1016/j.tree.2021.08.010) [DOI] [PubMed] [Google Scholar]
- 42.Both C, van Asch M, Bijlsma RG, van den Burg AB, Visser ME. 2009. Climate change and unequal phenological changes across four trophic levels: constraints or adaptations? J. Anim. Ecol. 78, 73-83. ( 10.1111/j.1365-2656.2008.01458.x) [DOI] [PubMed] [Google Scholar]
- 43.Chivers WJ, Walne AW, Hays GC. 2017. Mismatch between marine plankton range movements and the velocity of climate change. Nature Com. 8, 14434. ( 10.1038/ncomms14434) [DOI] [PMC free article] [PubMed] [Google Scholar]
- 44.Almpanidou V, Katragkou E, Mazaris AD. 2018. The efficiency of phenological shifts as an adaptive response against climate change: a case study of loggerhead sea turtles (Caretta caretta) in the Mediterranean. Mitig. Adapt. Strat. Glob. Change 23, 1143-1158. ( 10.1007/s11027-017-9777-5) [DOI] [Google Scholar]
- 45.Pike DA. 2009. Do green turtles modify their nesting seasons in response to environmental temperatures? Chelon. Cons. Biol. 8, 43-47. ( 10.2744/CCB-0726.1) [DOI] [Google Scholar]
- 46.Robinson NJ, et al. 2014. Multidecadal trends in the nesting phenology of Pacific and Atlantic leatherback turtles are associated with population demography. Endang. Species Res. 24, 197-206. ( 10.3354/esr00604) [DOI] [Google Scholar]
- 47.Stubbs JL, Kearney MR, Whiting SD, Mitchell NJ. 2014. Models of primary sex ratios at a major flatback turtle rookery show an anomalous masculinising trend. Clim. Change Responses 1, 1-8. ( 10.1186/s40665-014-0003-3) [DOI] [Google Scholar]
- 48.Fuentes MMPB, Maynard JA, Guinea M, Bell IP, Werdell PJ, Hamann M. 2009. Proxy indicators of sand temperature help project impacts of global warming on sea turtles in northern Australia. Endang. Species Res. 9, 33-40. ( 10.3354/esr00224) [DOI] [Google Scholar]
- 49.Esteban N, Laloë J-O, Mortimer JA, Guzman AN, Hays GC. 2016. Male hatchling production in sea turtles from one of the world's largest marine protected areas, the Chagos Archipelago. Sci. Rep. 6, 1-8. ( 10.1038/srep20339) [DOI] [PMC free article] [PubMed] [Google Scholar]
- 50.Bentley BP, Kearney MR, Whiting SD, Mitchell NJ. 2020. Microclimate modelling of beach sand temperatures reveals high spatial and temporal variation at sea turtle rookeries. J. Therm. Biol. 88, 102522. ( 10.1016/j.jtherbio.2020.102522) [DOI] [PubMed] [Google Scholar]
- 51.Hays GC, Chivers WJ, Laloë J-O, Sheppard C, Esteban N. 2021. Impact of marine heatwaves for sea turtle nest temperatures. Biol. Lett. 17, 20210038. ( 10.1098/rsbl.2021.0038) [DOI] [PMC free article] [PubMed] [Google Scholar]
- 52.Laloë J-O, Chivers WJ, Esteban N, Hays GC. 2021. Reconstructing past thermal conditions in beach microclimates. Glob. Change Biol. 00, 1-10. ( 10.1111/gcb.15903) [DOI] [PubMed] [Google Scholar]
- 53.Bentley BP, Stubbs JL, Whiting SD, Mitchell NJ. 2020. Variation in thermal traits describing sex determination and development in Western Australian sea turtle populations. Funct. Ecol. 34, 2302-2314. ( 10.1111/1365-2435.13645) [DOI] [Google Scholar]
- 54.Edwards M, Beaugrand G, Hays GC, Koslow JA, Richardson AJ. 2010. Multi-decadal oceanic ecological datasets and their application in marine policy and management. Trends Ecol. Evol. 25, 602-610. ( 10.1016/j.tree.2010.07.007) [DOI] [PubMed] [Google Scholar]
- 55.Fuentes MMPB, Monsinjon J, Lopez M, Lara P, Santos A, dei Marcovaldi MA, Girondot M. 2017. Sex ratio estimates for species with temperature-dependent sex determination differ according to the proxy used. Ecol. Mod. 365, 55-67. ( 10.1016/j.ecolmodel.2017.09.022) [DOI] [Google Scholar]
- 56.Hays GC, Mazaris AD, Schofield G, Laloë J-O. 2017. Population viability at extreme sex-ratio skews produced by temperature-dependent sex determination. Proc. R. Soc. B 284, 20162576. ( 10.1098/rspb.2016.2576) [DOI] [PMC free article] [PubMed] [Google Scholar]
- 57.Booth DT, Evans A. 2011. Warm water and cool nests are best. How global warming might influence hatchling green turtle swimming performance. PLoS ONE 6, e23162. ( 10.1371/journal.pone.0023162) [DOI] [PMC free article] [PubMed] [Google Scholar]
- 58.Booth DT. 2017. Influence of incubation temperature on sea turtle hatchling quality. Integr. Zool. 12, 352-360. ( 10.1111/1749-4877.12255) [DOI] [PubMed] [Google Scholar]
- 59.Booth DT. 2018. Incubation temperature induced phenotypic plasticity in oviparous reptiles: where to next? J. Exp. Zool. Part A 329, 343-350. ( 10.1002/jez.2195) [DOI] [PubMed] [Google Scholar]
- 60.Esteban N, Laloë J-O, Kiggen FSPL, Ubels SM, Becking LE, Meesters EH, Berkel J, Hays GC, Christianen MJA. 2018. Optimism for mitigation of climate warming impacts for sea turtles through nest shading and relocation. Sci. Rep. 8, 17625. ( 10.1038/s41598-018-35821-6) [DOI] [PMC free article] [PubMed] [Google Scholar]
- 61.Staines MN, Booth DT, Hof CAM, Hays GC. 2020. Impact of heavy rainfall events and shading on the temperature of sea turtle nests. Mar. Biol. 167, 1-11. ( 10.14264/c90b3d0) [DOI] [Google Scholar]
- 62.Vindas-Picado J, Yaney-Keller A, Andrews LS, Panagopoulou A, Tomillo PS. 2020. Effectiveness of shading to mitigate the impact of high temperature on sea turtle clutches considering the effect on primary sex ratios. Mitig. Adapt. Strat. Glob. Change 25, 1509-1521. ( 10.1007/s11027-020-09932-3) [DOI] [Google Scholar]
- 63.Smith CE, Booth DT, Crosby A, Miller JD, Staines MN, Versace H, Madden-Hof CA. 2021. Trialling seawater irrigation to combat the high nest temperature feminisation of green turtle Chelonia mydas hatchlings. Mar. Ecol. Prog. Ser. 667, 177-190. ( 10.3354/meps13721) [DOI] [Google Scholar]
- 64.Mrosovsky N, Yntema CL.1980. Temperature dependence of sexual differentiation in sea turtles: implications for conservation practices. Biol. Cons. 18, 271-280. ( 10.1016/0006-3207(80)90003-8) [DOI] [Google Scholar]
- 65.Knutti R. 2008. Should we believe model predictions of future climate change? Phil. Trans. R. Soc. A 366, 4647-4664. ( 10.1098/rsta.2008.0169) [DOI] [PubMed] [Google Scholar]
- 66.Knutti R, Sedláček J. 2013. Robustness and uncertainties in the new CMIP5 climate model projections. Nat. Clim. Change 3,369-373. ( 10.1038/nclimate1716) [DOI] [Google Scholar]
- 67.Rangwala I, Moss W, Wolken J, Rondeau R, Newlon K, Guinotte J, Travis WR. 2021. Uncertainty, complexity and constraints: how do we robustly assess biological responses under a rapidly changing climate? Climate 9, 177. ( 10.3390/cli9120177) [DOI] [Google Scholar]
- 68.Hawkins E, Sutton R. 2011. The potential to narrow uncertainty in projections of regional precipitation change. Clim. Dyn. 37, 407-418 ( 10.1007/s00382-010-0810-6) [DOI] [Google Scholar]
- 69.Pendergrass AG, Knutti R, Lehner F, Deser C, Sanderson BM. 2017. Precipitation variability increases in a warmer climate. Sci. Rep. 7, 17966 ( 10.1038/s41598-017-17966-y) [DOI] [PMC free article] [PubMed] [Google Scholar]
- 70.Houghton JDR, Myers AE, Lloyd C, King RS, Isaacs C, Hays GC. 2007. Protracted rainfall decreases temperature within leatherback turtle (Dermochelys coriacea) clutches in Grenada, West Indies: eEcological implications for a species displaying temperature dependent sex determination. J. Exp. Mar. Biol. Ecol. 345, 71-77. ( 10.1016/j.jembe.2007.02.001) [DOI] [Google Scholar]
- 71.Laloë J-O, Tedeschi JN, Booth DT, Bell I, Dunstan A, Reina RD, Hays GC. 2020. Extreme rainfall events and cooling of sea turtle clutches: implications in the face of climate warming. Ecol. Evol. 11, 560-565. ( 10.1002/ece3.7076) [DOI] [PMC free article] [PubMed] [Google Scholar]
- 72.Siegwalt F, et al. 2020. High fidelity of sea turtles to their foraging grounds revealed by satellite tracking and capture-mark-recapture: new insights for the establishment of key marine conservation areas. Biol. Cons. 250, 108742. ( 10.1016/j.biocon.2020.108742) [DOI] [Google Scholar]
- 73.Williams KL, Frick MG. 2008. Tag returns from loggerhead turtles from Wassaw Island, GA. Southeast. Nat. 7, 165-172. ( 10.1656/1528-7092(2008)7[165:TRFLTF[2.0.CO;2) [DOI] [Google Scholar]
- 74.Esteban N, Mortimer JA, Hays GC. 2017. How numbers of nesting sea turtles can be overestimated by nearly a factor of two. Proc. R. Soc. B 284, 20162581. ( 10.1098/rspb.2016.2581) [DOI] [PMC free article] [PubMed] [Google Scholar]
- 75.Pfaller JB, et al. 2022. One beach amongst many: how weak fidelity to a focal nesting site can bias demographic rates in marine turtles. Mar. Biol. 169, 1-7. ( 10.1007/s00227-021-03991-z) [DOI] [Google Scholar]
- 76.Le Gall J-Y, Hughes GR.. 1987. Migrations de la tortue verte Chelonia mydas dans l'Océan Indien Sud-Ouest observées à partir des marquages sur les sites de ponte Europa et Tromelin (1970–1980). Amphib.-Reptil. 8, 272-282. ( 10.1163/156853887X00315) [DOI] [Google Scholar]
- 77.Pradhan UK, Mohanty PK, Mishra P. 2022. Coastal erosion: a threat to sea turtle nesting habitat, east coast of India. Rend. Lincei Sci. Fis. Nat. 25, 1-5. ( 10.1007/s12210-022-01046-z) [DOI] [Google Scholar]
- 78.Harding KJ, Snyder PK. 2014. Examining future changes in the character of Central U.S. warm-season precipitation using dynamical downscaling. J. Geophys. Res. Atmos. 119, 13 116-13 136. ( 10.1002/2014JD022575) [DOI] [Google Scholar]
- 79.Tabari H, Willems P. 2018. Seasonally varying footprint of climate change on precipitation in the Middle East. Sci. Rep. 8, 1-10. ( 10.1038/s41598-018-22795-8) [DOI] [PMC free article] [PubMed] [Google Scholar]
- 80.Fuentes MMPB, Porter WP. 2013. Using a microclimate model to evaluate impacts of climate change on sea turtles. Ecol. Mod. 251, 150-157. ( 10.1016/j.ecolmodel.2012.12.020) [DOI] [Google Scholar]
- 81.Kearney MR, Wintle BA, Porter WP. 2010. Correlative and mechanistic models of species distribution provide congruent forecasts under climate change. Cons. Lett. 3, 203-213. ( 10.1111/j.1755-263X2010.00097.x) [DOI] [Google Scholar]
- 82.Valenzuela N, Lance V. 2004. Temperature-dependent sex determination in vertebrates, 194 pp. Washington, DC: Smithsonian Books. [Google Scholar]
- 83.Mayor SJ, et al. 2017. Increasing phenological asynchrony between spring green-up and arrival of migratory birds. Sci. Rep. 7, 1. ( 10.1038/s41598-017-02045-z) [DOI] [PMC free article] [PubMed] [Google Scholar]
- 84.Laloë J-O, Hays GC. 2023. can a present-day thermal niche be preserved in a warming climate by a shift in phenology? A case study with sea turtles. Figshare. ( 10.6084/m9.figshare.c.6403882) [DOI] [PMC free article] [PubMed]
Associated Data
This section collects any data citations, data availability statements, or supplementary materials included in this article.
Data Citations
- Laloë J-O, Hays GC. 2023. can a present-day thermal niche be preserved in a warming climate by a shift in phenology? A case study with sea turtles. Figshare. ( 10.6084/m9.figshare.c.6403882) [DOI] [PMC free article] [PubMed]
Data Availability Statement
The data are provided in electronic supplementary material [84].