

Abstract
Successful eradication of the hepatitis C virus (HCV) cannot eliminate the risk of hepatocellular carcinoma (HCC). Next-generation RNA sequencing provides comprehensive genomic insights into the pathogenesis of HCC. Artificial intelligence has opened a new era in precision medicine. This study integrated clinical features and genetic biomarkers to establish a machine learning-based HCC model following viral eradication. A prospective cohort of 55 HCV patients with advanced fibrosis, who achieved a sustained virologic response after antiviral therapy, was enrolled. The primary outcome was the occurrence of HCC. The genomic signatures of peripheral blood mononuclear cells (PBMC) were determined by RNA sequencing at baseline and 24 weeks after end-of-treatment. Machine learning algorithms were implemented to extract the predictors of HCC. HCC occurred in 8 of the 55 patients, with an annual incidence of 2.7%. Pretreatment PBMC DEFA1B, HBG2, ADCY4, and posttreatment TAS1R3, ABCA3, and FOSL1 genes were significantly downregulated, while the pretreatment ANGPTL6 gene was significantly upregulated in the HCC group compared to that in the non-HCC group. A gene score derived from the result of the decision tree algorithm can identify HCC with an accuracy of 95.7%. Gene score = TAS1R3 (≥0.63 FPKM, yes/no = 0/1) + FOSL1 (≥0.27 FPKM, yes/no = 0/1) + ABCA3 (≥2.40 FPKM, yes/no = 0/1). Multivariate Cox regression analysis showed that this gene score was the most important predictor of HCC (hazard ratio = 2.38, 95% confidence interval [CI] = 1.06-5.36, P = 0.036). Combining the gene score and fibrosis-4 index, a nomogram was constructed to predict the probability of HCC with an area under the receiver operating characteristic curve up to 0.950 (95% CI = 0.888-1.000, P = 7.0 × 10⁻⁵). Decision curve analysis revealed that the nomogram had a net benefit in HCC detection. The calibration curve showed that the nomogram had optimal concordance between the predicted and actual HCC probabilities. In conclusion, down-regulated posttreatment PBMC TAS1R3, ABCA3, and FOSL1 expression were significantly correlated with HCC development after HCV eradication. Decision-tree-based algorithms can refine the assessment of HCC risk for personalized HCC surveillance.
Keywords: Hepatitis C virus (HCV), hepatocellular carcinoma (HCC), sustained virologic response (SVR), hepacivirus, machine learning (ML), artificial intelligence (AI)
Introduction
Hepatitis C virus (HCV) infection is a major cause of hepatocellular carcinoma (HCC). The annual incidence of HCC is 2-4% in HCV patients with advanced fibrosis [1]. Compared to conventional interferon (IFN)-based therapy, direct-acting antiviral agents (DAAs) have improved sustained virologic response (SVR) rates by up to 98% [2]. Antiviral therapy substantially reduced HCC risk, irrespective of whether IFN- or DAA-based regimens were used [3]. However, successful HCV eradication does not abrogate the occurrence of HCC. As the population of patients with SVR grows, the identification of individuals who maintain a high risk of HCC remains an unmet need.
Risk factors of post-SVR HCC include pre-existing advanced fibrosis, older age, and diabetes mellitus [4]. The risk of HCC could be affected by the pre-existing host background and adjusted by genetic signatures following HCV clearance. HCV protein elicits dysregulation of host cell cycle checkpoints and oxidative stress, which may lead to the accumulation of DNA damage in infected cells [5,6]. In addition, HCV-induced oncogenic transcriptome and epigenetic alterations may persist in the hepatocytes despite successful HCV eradication [7,8]. Advancements in next-generation sequencing (NGS) technology provide comprehensive genomic insights into the pathogenesis of HCC. Deep sequencing analysis has not only verified previously known mutations of TP53 and CTNNB1 in HCC, but also detected novel epigenetic modifiers [9]. Wnt signaling, cell cycle, and chromatin remodeling pathways have emerged as key oncogenic drivers in HCC [10,11].
Artificial intelligence (AI) has been widely applied in clinical diagnosis and disease classification. In contrast to traditional hypothesis-driven statistical methods, machine learning may use a hypothesis-free approach to classify clinical phenotypes [12]. Conventional regression models estimate the risk of HCC based on routinely available clinical parameters [4]. Machine learning algorithms can recognize hidden patterns within clinical information that are clearer than those derived from traditional statistical methods [13]. Common supervised machine-learning algorithms include decision trees, random forests, support vector machines, and artificial neural networks [14,15]. Decision trees classify the samples by sorting them from the root to leaf nodes until the maximal homogeneity of the subgroups is achieved. Random forest is composed of a collection of decision trees, and each tree is drawn from the bootstrap samples. Finally, it combines the outputs of multiple decision trees to integrate a single result. Artificial intelligence has opened a new era of precision medicine in the field of hepatology. It can assess individual HCC risk by unveiling the complex interactions between cancer predictors. Machine learning-based models can improve the accuracy of HCC prediction compared to that with conventional regression models [16].
The mechanisms underlying de novo HCC following HCV eradication remain unclear. To investigate the pathogenesis of post-SVR HCC, we analyzed the dynamic genetic signatures of patients with HCV after antiviral therapy. Here, we attempted to identify potential biomarkers associated with HCC after viral clearance. This study introduced a machine-learning-based model for the assessment of HCC risk for personalized surveillance.
Materials and methods
Subjects
A prospective cohort of treatment-naïve HCV patients with advanced fibrosis who achieved SVR after antiviral therapy at Kaohsiung Medical University Hospital was followed up from 2004 to 2021. Patients received either pegylated interferon α-2a (180 μg/week) plus weight-based ribavirin (1000 mg/day for weights <75 kg or 1200 mg/day for weights >75 kg) or interferon-free direct-acting antiviral agents (DAAs). The choice of antiviral regimens was based on the HCV treatment guidelines of the Asian Pacific Association for the Study of the Liver (APASL) and the reimbursement criteria of the National Health Insurance Administration in Taiwan. Patients with advanced fibrosis (F3/4) met any one of the following criteria: Fibrosis-4 (FIB-4) index >3.25, transient elastography (Fibroscan) >9.1 kPa, acoustic radiation force impulse elastography >1.81 m/sec, or histology-proven F3/4. The exclusion criteria included co-infection with hepatitis B or human immunodeficiency virus, history of the prior presence of HCC, decompensated liver cirrhosis, liver transplantation, malignancy, alcoholism, idiopathic hepatic fibrosis, and hepatic fibrosis caused by other secondary causes.
Outcome assessment
The primary outcome was de novo HCC occurrence after achieving sustained virologic response. Abdominal sonography and α-fetoprotein (AFP) testing were performed every six months for HCC surveillance during follow-up. Patients with HCC development within six months of the initiation of antiviral therapy were excluded. SVR was defined as undetectable HCV RNA in the serum 24 weeks after the completion of antiviral therapy. This study was approved by the Institutional Review Board of Kaohsiung Medical University Hospital and followed the tenets of the Declaration of Helsinki (KMUHIRB-E(I)-20180307). Written informed consent was obtained from all participants.
Next-generation RNA sequencing
Blood samples were collected at the baseline and SVR24 weeks after treatment. The peripheral blood mononuclear cells (PBMC) were isolated using the Ficoll-Hypaque Plus density gradient (Amersham Biosciences, Uppsala, Sweden). RNA was purified using a RiboPureTM Kit (Ambion, Applied Biosystems, Foster City, CA, USA). RNA quality was assessed using the Agilent 2100 Bioanalyzer (Agilent, Santa Clara, CA, USA). In total, 70% of the samples passed RNA quality control (RNA integrity number >7). Eventually, 30 pretreatment samples and 47 posttreatment samples were suitable for RNA sequencing.
The mRNA library was prepared after removal of rRNA using the TruSeq Stranded Total RNA Library Preparation Kit (Illumina, San Diego, California, USA). The RNA was fragmented into small pieces (180-250 nt) by heating. A cDNA library was constructed using end repair, adaptor ligation, and PCR amplification. Double-stranded cDNA samples were purified using Agencourt AMPure XP beads (Beckman). Paired-end RNA sequencing was performed on the Illumina HiSeq 2500 System (LC Sciences, Houston, TX, USA), according to the manufacturer’s recommended protocol.
TopHat2 (version 2.0.4.) was used to align the reads into transcripts based on human genome reference sequencing (http://genome.ucsc.edu/) [17]. The aligned reads were analyzed using the Cufflinks software (LC-Bio, Hangzhou, China) to calculate the relative genome abundance of each transcript. The expression of each transcript was quantified as FPKM (fragments per kilobase of transcript per million mapped reads). A total of 58676 gene transcripts were identified using TopHat2 and Cufflinks software. Differential gene expression between groups was tested using the DESeq2 package in the R software (http://www.r-project.org). The significance of gene expression was defined as a false discovery rate (FDR) <0.1 using the Benjamini-Hochberg procedure.
Machine learning model
The classification and regression tree (CART) algorithm of the decision tree was used to predict the primary outcome. The categorization of the outcomes depends on binary splitting. The CART algorithm develops binary trees based on single features until the stopping criteria are met. The Gini impurity measures the likelihood that randomly selected samples will be incorrectly classified by a specific node. The Gini index ranged from 0 to 1. Zero denotes that all elements belong to a certain class and 1 denotes that the elements are randomly distributed across various classes. The Gini index was used to identify the corresponding threshold for splitting the input data into sub-branches. This step was repeated to maximize subgroup homogeneity. The “rpart” package of R software was used to build the decision tree model.
The random forest algorithm was used to identify HCC predictors and rank their importance. Random forest builds an ensemble of decision trees, which are trained using the bootstrapping method. It merges all trees to obtain a more accurate and stable prediction. Each random forest analysis consisted of 500 random and independently grown decision trees. The importance of each variable was assessed by the decrease in the Gini impurity. The accuracy of the random forest model was estimated using out-of-bag error. The RandomForest package of R software was used for random forest analysis.
Statistical analyses
The Student’s t-test was used to compare continuous variables. The chi-square (χ 2) test or Fisher’s exact test was used to assess categorical variables. The differences in the primary outcome between the groups were analyzed using Kaplan-Meier survival analysis with the log-rank test. The Cox proportional hazards model was used for the multivariate survival analysis. The performance of the predictive model was evaluated using the area under the receiver operating characteristic curve (AUROC) and decision curve analysis (DCA). The nomogram was utilized for predicting the probability of HCC occurrence. Data were analyzed using the Statistical Package for the Social Sciences software (SPSS, version 17.0, SPSS Inc., Chicago, Illinois). The decision curve analysis and nomogram were performed by ggDCA and rms packages of R software, respectively. A two-tailed P value <0.05 was considered statistically significant.
Results
Baseline demographics
HCC developed in 8 of the 55 HCV patients after achieving SVR over 298.7 person-years of follow-up. The annual incidence of HCC is 2.7%. The information on baseline characteristics of HCC patients is shown in Table 1. There were no statistically significant differences in sex, age, HCV genotype, viral load, FIB-4 index, cirrhosis, AFP, HbA1c, or body mass index (BMI) between the HCC and control groups. High-density lipoprotein (HDL) levels were significantly lower in the HCC group than in the control group (P = 0.032). In the treatment regimen, the proportion of patients treated with IFN was significantly higher in the HCC group compared to that in the control group (87.5% vs. 42.6%, P = 0.025) (Table 1). The mean follow-up time was 8.5 years (interquartile range, IQR = 4.2-12.7 years) in the interferon group, and 2.5 years (IQR = 1.6-3.3 years) in the DAA group, respectively. The cumulative probability of HCC did not differ between the interferon and DAA groups (log-rank P = 0.065) (Figure 1).
Table 1.
Baseline demographics of study subjects
| Total | HCC | Non-HCC | P value | |
|---|---|---|---|---|
| n | 55 | 8 | 47 | |
| Age (y/o) | 64.0±7.8 | 63.0±3.0 | 64.1±8.3 | 0.709 |
| Sex | ||||
| Male | 25 (45.5%) | 6 (75.0%) | 19 (40.4%) | 0.123 |
| Female | 30 (54.5%) | 2 (25.0%) | 28 (59.6%) | |
| HCV genotype | ||||
| 1 | 34 (61.8%) | 6 (75.0%) | 28 (59.6%) | 0.558 |
| 2 | 16 (29.1%) | 2 (25.0%) | 14 (29.8%) | |
| Mixed | 5 (9.1%) | 0 (0.0%) | 5 (10.6%) | |
| HCV RNA (log IU/ml) | 5.45±0.89 | 5.11±0.82 | 5.50±0.89 | 0.246 |
| FIB-4 | 6.14±3.49 | 7.61±4.57 | 5.89±3.27 | 0.339 |
| Cirrhosis | ||||
| Yes | 18 (32.7%) | 2 (25.0%) | 16 (34.0%) | 1.000 |
| No | 37 (67.3%) | 6 (75.0%) | 31 (66.0%) | |
| AFP (ng/ml) | 19.3±28.9 | 45.9±59.4 | 14.8±17.5 | 0.217 |
| PLT (k/μl) | 120.6±35.7 | 110.5±32.2 | 122.2±36.3 | 0.391 |
| AST (IU/L) | 134.6±77.4 | 181.4±100.7 | 126.6±71.0 | 0.064 |
| ALT (IU/L) | 178.8±151.6 | 236.8±127.3 | 168.9±154.4 | 0.246 |
| γ-GT (IU/L) | 70.7±48.8 | 89.0±59.6 | 67.2±46.5 | 0.250 |
| Cholesterol (mg/dl) | 163.6±30.6 | 167.4±22.7 | 162.9±32.0 | 0.723 |
| Triglyceride (mg/dl) | 98.9±42.0 | 99.4±45.4 | 98.8±42.0 | 0.971 |
| HDL (mg/dl) | 45.9±14.0 | 39.6±5.2 | 47.0±14.7 | 0.032 |
| LDL (mg/dl) | 89.4±23.0 | 97.6±19.6 | 88.1±23.4 | 0.352 |
| Cr (mg/dl) | 0.83±0.27 | 0.92±0.25 | 0.82±0.27 | 0.320 |
| HbA1c (%) | 5.8±1.1 | 6.6±2.0 | 5.7±0.83 | 0.236 |
| BMI (kg/m2) | 24.8±4.4 | 25.9±3.1 | 24.7±4.5 | 0.467 |
| Treatment | ||||
| IFN | 27 (49.1%) | 7 (87.5%) | 20 (42.6%) | 0.025 |
| DAA | 28 (50.9%) | 1 (12.5%) | 27 (57.4%) |
p.s. HCC: Hepatocellular Carcinoma; HCV: Hepatitis C Virus; FIB-4: Fibrosis-4 index; AFP: Alpha-Fetoprotein; PLT: Platelet; AST: Aspartate aminotransferase; ALT: Alanine aminotransferase; γ-GT: γ-Glutamyl Transferase; HDL: High-Density Lipoprotein; LDL: Low-Density Lipoprotein; Cr: Creatinine; HbA1c: Hemoglobin A1c; BMI: Body Mass Index; DAA: Direct-acting Antiviral Agent; IFN: Interferon.
Figure 1.

Kaplan-Meier survival analysis.
Differentially expressed genes
Pretreatment angiopoietin-like 6 (ANGPTL6) gene expression was significantly higher in the HCC group than in the control group. Baseline defensin alpha 1B (DEFA1B), hemoglobin subunit gamma 2 (HBG2), and adenylate cyclase 4 (ADCY4) gene expression was significantly downregulated in the HCC group compared to that in the control group. Posttreatment taste 1 receptor member 3 (TAS1R3) and ATP-binding cassette subfamily A member 3 (ABCA3) were significantly lower in the HCC group than in the control group. Among the paired samples, posttreatment FOS-like antigen 1 (FOSL1) levels were significantly lower in the HCC group than in the control group (Table 2).
Table 2.
The differentially expressed genes between hepatocellular carcinoma and non-hepatocellular carcinoma samples
| RNAseq samples (n) | Gene | log2FC | P value | FDR | |||
|---|---|---|---|---|---|---|---|
|
|
|||||||
| HCC | Non-HCC | ||||||
| Pretreatment | 2 | 28 | ANGPTL6 | Up | 2.37 | 8.19 × 10⁻⁶ | 0.052 |
| DEFA1B | Down | -21.45 | 7.64 × 10⁻⁷ | 0.015 | |||
| HBG2 | Down | -9.98 | 1.08 × 10⁻⁵ | 0.052 | |||
| ADCY4 | Down | -1.88 | 3.97 × 10⁻⁶ | 0.038 | |||
| Posttreatment | 8 | 39 | TAS1R3 | Down | -1.21 | 1.40 × 10⁻⁶ | 0.027 |
| ABCA3 | Down | -0.60 | 8.08 × 10⁻⁶ | 0.079 | |||
| Paired samples | |||||||
| Pretreatment | 2 | 20 | N/A | N/A | N/A | N/A | N/A |
| Posttreatment | 2 | 20 | FOSL1 | Down | -3.46 | 1.55 × 10⁻³ | 0.068 |
p.s. The differentially expressed genes were analyzed by DESeq2. RNAseq: next-generation RNA sequencing; HCC: Hepatocellular Carcinoma; log2FC: log2 Fold Change; FDR: False Discovery Rate.
Decision tree algorithm identified the HCC predictors
To integrate the clinical features and genomic signatures into a single model, we used classification and regression tree analyses to predict the occurrence of HCC after SVR (Figure 2). The decision tree model was fitted based on 10 clinical characteristics (age, sex, HCV genotype, HCV RNA, FIB-4, AFP, HbA1c, platelet, BMI, treatment regimens) and genomic signatures (post-treatment TAS1R3, ABCA3, and FOSL1 genes). The minimum split size at each node was set to two to avoid overfitting. Single tree recursive partitioning identified three dominant predictors of HCC, namely TAS1R3, FOSL1, and ABCA3, yielding four subgroups with varying risks at each terminal node. The best predictor in the root node was the posttreatment TAS1R3, using a ≥0.63 versus <0.63 FPKM threshold for the first step. The patients with TAS1R3 <0.63 (node 3) were split into nodes 4 and 5 by the posttreatment FOSL1 with a cutoff value of 0.27 FPKM. Finally, the patients with FOSL1 <0.27 (node 5) were split into terminal nodes 6 and 7 by the posttreatment ABCA3 with a cutoff value of 2.4 FPKM. The risk categories were computed from four terminal nodes: low-risk (node 2), intermediate-risk (merging nodes 4 and 6), and high-risk (node 7). The accuracy of this decision tree-based HCC predictive model was 95.7%.
Figure 2.

The decision tree algorithm predicts hepatocellular carcinoma among the posttreatment samples of all cases. p.s. The root node and leaf nodes are represented by squares, which contain the number of patients in each group. Each branch represents the decision rules, and each leaf node represents the classification outcome.
The importance of HCC predictors assessed by Random Forest
The relative importance of the HCC predictors was evaluated using the random forest algorithm. Overall, 500 randomly and independently grown decision trees were used to determine the importance of variables. Posttreatment TAS1R3 expression was identified as the most important predictor of HCC. The top five variables for predicting HCC were TAS1R3, FOSL1, AFP, HCV viral load, and ABCA3 (Figure 3A). The out-of-bag error rate was 14.6% when estimating the true prediction error based on the choices of random forest variables (Figure 3B).
Figure 3.
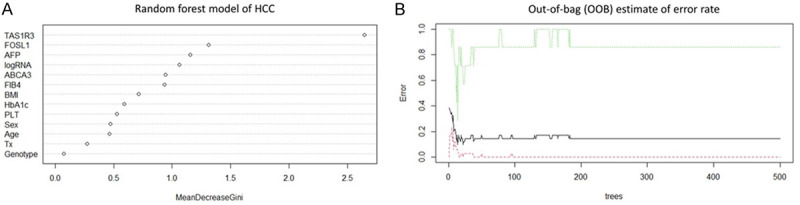
The importance of risk factors of hepatocellular carcinoma determined by the random forest model. p.s. TAS1R3: Taste 1 Receptor member 3; FOSL1: FOS-like antigen 1; AFP: Alpha-Fetoprotein; logRNA: log HCV viral load; ABCA3: ATP-Binding Cassette subfamily A member 3; FIB-4: Fibrosis-4 index; BMI: Body Mass Index; HbA1c: Hemoglobin A1c; PLT: Platelet; Tx: Treatment regimen.
Cox regression analysis of the relationship between the differentially expressed genes and HCC
The gene score was derived from the results of decision tree analysis. Gene score = posttreatment TAS1R3 (≥0.63 FPKM, yes = 0, no = 1) + FOSL1 (≥0.27 FPKM, yes = 0, no = 1) + ABCA3 (≥2.40 FPKM, yes = 0, no = 1). In univariate Cox regression analysis, the gene score was significantly associated with the onset of HCC (crude HR = 2.48, 95% CI = 1.15-5.33, P = 0.02) among all cases. The Fibrosis-4 index was correlated with HCC with borderline significance. In multivariate Cox regression analysis, the gene score remained an independent risk factor for HCC after adjusting for fibrosis-4 index (adjusted HR = 2.38, 95% CI = 1.06-5.36, P = 0.036) (Table 3).
Table 3.
Factors associated with the onset of hepatocellular carcinoma in overall cases: univariate and multivariate Cox regression models
| Variables | Univariate Cox regression | Multivariate Cox regression | ||
|---|---|---|---|---|
|
|
|
|||
| Crude HR (95% CI) | P value | Adjusted HR (95% CI) | Adjusted P value | |
| Age (>60 vs. ≤60 y/o) | 0.63 (0.13-3.18) | 0.580 | - | - |
| Sex (male vs. female) | 2.99 (0.59-15.08) | 0.186 | - | - |
| HCV genotype | 0.35 (0.09-1.41) | 0.140 | - | - |
| HCV RNA (>106 vs. ≤106 IU/ml) | 0.34 (0.04-2.79) | 0.314 | - | - |
| FIB-4 | 1.17 (0.98-1.40) | 0.089 | 1.03 (0.85-1.24) | 0.780 |
| Platelet (>105 vs. ≤105/μl) | 0.66 (0.16-2.79) | 0.575 | - | - |
| AFP (>20 vs. ≤20 ng/ml) | 2.41 (0.54-10.82) | 0.252 | - | - |
| HbA1c (>7 vs. ≤7%) | 2.41 (0.46-12.50) | 0.296 | - | - |
| HDL (>40 vs. ≤40 mg/dl) | 1.26 (0.24-6.52) | 0.786 | - | - |
| BMI (>25 vs. 25 kg/m2) | 0.38 (0.09-1.63) | 0.193 | - | - |
| Treatment (DAA vs. IFN) | 8.78 (0.54-141.9) | 0.126 | - | - |
| Pretreatment gene (FPKM) | ||||
| ANGPTL6 | 1.24 (0.84-1.83) | 0.281 | - | - |
| DEFA1B | 0.90 (0.54-1.49) | 0.674 | - | - |
| HBG2 | 0.01 (0.00-287.8) | 0.388 | - | - |
| ADCY4 | 0.48 (0.04-6.17) | 0.569 | - | - |
| Posttreatment gene (FPKM) | ||||
| TAS1R3 | 0.08 (0.00-1.77) | 0.110 | - | - |
| ABCA3 | 0.68 (0.23-1.99) | 0.478 | - | - |
| FOSIL1 | 0.56 (0.03-10.73) | 0.701 | - | - |
| Gene score | 2.48 (1.15-5.33) | 0.020 | 2.38 (1.06-5.36) | 0.036 |
p.s. HCC: Hepatocellular Carcinoma; y/o: years old; HCV: Hepatitis C Virus; FIB-4: Fibrosis-4 index; AFP: α-Fetoprotein; HbA1c: Hemoglobin A1c; HDL: High Density Lipoprotein; BMI: Body Mass Index; DAA: Direct-acting Antiviral Agent; IFN: Interferon; FPKM: Fragments per Kilobase per Million; 95% CI: 95% Confidence Interval; HR: Hazard Ratio. The stepwise multivariate Cox regression was adjusted for fibrosis-4 index, and gene score.
Among the HCV patients treated with pegIFN/ribavirin, univariate Cox regression analysis showed that the gene score was a significant predictor of HCC (crude HR = 3.38, 95% CI = 1.20-9.49, P = 0.021). Multivariate Cox regression analysis revealed that the gene score remained an independent risk factor for HCC in the IFN group after adjusting for sex and body mass index (adjusted HR = 8.14, 95% CI = 1.35-49.23, P = 0.022) (Table 4).
Table 4.
Factors associated with the onset of hepatocellular carcinoma in the interferon group: univariate and multivariate Cox regression models
| Variables | Univariate Cox regression | Multivariate Cox regression | ||
|---|---|---|---|---|
|
|
|
|||
| Crude HR (95% CI) | P value | Adjusted HR (95% CI) | Adjusted P value | |
| Age (>60 vs. ≤60 y/o) | 1.20 (0.14-10.09) | 0.865 | - | - |
| Sex (male vs. female) | 6.07 (0.71-51.56) | 0.099 | 1.29 (0.08-20.31) | 0.857 |
| HCV genotype | 0.38 (0.09-1.56) | 0.179 | - | - |
| HCV RNA (>106 vs. ≤106 IU/ml) | 0.40 (0.05-3.38) | 0.400 | - | - |
| FIB-4 | 1.10 (0.89-1.37) | 0.370 | - | - |
| Platelet (>105 vs. ≤105/μl) | 0.98 (0.19-5.06) | 0.978 | - | - |
| AFP (>20 vs. ≤20 ng/ml) | 1.68 (0.31-9.24) | 0.551 | - | - |
| HbA1c (>7 vs. ≤7%) | 2.92 (0.53-16.07) | 0.218 | - | - |
| HDL (>40 vs. ≤40 mg/dl) | 0.95 (0.15-5.97) | 0.959 | - | - |
| BMI (>25 vs. ≤25 kg/m2) | 0.25 (0.05-1.18) | 0.080 | 0.14 (0.02-1.08) | 0.060 |
| Pretreatment gene (FPKM) | ||||
| ANGPTL6 | 1.24 (0.84-1.83) | 0.281 | - | - |
| DEFA1B | 0.90 (0.54-1.49) | 0.674 | - | - |
| HBG2 | 0.01 (0.0-287.8) | 0.388 | - | - |
| ADCY4 | 0.48 (0.04-6.17) | 0.569 | - | - |
| Posttreatment gene (FPKM) | ||||
| TAS1R3 | 0.32 (0.03-4.19) | 0.388 | - | - |
| ABCA3 | 1.16 (0.46-2.94) | 0.752 | - | - |
| FOSIL1 | 0.24 (0.0-13.08) | 0.481 | - | - |
| Gene score | 3.38 (1.20-9.49) | 0.021 | 8.14 (1.35-49.23) | 0.022 |
p.s. HCC: Hepatocellular Carcinoma; y/o: years old; HCV: Hepatitis C Virus; FIB-4: Fibrosis-4 index; AFP: α-Fetoprotein; HbA1c: Hemoglobin A1c; HDL: High-Density Lipoprotein; BMI: Body Mass Index; FPKM: Fragments per Kilobase per Million; 95% CI: 95% Confidence Interval; HR: Hazard Ratio. The multivariate Cox regression analysis was adjusted for sex, BMI, and gene score.
Nomogram development
The nomogram is a graphical tool to represent the effect of each predictor on the outcome. A nomogram was developed based on the results of the Cox proportional hazards regression analysis. The parameters of this nomogram were composed of the gene score and FIB-4 index. The value of each parameter has a corresponding risk point. The sum of each parameter’s points is converted to 5-year and 10-year survival probability. A high total point indicates a high survival probability and a low risk of HCC occurrence (Figure 4).
Figure 4.

Nomogram of Cox regression model. p.s. The points for each predictor were calculated by drawing a straight line from the individual’s variable value to the axis labeled “Points”. The total point for all predictors is converted to the survival probability. The 5-year and 10-year survival probability can be obtained by drawing a vertical line from the axis labeled “Total Points”.
The performance of the hepatocellular carcinoma predictive models
The area under the receiver operating characteristic curve was 0.950 (95% CI = 0.888-1.000, P = 7.0 × 10⁻⁵) in the nomogram and 0.913 (95% CI = 0.794-1.000, P = 2.6 × 10⁻⁴) in the gene score, respectively. The ROC curve analysis showed the nomogram had excellent discrimination of HCC occurrence among the HCV-cured patients (Figure 5A). The decision curve analysis revealed both models had net benefits compared to the clinical default strategies of “treat all” or “treat none” over the entire range of threshold probabilities. The area under the decision curve was greater in nomogram (AUDC = 0.08) than in the gene score (AUDC = 0.068). It suggested the nomogram was superior to the gene score in the clinical application (Figure 5B). The calibration curve confirmed the nomogram had optimal goodness of fit between the predicted and actual HCC probabilities (Figure 5C).
Figure 5.

The performance of the hepatocellular carcinoma predictive model. A. Receiver operating characteristic curve; B. Decision curve analysis; C. Calibration curve plot.
Kaplan-Meier survival analysis for HCV patients stratified by nomogram
The HCV patients were further stratified into low- (150-200 points), intermediate- (90-149 points), and high-risk groups (0-90 points) according to the monogram. In the high-risk group, the 3-year, 5-year, and 10-year cumulative probabilities of HCC were 0%, 14.3%, and 42.9%, respectively. In the intermediate-risk group, the 3-year, 5-year, and 10-year accumulative probabilities for HCC were 0%, 11.1%, and 25.9%, respectively. In contrast, none of the low-risk patients had HCC within 14 years of follow-up (log-rank P = 0.014) (Figure 6).
Figure 6.

Kaplan-Meier survival analysis. p.s. The HCV patients were stratified into low- (150-200 points), intermediate- (score = 90-149 points), and high-risk groups (score = 0-89 points) based on the total points of nomogram.
Discussion
This study revealed that HCC risk could be modified by genomic signatures after HCV eradication. Down-regulated posttreatment TAS1R3, ABCA3, and FOSL1 expression in PBMC was significantly correlated with HCC development following HCV clearance. Decision tree-based algorithms integrate clinical features and genomic signatures to extract important predictors of HCC. A gene score comprising TAS1R3, ABCA3, and FOSL1 can accurately classify which HCV patients is at high risk of HCC. Combining the gene score and FIB-4 index, we further constructed a nomogram to predict the individual risk of HCC with a high diagnostic accuracy. Decision-tree based algorithms can refine the assessment of HCC risk for personalized HCC surveillance.
TAS1R3 is encoded by the TAS1R3 gene. Sweet taste receptors are expressed in tissues other than taste buds, including the gastrointestinal tract [18], pancreatic β-cells [19], hypothalamus [20], and others. TSA1R3 is G-protein-coupled sweet taste receptor protein [21], which is involved in regulating glucose homeostasis [22]. TAS1R3s act as luminal sugar sensors that control sodium-dependent glucose transporter isoform 1 (SGLT1) expression in response to dietary sugar [18]. Mice lacking TAS1R3 are deficient in incretin production and glucose tolerance [23]. Glucagon-like peptide-1 (GLP-1) release can be blocked by a sweet receptor antagonist [24]. Altered GLP-1 secretion in gut “taste cells” may implicate crucial pathogenesis for diabetes and obesity, which are risk factors of HCC.
ABCA3 encodes ATP-binding cassette subfamily A member 3, one of the ATP-binding cassette (ABC) transporter superfamily. ABC transporters utilize the energy of ATP hydrolysis to translocate substrates across the cell membranes [25]. ABCA is highly expressed in the liver, lungs, kidneys, and pancreas [26]. ABC transporters play a crucial role in mediating cholesterol efflux to HDL and in preventing cellular lipid accumulation [27,28]. Mice lacking ABC transporters accumulate inflammatory macrophages in the liver [29]. ABC transporter deficiency in macrophages induces inflammatory signaling via various toll-like receptors [30]. Downregulation of ABCA1/ABCG1 results in impaired cholesterol efflux to HDL and increased secretion of inflammatory cytokines and chemokines [31]. Persistent inflammation is a hallmark of chronic hepatic injury that predisposes patients to HCC.
FOS-related antigen 1 (Fra-1), encoded by the FOSL1 gene, is a nuclear transcription factor that regulates cell proliferation, invasion, metastasis, and epithelial-mesenchymal transition [32]. Fra-1 is overexpressed in colorectal cancer, breast cancer, lung cancer, prostate cancer, and others [33]. In contrast, Fra-1 overexpression in cervical cancer cells inhibits tumor cell growth via STAT1 regulation of p53 signaling [34]. Previous studies showed that increased intrahepatic FOSL1 is an unfavorable prognostic factor of HCC [35,36]. Our study revealed that downregulation of FOSL1 in PBMC after HCV eradication increases the risk of HCC. This discrepancy may arise from the fact that FOSL1 has distinct effects on cancer and immune cells. Further, the role of FOSL-1 in HCC should be verified.
The mechanism underlying HCC occurrence after HCV eradication remains largely unknown. Advanced fibrosis may require a long time to resolve after viral clearance. Concomitant hepatotoxic injuries, such as alcohol and metabolic-associated fatty liver disease, lead to the progression of fibrosis [37]. HCV-related preneoplastic genetic and epigenetic modifications that occurred before antiviral therapy may persist indefinitely after SVR [7,8]. Our study identified a gene profile comprising TAS1R3, ABCA3, and FOSL-1 that was significantly associated with HCC after SVR. Both TAS1R3 and ABCA3 participate in the glucose and lipid metabolism. This implies that genetic variations in energy metabolism may serve as key drivers of hepatocarcinogenesis after HCV clearance. Traditional HCC surveillance guidelines recommend performing serum α-fetoprotein and ultrasonography every six months [38]. The “one-size-fits-all” HCC surveillance strategy is ineffective in the post-DAA era. This risk-based surveillance strategy provides cost-effective principles for numerous HCV patients with SVR. The concurrent downregulation of TAS1R3, ABCA3, and FOSL-1 significantly increased the risk of HCC, with a 5-year and 10-year cumulative probability of HCC up to 14.3% and 48.6%, respectively. Nevertheless, none of the HCC developed in patients with simultaneous upregulation of TAS1R3, ABCA3, and FOSL-1. Individuals with high-risk genomic signatures should be monitored closely.
Since the sensitivity of AFP is suboptimal [39] and the ultrasound technique is highly operator-dependent, the development of novel biomarkers is valuable for HCC screening. A large cohort (Ioannou et al.) revealed that pretreatment FIB-4 and ΔFIB-4 scores can be used as a convenient method for stratifying post-SVR HCC risk. Patients with FIB-4 scores ≥3.25 have a high enough risk to merit HCC surveillance, especially if FIB-4 remains >3.25 after SVR [40]. In the high-risk group with pretreatment FIB-4 ≥3.25, the application of the nomogram may further improve post-SVR HCC risk stratification. Our nomogram has excellent discrimination in HCC occurrence and optimal concordance between the predicted and actual HCC probabilities. The decision curve analysis supported this nomogram provides net benefit in the diagnosis of HCC. Furthermore, the nomogram gives clinicians a more tangible interpretation of each predictor’s impact on the outcome.
Many promising biomarkers of HCC have been developed. α-fatoprotein-L3 and des-γ-carboxy prothrombin (DCP) are novel HCC biomarkers approved by the US Food and Drug Administration (FDA). The AUC for AFP, AFP-L3, and DCP were 0.77, 0.73, and 0.71, respectively. Combination of AFP and AFP-L3 or DCP enhanced the discrimination for early-stage HCC (AUC = 0.83~0.86) [41]. The GALAD score, derived from gender, age, AFP-L3, AFP, and DCP, is used to identify post-SVR HCC with high accuracy (AUC = 0.91) [42]. In a global prospective cohort, the aMAP score, which is composed of age, male, albumin-bilirubin and platelets, predicted the risk of HCC after SVR with an AUC ranged from 0.68 to 0.85 [43]. Previous studies have confirmed that alterations in PBMC transcriptome profiles can be linked to HCC occurrence and prognosis. Shi et al. identified that the three-gene signature (CXCR2, CCR2, and EP400) is promising for the early detection of HCC, with an area under the curve of 0.96 [44]. Han et al. found that six genes (SELENBP1, SLC4A1, SLC26A8, HSPA8P4, CALM1, and RPL7p24) had high sensitivity and specificity for HCC diagnosis [45]. Nevertheless, most studies enrolled a small cohort, and the analytical methods varied, even on the same testing platform. These factors have limited the clinical application of these biomarkers. Recent studies further combined the liver stiffness measurement (LSM), hepatic fibrosis, metabolic disorders and biomarkers to assess the risk of post-SVR HCC [46,47] A model comprising LSM, age, albumin, and AFP with and without alcohol consumption accurately stratified de novo HCC risk (Harrel’s C-index: 0.893 and 0.874) [48]. LSM is expensive and not widely used in primary clinics, which may restrain the clinical application of this model.
Machine learning algorithms have certain advantages that are superior to those of traditional statistical methods. First, machine-learning algorithms can process linear and nonlinear big data at a high speed. Second, the machine-learning algorithm can learn from the input data to detect the underlying relevance between the variables and outcomes. Artificial intelligence has a promising potential for improving diagnosis and treatment in medicine. Although the application of machine learning is increasing, the disadvantages of machine learning algorithms merit attention. The design of a machine-learning-based predictive model lacks standards. Tracing the process of the machine learning model is difficult because of the existence of a “black box”. Artificial intelligence brings new hope but also new challenges in translating data to clinical application.
This pilot study has several limitations. The sample size was limited, and a validation dataset was lacking. A small sample size may make any predicting models with uncertainty. The 10-fold EPV (Events Per Variable) is a simple and easy-to-operate principle to determine the sample size of Cox regression analysis. Nevertheless, some factors may affect the calculation of sample size, such as the correlation between independent variables, the strength of the association between independent variables and dependent variables, and so on. Vittinghoff et al. found a range of circumstances in which coverage and bias were within acceptable levels despite less than 10-fold EPV [49]. We followed the 10 EPV principles as possible. We reduced the variables in the multivariate Cox regression analysis. Only the factors with a P value <0.1 in the univariate analysis were put into the multivariate cox regression analysis. As splitting the dataset is not possible given the limited sample size, the bootstrapping method can be used for internal validation [50]. Random forest provides an alternative bootstrapping approach called “in-bag” and “out-of-bag” sampling. The “out-of-bag” cohort can serve as an internal validation cohort for the model derived using the “in-bag” samples [51]. Random forest analysis showed that TAS1R3 and FOSL-1 were the most important predictors of HCC, with out-of-bag errors of 14.6%. Nevertheless, external validation is required to further verify this HCC predictive model. In addition, gene expression in PBMC may not be consistent within the hepatocytes. The roles of differentially expressed genes in hepatocarcinogenesis should be further investigated in functional studies. However, the application of PBMC signatures could serve as a potential noninvasive biomarker for HCC.
In conclusion, downregulation of posttreatment TAS1R3, ABCA3, and FOSL1 significantly correlated with an increased risk of HCC development following HCV clearance. Combining the gene score and FIB-4 index, we established a nomogram to predict the risk of HCC with a high diagnostic accuracy. The identification of key driver genes helps understand the mechanisms underlying hepatocarcinogenesis. Artificial intelligence can efficiently integrate clinical information and genomic databases for better accessibility of precision medicine. The decision-tree-based algorithm could improve the HCC surveillance program for post-SVR HCV patients based on individual HCC risk.
Acknowledgements
This study was supported by Kaohsiung Medical University, Kaohsiung Medical University Hospital, and National Science Council, Taiwan (grant No. KMU-DK107004; NYCUKMU-111-I001; NYCUKMU-111-I004; KMHK-DK(C) 111006). The target of elimination of viral hepatitis is also linked to public health disease elimination targets of the health-related Sustainable Development Goals (SDGs).
Disclosure of conflict of interest
The authors declare that the research was conducted in the absence of any commercial or financial relationships that could be construed as a potential conflict of interest.
References
- 1.Villanueva A. Hepatocellular carcinoma. N Engl J Med. 2019;380:1450–1462. doi: 10.1056/NEJMra1713263. [DOI] [PubMed] [Google Scholar]
- 2.Cheng TS, Liang PC, Huang CF, Yeh ML, Huang CI, Lin ZY, Chen SC, Huang JF, Dai CY, Hsieh PH, Chuang WL, Yu ML. Real-world effectiveness of direct-acting antiviral agents for chronic hepatitis C patients with genotype-2 infection after completed treatment. Kaohsiung J Med Sci. 2021;37:334–345. doi: 10.1002/kjm2.12315. [DOI] [PMC free article] [PubMed] [Google Scholar]
- 3.Ioannou GN, Green PK, Berry K. HCV eradication induced by direct-acting antiviral agents reduces the risk of hepatocellular carcinoma. J Hepatol. 2017 doi: 10.1016/j.jhep.2017.08.030. [Epub ahead of print] [DOI] [PMC free article] [PubMed] [Google Scholar]
- 4.Yu ML, Huang CF, Yeh ML, Tsai PC, Huang CI, Hsieh MH, Hsieh MY, Lin ZY, Chen SC, Huang JF, Dai CY, Chuang WL. Time-degenerative factors and the risk of hepatocellular carcinoma after antiviral therapy among hepatitis C virus patients: a model for prioritization of treatment. Clin Cancer Res. 2017;23:1690–1697. doi: 10.1158/1078-0432.CCR-16-0921. [DOI] [PubMed] [Google Scholar]
- 5.Lemon SM, McGivern DR. Is hepatitis C virus carcinogenic? Gastroenterology. 2012;142:1274–1278. doi: 10.1053/j.gastro.2012.01.045. [DOI] [PMC free article] [PubMed] [Google Scholar]
- 6.Machida K, Cheng KT, Lai CK, Jeng KS, Sung VM, Lai MM. Hepatitis C virus triggers mitochondrial permeability transition with production of reactive oxygen species, leading to DNA damage and STAT3 activation. J Virol. 2006;80:7199–7207. doi: 10.1128/JVI.00321-06. [DOI] [PMC free article] [PubMed] [Google Scholar]
- 7.Hamdane N, Juhling F, Crouchet E, El Saghire H, Thumann C, Oudot MA, Bandiera S, Saviano A, Ponsolles C, Roca Suarez AA, Li S, Fujiwara N, Ono A, Davidson I, Bardeesy N, Schmidl C, Bock C, Schuster C, Lupberger J, Habersetzer F, Doffoel M, Piardi T, Sommacale D, Imamura M, Uchida T, Ohdan H, Aikata H, Chayama K, Boldanova T, Pessaux P, Fuchs BC, Hoshida Y, Zeisel MB, Duong FHT, Baumert TF. HCV-induced epigenetic changes associated with liver cancer risk persist after sustained virologic response. Gastroenterology. 2019;156:2313–2329. e7. doi: 10.1053/j.gastro.2019.02.038. [DOI] [PMC free article] [PubMed] [Google Scholar]
- 8.Perez S, Kaspi A, Domovitz T, Davidovich A, Lavi-Itzkovitz A, Meirson T, Alison Holmes J, Dai CY, Huang CF, Chung RT, Nimer A, El-Osta A, Yaari G, Stemmer SM, Yu ML, Haviv I, Gal-Tanamy M. Hepatitis C virus leaves an epigenetic signature post cure of infection by direct-acting antivirals. PLoS Genet. 2019;15:e1008181. doi: 10.1371/journal.pgen.1008181. [DOI] [PMC free article] [PubMed] [Google Scholar]
- 9.Schulze K, Imbeaud S, Letouze E, Alexandrov LB, Calderaro J, Rebouissou S, Couchy G, Meiller C, Shinde J, Soysouvanh F, Calatayud AL, Pinyol R, Pelletier L, Balabaud C, Laurent A, Blanc JF, Mazzaferro V, Calvo F, Villanueva A, Nault JC, Bioulac-Sage P, Stratton MR, Llovet JM, Zucman-Rossi J. Exome sequencing of hepatocellular carcinomas identifies new mutational signatures and potential therapeutic targets. Nat Genet. 2015;47:505–511. doi: 10.1038/ng.3252. [DOI] [PMC free article] [PubMed] [Google Scholar]
- 10.Li S, Mao M. Next generation sequencing reveals genetic landscape of hepatocellular carcinomas. Cancer Lett. 2013;340:247–253. doi: 10.1016/j.canlet.2012.09.027. [DOI] [PubMed] [Google Scholar]
- 11.Zucman-Rossi J, Villanueva A, Nault JC, Llovet JM. Genetic landscape and biomarkers of hepatocellular carcinoma. Gastroenterology. 2015;149:1226–1239. e4. doi: 10.1053/j.gastro.2015.05.061. [DOI] [PubMed] [Google Scholar]
- 12.Le Berre C, Sandborn WJ, Aridhi S, Devignes MD, Fournier L, Smail-Tabbone M, Danese S, Peyrin-Biroulet L. Application of artificial intelligence to gastroenterology and hepatology. Gastroenterology. 2020;158:76–94. e2. doi: 10.1053/j.gastro.2019.08.058. [DOI] [PubMed] [Google Scholar]
- 13.Hosny A, Parmar C, Quackenbush J, Schwartz LH, Aerts H. Artificial intelligence in radiology. Nat Rev Cancer. 2018;18:500–510. doi: 10.1038/s41568-018-0016-5. [DOI] [PMC free article] [PubMed] [Google Scholar]
- 14.Su TH, Wu CH, Kao JH. Artificial intelligence in precision medicine in hepatology. J Gastroenterol Hepatol. 2021;36:569–580. doi: 10.1111/jgh.15415. [DOI] [PubMed] [Google Scholar]
- 15.Ahn JC, Connell A, Simonetto DA, Hughes C, Shah VH. Application of artificial intelligence for the diagnosis and treatment of liver diseases. Hepatology. 2021;73:2546–2563. doi: 10.1002/hep.31603. [DOI] [PubMed] [Google Scholar]
- 16.Ioannou GN, Tang W, Beste LA, Tincopa MA, Su GL, Van T, Tapper EB, Singal AG, Zhu J, Waljee AK. Assessment of a deep learning model to predict hepatocellular carcinoma in patients with hepatitis c cirrhosis. JAMA Netw Open. 2020;3:e2015626. doi: 10.1001/jamanetworkopen.2020.15626. [DOI] [PMC free article] [PubMed] [Google Scholar]
- 17.Kim D, Pertea G, Trapnell C, Pimentel H, Kelley R, Salzberg SL. TopHat2: accurate alignment of transcriptomes in the presence of insertions, deletions and gene fusions. Genome Biol. 2013;14:R36. doi: 10.1186/gb-2013-14-4-r36. [DOI] [PMC free article] [PubMed] [Google Scholar]
- 18.Dyer J, Salmon KS, Zibrik L, Shirazi-Beechey SP. Expression of sweet taste receptors of the T1R family in the intestinal tract and enteroendocrine cells. Biochem Soc Trans. 2005;33:302–305. doi: 10.1042/BST0330302. [DOI] [PubMed] [Google Scholar]
- 19.Kyriazis GA, Soundarapandian MM, Tyrberg B. Sweet taste receptor signaling in beta cells mediates fructose-induced potentiation of glucose-stimulated insulin secretion. Proc Natl Acad Sci U S A. 2012;109:E524–532. doi: 10.1073/pnas.1115183109. [DOI] [PMC free article] [PubMed] [Google Scholar]
- 20.Ren X, Zhou L, Terwilliger R, Newton SS, de Araujo IE. Sweet taste signaling functions as a hypothalamic glucose sensor. Front Integr Neurosci. 2009;3:12. doi: 10.3389/neuro.07.012.2009. [DOI] [PMC free article] [PubMed] [Google Scholar]
- 21.Nelson G, Hoon MA, Chandrashekar J, Zhang Y, Ryba NJ, Zuker CS. Mammalian sweet taste receptors. Cell. 2001;106:381–390. doi: 10.1016/s0092-8674(01)00451-2. [DOI] [PubMed] [Google Scholar]
- 22.Murovets VO, Bachmanov AA, Zolotarev VA. Impaired glucose metabolism in mice lacking the Tas1r3 taste receptor gene. PLoS One. 2015;10:e0130997. doi: 10.1371/journal.pone.0130997. [DOI] [PMC free article] [PubMed] [Google Scholar]
- 23.Margolskee RF, Dyer J, Kokrashvili Z, Salmon KS, Ilegems E, Daly K, Maillet EL, Ninomiya Y, Mosinger B, Shirazi-Beechey SP. T1R3 and gustducin in gut sense sugars to regulate expression of Na+-glucose cotransporter 1. Proc Natl Acad Sci U S A. 2007;104:15075–15080. doi: 10.1073/pnas.0706678104. [DOI] [PMC free article] [PubMed] [Google Scholar]
- 24.Jang HJ, Kokrashvili Z, Theodorakis MJ, Carlson OD, Kim BJ, Zhou J, Kim HH, Xu X, Chan SL, Juhaszova M, Bernier M, Mosinger B, Margolskee RF, Egan JM. Gut-expressed gustducin and taste receptors regulate secretion of glucagon-like peptide-1. Proc Natl Acad Sci U S A. 2007;104:15069–15074. doi: 10.1073/pnas.0706890104. [DOI] [PMC free article] [PubMed] [Google Scholar]
- 25.Dean M, Annilo T. Evolution of the ATP-binding cassette (ABC) transporter superfamily in vertebrates. Annu Rev Genomics Hum Genet. 2005;6:123–142. doi: 10.1146/annurev.genom.6.080604.162122. [DOI] [PubMed] [Google Scholar]
- 26.Paolini A, Baldassarre A, Del Gaudio I, Masotti A. Structural features of the ATP-binding cassette (ABC) transporter ABCA3. Int J Mol Sci. 2015;16:19631–19644. doi: 10.3390/ijms160819631. [DOI] [PMC free article] [PubMed] [Google Scholar]
- 27.Orso E, Broccardo C, Kaminski WE, Bottcher A, Liebisch G, Drobnik W, Gotz A, Chambenoit O, Diederich W, Langmann T, Spruss T, Luciani MF, Rothe G, Lackner KJ, Chimini G, Schmitz G. Transport of lipids from golgi to plasma membrane is defective in tangier disease patients and Abc1-deficient mice. Nat Genet. 2000;24:192–196. doi: 10.1038/72869. [DOI] [PubMed] [Google Scholar]
- 28.McNeish J, Aiello RJ, Guyot D, Turi T, Gabel C, Aldinger C, Hoppe KL, Roach ML, Royer LJ, de Wet J, Broccardo C, Chimini G, Francone OL. High density lipoprotein deficiency and foam cell accumulation in mice with targeted disruption of ATP-binding cassette transporter-1. Proc Natl Acad Sci U S A. 2000;97:4245–4250. doi: 10.1073/pnas.97.8.4245. [DOI] [PMC free article] [PubMed] [Google Scholar]
- 29.Out R, Jessup W, Le Goff W, Hoekstra M, Gelissen IC, Zhao Y, Kritharides L, Chimini G, Kuiper J, Chapman MJ, Huby T, Van Berkel TJ, Van Eck M. Coexistence of foam cells and hypocholesterolemia in mice lacking the ABC transporters A1 and G1. Circ Res. 2008;102:113–120. doi: 10.1161/CIRCRESAHA.107.161711. [DOI] [PubMed] [Google Scholar]
- 30.Yvan-Charvet L, Welch C, Pagler TA, Ranalletta M, Lamkanfi M, Han S, Ishibashi M, Li R, Wang N, Tall AR. Increased inflammatory gene expression in ABC transporter-deficient macrophages: free cholesterol accumulation, increased signaling via toll-like receptors, and neutrophil infiltration of atherosclerotic lesions. Circulation. 2008;118:1837–1847. doi: 10.1161/CIRCULATIONAHA.108.793869. [DOI] [PMC free article] [PubMed] [Google Scholar]
- 31.Yvan-Charvet L, Wang N, Tall AR. Role of HDL, ABCA1, and ABCG1 transporters in cholesterol efflux and immune responses. Arterioscler Thromb Vasc Biol. 2010;30:139–143. doi: 10.1161/ATVBAHA.108.179283. [DOI] [PMC free article] [PubMed] [Google Scholar]
- 32.Vallejo A, Erice O, Entrialgo-Cadierno R, Feliu I, Guruceaga E, Perugorria MJ, Olaizola P, Muggli A, Macaya I, O’Dell M, Ruiz-Fernandez de Cordoba B, Ortiz-Espinosa S, Hezel AF, Arozarena I, Lecanda F, Avila MA, Fernandez-Barrena MG, Evert M, Ponz-Sarvise M, Calvisi DF, Banales JM, Vicent S. FOSL1 promotes cholangiocarcinoma via transcriptional effectors that could be therapeutically targeted. J Hepatol. 2021;75:363–376. doi: 10.1016/j.jhep.2021.03.028. [DOI] [PubMed] [Google Scholar]
- 33.Jiang X, Xie H, Dou Y, Yuan J, Zeng D, Xiao S. Expression and function of FRA1 protein in tumors. Mol Biol Rep. 2020;47:737–752. doi: 10.1007/s11033-019-05123-9. [DOI] [PubMed] [Google Scholar]
- 34.Zhang M, Liang L, He J, He Z, Yue C, Jin X, Gao M, Xiao S, Zhou Y. Fra-1 inhibits cell growth and the warburg effect in cervical cancer cells via STAT1 regulation of the p53 signaling pathway. Front Cell Dev Biol. 2020;8:579629. doi: 10.3389/fcell.2020.579629. [DOI] [PMC free article] [PubMed] [Google Scholar]
- 35.Li L, Zhang W, Zhao S, Sun M. FOS-like antigen 1 is a prognostic biomarker in hepatocellular carcinoma. Saudi J Gastroenterol. 2019;25:369–376. doi: 10.4103/sjg.SJG_595_18. [DOI] [PMC free article] [PubMed] [Google Scholar]
- 36.Gao XQ, Ge YS, Shu QH, Ma HX. Expression of Fra-1 in human hepatocellular carcinoma and its prognostic significance. Tumour Biol. 2017;39:1010428317709635. doi: 10.1177/1010428317709635. [DOI] [PubMed] [Google Scholar]
- 37.Ioannou GN. HCC surveillance after SVR in patients with F3/F4 fibrosis. J Hepatol. 2021;74:458–465. doi: 10.1016/j.jhep.2020.10.016. [DOI] [PubMed] [Google Scholar]
- 38.Covey AM. Hepatocellular carcinoma: updates to screening and diagnosis. J Natl Compr Canc Netw. 2018;16:663–665. doi: 10.6004/jnccn.2018.0052. [DOI] [PubMed] [Google Scholar]
- 39.Lok AS, Sterling RK, Everhart JE, Wright EC, Hoefs JC, Di Bisceglie AM, Morgan TR, Kim HY, Lee WM, Bonkovsky HL, Dienstag JL HALT-C Trial Group. Des-gamma-carboxy prothrombin and alpha-fetoprotein as biomarkers for the early detection of hepatocellular carcinoma. Gastroenterology. 2010;138:493–502. doi: 10.1053/j.gastro.2009.10.031. [DOI] [PMC free article] [PubMed] [Google Scholar]
- 40.Ioannou GN, Beste LA, Green PK, Singal AG, Tapper EB, Waljee AK, Sterling RK, Feld JJ, Kaplan DE, Taddei TH, Berry K. Increased risk for hepatocellular carcinoma persists up to 10 years after HCV eradication in patients with baseline cirrhosis or high FIB-4 scores. Gastroenterology. 2019;157:1264–1278. e4. doi: 10.1053/j.gastro.2019.07.033. [DOI] [PMC free article] [PubMed] [Google Scholar]
- 41.Choi J, Kim GA, Han S, Lee W, Chun S, Lim YS. Longitudinal assessment of three serum biomarkers to detect very early-stage hepatocellular carcinoma. Hepatology. 2019;69:1983–1994. doi: 10.1002/hep.30233. [DOI] [PubMed] [Google Scholar]
- 42.Berhane S, Toyoda H, Tada T, Kumada T, Kagebayashi C, Satomura S, Schweitzer N, Vogel A, Manns MP, Benckert J, Berg T, Ebker M, Best J, Dechene A, Gerken G, Schlaak JF, Weinmann A, Worns MA, Galle P, Yeo W, Mo F, Chan SL, Reeves H, Cox T, Johnson P. Role of the GALAD and BALAD-2 serologic models in diagnosis of hepatocellular carcinoma and prediction of survival in patients. Clin Gastroenterol Hepatol. 2016;14:875–886. e6. doi: 10.1016/j.cgh.2015.12.042. [DOI] [PubMed] [Google Scholar]
- 43.Fan R, Papatheodoridis G, Sun J, Innes H, Toyoda H, Xie Q, Mo S, Sypsa V, Guha IN, Kumada T, Niu J, Dalekos G, Yasuda S, Barnes E, Lian J, Suri V, Idilman R, Barclay ST, Dou X, Berg T, Hayes PC, Flaherty JF, Zhou Y, Zhang Z, Buti M, Hutchinson SJ, Guo Y, Calleja JL, Lin L, Zhao L, Chen Y, Janssen HLA, Zhu C, Shi L, Tang X, Gaggar A, Wei L, Jia J, Irving WL, Johnson PJ, Lampertico P, Hou J. aMAP risk score predicts hepatocellular carcinoma development in patients with chronic hepatitis. J Hepatol. 2020;73:1368–1378. doi: 10.1016/j.jhep.2020.07.025. [DOI] [PubMed] [Google Scholar]
- 44.Shi M, Chen MS, Sekar K, Tan CK, Ooi LL, Hui KM. A blood-based three-gene signature for the non-invasive detection of early human hepatocellular carcinoma. Eur J Cancer. 2014;50:928–936. doi: 10.1016/j.ejca.2013.11.026. [DOI] [PubMed] [Google Scholar]
- 45.Han Z, Feng W, Hu R, Ge Q, Ma W, Zhang W, Xu S, Zhan B, Zhang L, Sun X, Zhou X. RNA-seq profiling reveals PBMC RNA as a potential biomarker for hepatocellular carcinoma. Sci Rep. 2021;11:17797. doi: 10.1038/s41598-021-96952-x. [DOI] [PMC free article] [PubMed] [Google Scholar]
- 46.Tsai PC, Kuo HT, Hung CH, Tseng KC, Lai HC, Peng CY, Wang JH, Chen JJ, Lee PL, Chien RN, Yang CC, Lo GH, Kao JH, Liu CJ, Liu CH, Yan SL, Bair MJ, Lin CY, Su WW, Chu CH, Chen CJ, Tung SY, Tai CM, Lin CW, Lo CC, Cheng PN, Chiu YC, Wang CC, Cheng JS, Tsai WL, Lin HC, Huang YH, Yeh ML, Huang CF, Hsieh MH, Huang JF, Dai CY, Chung WL, Chen CY, Yu ML T-COACH Study Group. Metformin reduces hepatocellular carcinoma incidence after successful antiviral therapy in patients with diabetes and chronic hepatitis C in Taiwan. J Hepatol. 2022 doi: 10.1016/j.jhep.2022.09.019. [Epub ahead of print] [DOI] [PubMed] [Google Scholar]
- 47.Degasperi E, D’Ambrosio R, Iavarone M, Sangiovanni A, Aghemo A, Soffredini R, Borghi M, Lunghi G, Colombo M, Lampertico P. Factors associated with increased risk of de novo or recurrent hepatocellular carcinoma in patients with cirrhosis treated with direct-acting antivirals for HCV infection. Clin Gastroenterol Hepatol. 2019;17:1183–1191. e7. doi: 10.1016/j.cgh.2018.10.038. [DOI] [PubMed] [Google Scholar]
- 48.Semmler G, Meyer EL, Kozbial K, Schwabl P, Hametner-Schreil S, Zanetto A, Bauer D, Chromy D, Simbrunner B, Scheiner B, Stattermayer AF, Pinter M, Schofl R, Russo FP, Greenfield H, Schwarz M, Schwarz C, Gschwantler M, Alonso Lopez S, Manzano ML, Ahumada A, Banares R, Pons M, Rodriguez-Tajes S, Genesca J, Lens S, Trauner M, Ferenci P, Reiberger T, Mandorfer M. HCC risk stratification after cure of hepatitis C in patients with compensated advanced chronic liver disease. J Hepatol. 2022;76:812–821. doi: 10.1016/j.jhep.2021.11.025. [DOI] [PubMed] [Google Scholar]
- 49.Vittinghoff E, McCulloch CE. Relaxing the rule of ten events per variable in logistic and Cox regression. Am J Epidemiol. 2007;165:710–718. doi: 10.1093/aje/kwk052. [DOI] [PubMed] [Google Scholar]
- 50.Steyerberg EW, Harrell FE Jr, Borsboom GJ, Eijkemans MJ, Vergouwe Y, Habbema JD. Internal validation of predictive models: efficiency of some procedures for logistic regression analysis. J Clin Epidemiol. 2001;54:774–781. doi: 10.1016/s0895-4356(01)00341-9. [DOI] [PubMed] [Google Scholar]
- 51.Waljee AK, Higgins PD, Singal AG. A primer on predictive models. Clin Transl Gastroenterol. 2014;5:e44. doi: 10.1038/ctg.2013.19. [DOI] [PMC free article] [PubMed] [Google Scholar]