Abstract
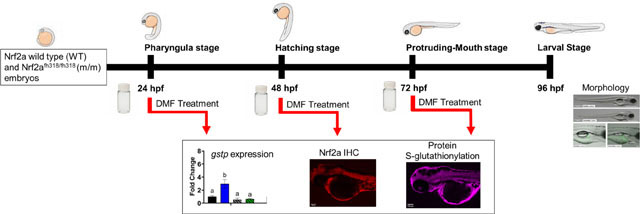
Dimethyl fumarate (DMF) is pharmaceutical activator of the transcription factor nuclear factor erythroid 2-related factor 2 (Nrf2), which regulates of many cellular antioxidant response pathways, and has been used to treat inflammatory diseases such as multiple sclerosis. However, DMF has been shown to produce adverse effects on offspring in animal studies and as such is not recommended for use during pregnancy. The goal of this work is to better understand how these adverse effects are initiated and the role of DMF-induced Nrf2 activation during three critical windows of development in embryonic zebrafish (Danio rerio): pharyngula, hatching, and protruding-mouth stages. To evaluate Nrf2 activation, wildtype zebrafish, and mutant zebrafish (nrf2afh318/fh318) embryos with a loss of function mutation in Nrf2a, the co-ortholog to human Nrf2, were treated for 6 hours with DMF (0–20 μM) beginning at the pharyngula, hatching, or protruding-mouth stage and assessed for survival and morphology. Nrf2a mutant fish had an increase in survival, however, morphology studies demonstrated Nrf2a mutant fish had more severe deformities occurring with exposures during the hatching stage. To verify Nrf2 cellular localization and downstream impacts on protein-S-glutathionylation in situ, a concentration below the LOAEL was chosen (7 μM) for immunohistochemistry and S-glutathionylation. Embryos were imaged via epifluorescence microscopy studies, the Nrf2a protein in the body tissue was decreased with DMF only when exposed at the hatching stage, while total protein S-glutathionylation was modulated by Nrf2a activity and DMF during the pharyngula and protruding-mouth stage. The pancreatic islet and liver were further analyzed via confocal microscopy. Pancreatic islets and liver also had tissue specific differences with Nrf2a protein expression and protein S-glutathionylation. This work demonstrates how critical windows of exposure and Nrf2a activity may influence toxicity of DMF and highlights tissue-specific changes in Nrf2a protein levels and S-glutathionylation in pancreatic islet and liver during embryonic development.
Keywords: Dimethyl fumarate (DMF), Nrf2, Developmental toxicity, glutathionylation, Danio rerio
Graphical Abstract
Introduction
Dimethyl fumarate (DMF), also known by its trade name Tecfidera®, is a Food and Drug Administration (FDA) approved drug for the treatment of relapsing forms of multiple sclerosis (MS) in the United States [http://www.fda.gov]. DMF also has additional pharmacological effects, such as antioxidant, anti-inflammatory, and anticancer activities [1]–[4]. DMF’s primary mechanism of action involves activation of the transcription factor nuclear factor erythroid 2-related factor 2 (Nrf2), although there are also additional Nrf2-independent pathways as well [5]–[7]. Nrf2 is the master regulator of gene expression for many cellular antioxidant response pathways and responds to oxidative stress and autophagy disruptions [8],[9]. Under oxidative conditions, cysteine residues on Kelch-like ECH-associated protein 1 (Keap1), an adaptor subunit of Cullin 3-based E3 ubiquitin ligase which normally binds Nrf2, are modified; this stabilizes Nrf2 and disrupts ubiquitination, and thus de novo Nrf2 can proceed unhindered to the nucleus, where Nrf2 binds to antioxidant response elements (ARE) [10]. AREs are located in the promoter regions of genes encoding for glutathione (GSH) synthesis and recycling (i.e. upregulation of glutathione reductase; GSR), reactive oxygen species (ROS) elimination, phase 2 detoxification enzymes, phase 3 transporters, and others that combat xenobiotic-induced redox stress [11]. DMF is specifically able to activate Nrf2 by interacting with the cysteine 151 residue of Keap1 [12], and thereby rectify GSH deficiencies in MS [7],[9]. However, under some circumstances, DMF can also lead to a transient but concentration-dependent depletion of GSH, as reported in human astrocytes [16]. Due to DMF’s electrophilic properties, DMF can also react with other nucleophilic cysteine residues in proteins; proteomic analysis of human and mouse T lymphocytes found ~1500 proteins with DMF-sensitive cysteine residues, and some of the identified proteins had established immune regulatory functions [17]. This electrophilic activity is a likely mechanism of action related to DMF-induced Nrf2 activation and may play a role in Nrf2-independent effects of DMF.
Glutathione redox status is especially important during development because it plays an important role in cell fate decisions [18]. It is therefore not surprising that DMF is not recommended for use during pregnancy due to observed adverse effects on offspring survival, growth, sexual maturation, and neurobehavioral function observed in rodents and rabbits [13][14]. As a large proportion of MS patients are women of childbearing age [15],[16], there is a clear need to understand the potential mechanisms related to DMF toxicity on offspring. By understanding the toxicity mechanisms and critical windows of exposure during development, this will further understanding of potential risks of DMF to offspring at specific stages of development.
The zebrafish (Danio rerio) due to its rapid development and ease of precise, temporal exposures at specific developmental stages, has been used to study changes in the GSH redox system during development. In the zebrafish embryo, the GSH redox potential and amount of cellular GSH fluctuates in concordance with stages of development [23]. During the pharyngula stage (starting at 24 hours post fertilization [hpf]), the redox potential is oxidized with low concentrations of total GSH; during the hatching stage (starting at 48 hpf), the redox potential remains oxidized, while the GSH concentration is increased, and during the protruding-mouth stage (starting at 72 hpf), the redox potential shifts from a more oxidized to reduced state [17],[22]. Embryos are inherently highly susceptible to exogenous sources of redox modulation, and perturbation of redox balance has been linked to teratogenesis in rats and mice, as well as insulin resistance, dysregulated glucose levels in developing β cells, and liver growth and development [24]–[27]. Previous studies of redox modulation in our laboratory has found that 24, 48, and 72 hpf are each critical windows of redox modulation [28]. Although there has been extensive research of the role and effectiveness of DMF as a Nrf2 activator, only a handful of studies has evaluated DMF in the zebrafish [29]–[31], where adverse effects of DMF included curvature of the spine and tail, and reduction of heart size and function [30].
In the study herein, Nrf2 activation by DMF is evaluated during three critical windows of zebrafish development (pharyngula, hatching, and protruding-mouth stage). In this work, we evaluate the specific role of Nrf2a, the co-ortholog to human Nrf2, activation using a wildtype and mutant zebrafish line (nrf2afh318/fh318) with a point mutation in the DNA binding domain of Nrf2a [32]. This mutation largely inhibits the transcriptional activity of Nrf2a while preserving the cytosolic interactions with Keap1. We hypothesize that toxicity of DMF will be dependent on critical developmental windows defined by GSH content and redox potential and Nrf2a transcriptional activity. In addition to the effects of DMF on embryo survival and morphology, we report spatio-temporal and tissue-specific changes in Nrf2a protein levels and S-glutathionylation. This work expands our understanding of developmental redox biology in a stage and tissue-specific context.
Materials and Methods
Chemicals and Reagents:
Dimethyl Fumarate (DMF; Catalog #242926) was purchased from Millipore-Sigma (Burlington, MA, USA). Paraformaldehyde (PFA), Phosphate Buffered Saline (PBS), Methanol, Tween-20, and Dimethyl Sulfoxide (DMSO) were purchased from Fisher Scientific (Pittsburgh, PA, USA). Vectashield Antifade Mounting Medium with DAPI was purchased from Vector Laboratories (Burlingame, CA, USA). Chicken Anti-Rabbit IgG AlexaFluor 594 (Catalog #A-21442), AlexaFluor 568 tagged Streptavidin (Catalog #S11226), and Biotinylated Glutathione Ethyl Ester (BioGee; Catalog #G36000) were purchased from Invitrogen (Carlsbad, CA, USA). 2-Mercaptoethanol (BME) was purchased from MP Biomedicals (Solon, OH). RNAlater Stabilization Solution, GeneJET RNA Purification Kit, and custom primers were purchased from Thermo Fisher Scientific (Waltham, MA). iScript cDNA Synthesis Kit and iQ SYBR Green Supermix was purchased from Bio-Rad (Hercules, CA).
Fish Husbandry:
All zebrafish (Danio rerio) maintenance and procedures were conducted in accordance with the Guide for the Care and the Use of Laboratory Animals of the National Institutes of Health and with approval from the University of Massachusetts Amherst Institutional Animal Care and Use Committee (Animal Welfare Assurance Number A3551–01). Homozygous wild type (nrf2a+/+) and nrf2afh318/fh318 [32] embryos were crossed with Tg(insa:eGFP) [33] on an AB strain background for observation of the β-cells in vivo and to investigate the activity of Nrf2a. Large breeding tanks with approximately 20 adult female and 10 adult male fish were maintained on an automated Aquaneering (San Diego, CA, USA) system; the fish were housed at 28.5 °C on a 14-hr light, 10-hr dark cycle, and fed GEMMA Micro 300 (Skretting, Westbrook, ME, USA) twice daily. Embryos were collected at 1 hpf, washed and screened for fertilization status and staged according to Kimmel et al. [34]. The embryos were dechorionated at 24 hpf and reared in borosilicate glass scintillation vials with 1 ml Danieau’s solution [17 mM NaCl, 2 mM KCl, 0.12 mM MgSO4, 1.8 mM Ca(NO3)2, 1.5 mM HEPES, pH 7.6] per embryo.
Chemical Exposures:
For the survival studies, Nrf2a wild type (WT) and Nrf2a m/m zebrafish were treated with a static aqueous exposure to 0, 5, 7.5, 10, 15, or 20 μM DMF in 0.01% DMSO in Danieau’s solution, starting at either the pharyngula stage (24 hpf), hatching stage (48 hpf), or protruding-mouth stage (72 hpf) and continued until 96 hpf, prior to when the larvae would transition from yolk sac nutrition to solid food.
To identify key critical developmental windows, in a subsequent set of experiments, embryos were exposed to DMF for only 6 hrs during the pharyngula stage (24 to 30 hpf), hatching stage (48 to 54 hpf), and protruding-mouth stage (72 to 78 hpf), a period sufficient to activate Nrf2 in other studies [34],[35]. For morphology endpoints, sublethal concentrations of DMF were selected and WT and Nrf2a m/m embryos were treated with 0, 5, 7, and 10 μM DMF in 0.01% DMSO for 6 hrs. After exposure, embryos were washed and maintained in Danieau’s solution until 96 hpf when the larvae would be live imaged for morphological evaluation. Based on the survival and morphology experiments, 7 μM DMF was selected for further evaluation of Nrf2a expression and S-glutathionylation studies. Embryos were exposed to 7 μM DMF for 6 hrs during the pharyngula stage, hatching stage, or protruding-mouth stage. Following the 6 hr exposure, embryos were immediately fixed in 4% PFA for immunohistochemistry (IHC) or preserved in RNAlater for qPCR experiments. For the S-glutathionylation exposures, embryos were exposed for 6 hrs and then washed and maintained in Danieau’s solution for an additional 24 hours, allowing sufficient time for the GSH system to respond. The embryos were then exposed to 100 μM BioGee for 2 hrs before fixation (i.e. 22–24 hours post exposure to DMF) in 4% PFA to incorporate a biotin label onto glutathionylated proteins which is increased under oxidative stress conditions [37].
Immunohistochemistry:
Embryos were fixed at a ratio of 15 embryos per 1 ml 4% PFA in PBS for 24 hrs at 4°C. Embryos were then rinsed in 0.1% Tween-20 in PBS (PBST) and stored in 100% methanol at −20°C. Samples were first rehydrated using methanol-PBST gradients, and the rehydrated samples were then heated at 70°C for 20 minutes for antigen retrieval. Immediately following heat retrieval, samples were permeabilized using ice-cold acetone for 8 minutes. Samples were incubated in blocking solution, 5% Sheep’s serum in PBST, for 2 hrs at room temperature. Sample were then incubated with the previously characterized zebrafish-specific anti-Nrf2a polyclonal antibody [38] (1:1000 in blocking solution) for 24 hrs at 4°C. Samples were placed in Alexa tagged anti-rabbit antibody (1:5000 in blocking solution) overnight. Samples were washed with PBST and stored in Vectashield containing DAPI at 4°C until imaging. For BioGee samples, embryos were exposed to 100 μM BioGee for 2 hrs prior to fixation. Following fixation, all steps were identical until after blocking. Post-blocking, samples were placed in AlexaFluor 594 tagged Streptavidin (1:5000 in blocking solution) for 1 hr at room temperature. Samples were then washed with PBST and stored in Vectashield containing DAPI at 4°C until imaging. A subset of embryos was run through the entire IHC procedure, without exposing them to BioGee or primary antibody as a control for non-specific binding.
RNA isolation and qRT-PCR analysis:
Following 6 hr exposures to 7 μM DMF during the pharyngula stage, hatching stage, and protruding-mouth stage, embryos were collected, pooled in groups of 15–20 embryos for the hatching and protruding mouth stages, or 30–40 for pharyngula stage embryos, and preserved in RNAlater at −80 °C until processing. For RNA isolation, embryos were transferred to lysis buffer, and sonicated by pulsing 3 times with an Emerson Industrial Branson Sonifier® (Danbury, CT). RNA isolation was performed using BME and a GeneJET RNA Purification Kit following manufacturer instructions. RNA quantity and quality were assessed using a BioDrop μLITE spectrophotometer (Cambridge, United Kingdom). 500 ng of RNA was converted to cDNA using iScript cDNA synthesis kit according to manufacturer’s instructions. Sample cDNA was diluted 1:9 with nuclease-free water and stored at −80 °C. Each qRT-PCR reaction was prepared using 10 μL of 2X iQ SYBR Green Supermix, 300 nM each of forward and reverse primers (1.2 μL total), 4.8 μL of nuclease-free water, and 4 μL of diluted cDNA. Samples were run on 96-well plates in a CFX Connect Real-Time PCR Detection System (Bio-Rad), and samples were analyzed using the CFX Manager software (Bio-Rad). qRT-PCR was carried out in triplicate for each gene with primers targeted for glutathione S-transferase P (gstp; 5’-CGACTTGAAAGCCACCTGTGTC-3’ and 5’-CTGTCGTTTTTGCCATATGCAGC-3’), β2-Microglobulin (b2m; 5’-CTGAAGAACGGACAGGTTATGT-3’ and 5’-ACGCTGCAGGTATATTCATCTC-3’), and β-actin (actb; 5’-CAACAGAGAGAAGATGACACAGATCA-3’ and 5’-GTCACACCATCACCAGAGTCCATCAC-3’). Gstp gene transcription fold-change were calculated using the ΔΔCT method [39] and b2m was used as a housekeeping gene, and its transcription did not change significantly across exposure groups. The β-actin (actb) gene was used as a secondary housekeeping gene to verify gene transcription patterns (data not shown).
Microscopy and Image Analysis:
For morphological analysis, larvae were imaged at 96 hpf to observe the effects of exposure on the development of the primary islet, using an upright ZEISS Axio Zoom.V16 microscope equipped with a Zeiss Axiocam ERc_5s camera and Zen analysis software (Zeiss, White Plains, NY). Fish were briefly anesthetized in Danieau’s solution containing 2% v/v MS-222 (prepared as 4 mg/mL tricaine powder in water, pH buffered, and stored at −20 °C until thawed for use) and positioned in a lateral position in 3% methylcellulose to optimize visualization of the endocrine islet. Images were captured using monochrome and GFP fluorescence filters at 20X and 100X magnification to assess gross morphology. Images were blinded, then analyzed using Fiji open source software [40] to measure morphological endpoints (ie. Length, yolk sac area). Islet area was determined by tracing the perimeter of the cell cluster on the 100X GFP images.
Embryos that went through IHC (Nrf2a or BioGee) were imaged under a confocal microscope to better visualize individual tissues. The Nikon A1R-SIMe (Nikon TiE stand with A1 Resonant Scanning Confocal and N-SIM Structured Illumination Super-Resolution) microscope was used to image the embryo body and pancreatic islets, and a Nikon A1SP (Nikon TiE stand with A1 Spectral Detector Confocal) microscope was used to image livers (Nikon Instruments Inc., Melville, NY). Both microscopes were equipped with 405 nm, 488 nm, 561 nm and 640 nm laser lines. Images were taken on the TRITC (Nrf2 or BioGee), FITC (Insulin), and DAPI (nuclei) channels using the same laser intensity and gain for each image. Single layer body tissue images of the fish focused on the endocrine pancreas were taken using the 10x objective. Z-stacks were taken of the entire endocrine pancreas using the 40x objective. Single layer images of the fish focused on the liver and gut were taken using the 40x objective. Sequence scanning was used to eliminate cross-channel fluorescence overlap. Confocal images presented were flipped horizontally to reflect the biological orientation. All images were blinded before analysis.
Fiji open source software [40] was used to measure mean Nrf2a and BioGee fluorescent intensity in the body, brain, heart, gut, and pancreas using the 10x images and liver using 40x images. The mean fluorescent intensity of the background was measured and subtracted from the image fluorescent measurements. A batch analysis workflow was created on NIS elements (Nikon Instruments Inc., Melville, NY) to measure islet volume and Nrf2a and BioGee fluorescent intensity in the β cells. A threshold was set using the FITC channel to specifically measure the GFP-labeled pancreatic β-cells. Then, using the region defined by the FITC channel, the mean fluorescent intensity of the TRITC channel (Nrf2a or BioGee) was measured.
Colocalization:
The colocalization analysis was performed using the Coloc-2 plug-in for Fiji [38],[39]. The analysis was performed on 40x confocal images of the liver, and a representative image of pancreatic islet taken from the Z-stack to evaluate differences in Nrf2a localization between the two tissue types. The liver and islet (FITC channel) were selected as the regions of interest (ROI). Then, the TRITC (Nrf2a) and DAPI (nuclei) channels were analyzed using the Coloc-2 plug-in at the ROI to generate Pearson’s R value. The Pearson’s R coefficient was then converted to a normally distributed Z-score using Fisher’s Z-Transformation after which the Z-scores were then analyzed for significance.
Statistics:
To assess statistical significance, Analysis of Variance (ANOVA) tests, followed by a Fishers Least Significant Differences (LSD) Post-Hoc Test were performed in GraphPad Prism v8.4.0.671 (La Jolla, CA). Chi-squared (χ2) tests were carried out using Excel. Significance was considered to be p < 0.05.
Results
Survival Studies:
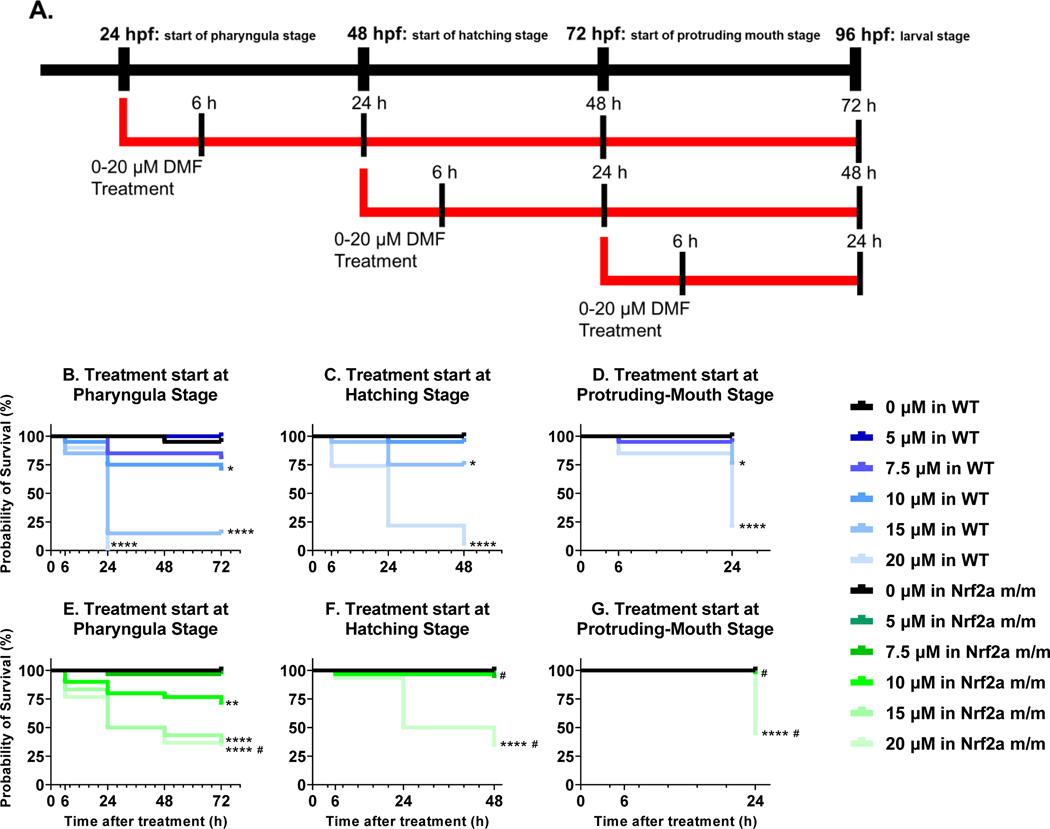
Zebrafish embryos were treated with a static aqueous exposure of 0–20 μM DMF starting at pharyngula stage (24 hpf), hatching stage (48 hpf), or protruding-mouth stage (72 hpf), that continued until 96 hpf (Fig. 1A). As expected in the wild type (WT) embryos, there was a dose-dependent increase in mortality with DMF, and an increase in mortality with DMF exposures starting at earlier timepoints (Fig. 1B-D). WT embryos with DMF exposures starting at the pharyngula stage, had 30%, 85%, and 100% mortality at doses of 10, 15, and 20 μM DMF, respectively (Fig. 1B). WT embryos with DMF exposures starting at the hatching stage, at doses of 15 and 20 μM DMF, had 25%, and 96% mortality at 96 hpf, respectively (Fig. 1C). Lastly, the WT embryos with exposures starting at the protruding-mouth stage at doses of 15 and 20 μM DMF, had 25%, and 80% mortality at 96 hpf, respectively (Fig. 1D). Interestingly, in the Nrf2a m/m embryos, the probability of survival was increased compared to WT embryos (Fig. 1E-G). At the 20 μM DMF doses, Nrf2a m/m embryos had a lower mortality by ~30% for all treatment paradigms.
Fig. 1.
A) Treatment paradigm for survival studies. Kaplan-Meier survival curves for zebrafish treated with 0–20 μM dimethyl fumarate (DMF) starting at the pharyngula stage (B and E), starting at the hatching stage (C and F), and starting at the protruding-mouth stage (D and G) and continued until 96 hours post fertilization (hpf). Graphs B-D are curves for wild type (WT) fish, and Graphs E-G are curves for Nrf2a m/m fish. Calculations were performed using a log-rank Mantel–Cox test. N = 20 WT and 30 Nrf2a m/m fish. * p ≤ 0.05, ** p ≤ 0.01, *** p ≤ 0.001, and **** p ≤ 0.0001 verses untreated controls, and # P ≤ 0.05 verse WT and Nrf2a m/m within each dose group (i.e., 0 μM in WT vs 0 μM in Nrf2a m/m).
Morphology:
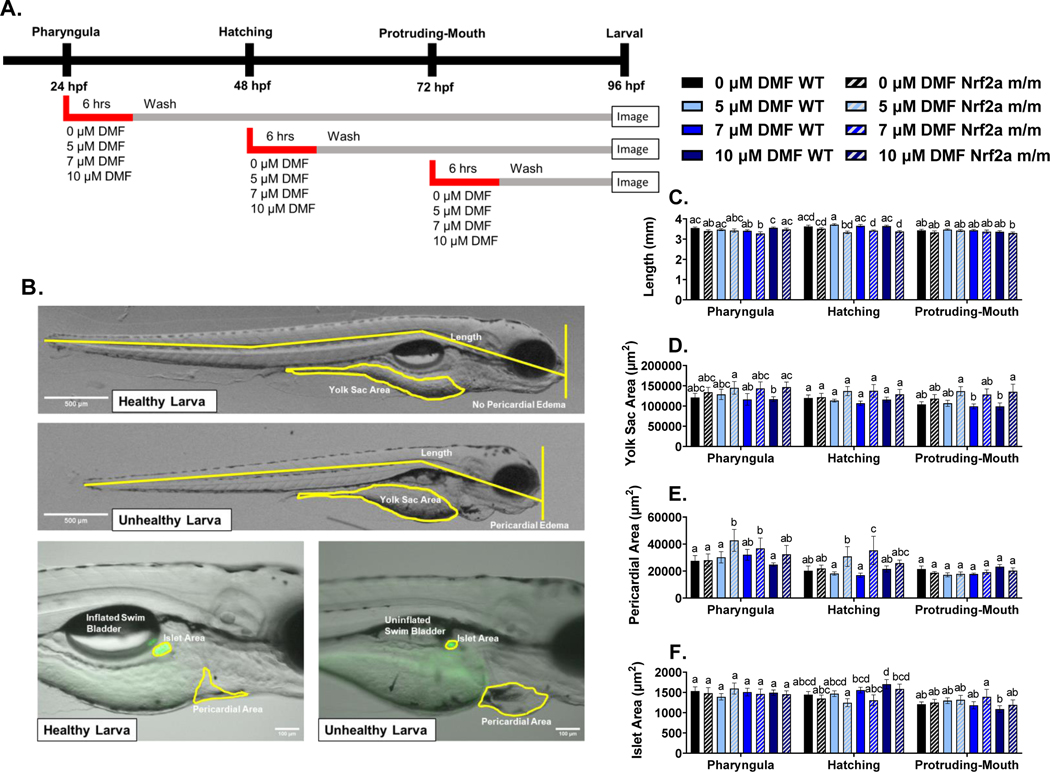
As depicted in Fig. 2 and summarized in Table 1, WT embryos exposed to DMF had minimal changes in morphology outcomes, while Nrf2a m/m larvae exposed to DMF had several adverse morphology outcomes at various exposure timepoints during development. Exposure to DMF during the pharyngula stage (24 – 30 hpf), impacted yolk sac area and pericardial area in Nrf2a m/m larvae. Exposure to 10 μM DMF in Nrf2a m/m embryos during the pharyngula stage increased yolk sac area by 24.3% compared to 10 μM DMF treated WT embryos. In Nrf2a m/m larvae, exposure to 5 and 7 μM DMF increased pericardial area by ~53% and ~32% compared to 0 μM DMF in WT embryos and Nrf2a m/m embryos, respectively. In the 5 μM DMF exposed Nrf2a m/m embryos, pericardial area was increase by 41.6% compared to 5 μM DMF in WT embryos.
Fig. 2.
A) Treatment paradigm for morphology studies. B) Representative images for 20x (top) and 100x images (bottom) of healthy and unhealthy larva. Yellow lines represent measurements and Ins:GFP is shown in green in 100x images. Mean ±SEM of C) larval length, D) yolk sac area, E) pericardial area, and F) islet area is shown via treatment, genotype, and exposure stage. Calculations were performed using a two-way ANOVA followed by Fisher’s LSD post-hoc test. N = 11–32 fish from 2 or 3 independent experiments. Different letters indicate significant differences (p ≤ 0.05) between treatment and genotype within each development stage.
Table 1.
Summary of Morphology Studies Measured at Larval Stage (96 hpf)
| Endpoint | 0 μM DMF | 5 μM DMF | 7 μM DMF | 10 μM DMF | |||||
|---|---|---|---|---|---|---|---|---|---|
| WT | Nrf2a m/m | WT | Nrf2a m/m | WT | Nrf2a m/m | WT | Nrf2a m/m | ||
| % With edema | Pharyngula | 20 | 18 | 29 | 35 | 44 | 41 | 21 | 20 |
| Hatching | 7 | 18 | 0 | 38 | 12 | 38 | 6 | 53 * | |
| Protruding-Mouth | 0 | 12 | 0 | 10 | 0 | 11 | 0 | 25 | |
| % With uninflated Swim Bladder | Pharyngula | 58 | 63 | 75 | 64 | 61 | 58 | 50 | 62 |
| Hatching | 21 | 31 | 6 | 20 | 6 | 38 | 20 | 38 | |
| Protruding-Mouth | 31 | 37 | 40 | 37 | 23 | 50 | 22 | 25 | |
| Length | - | - | - | Hatching: ↓ vs 5 μM DMF WT | - | Hatching: ↓ vs 7 μM DMF WT | - | Hatching: ↓ vs 10 μM DMF WT | |
| Yolk Sac Area | - | - | - | - | - | - | - | Pharyngula & Protruding-mouth: ↑ vs 10 μM DMF WT | |
| Pericardial Area | - | - | - | Pharyngula & Hatching: ↑ vs 0 μM DMF (WT and m/m) & 5 μM DMF WT | - | Pharyngula & Hatching: ↑ vs 0 μM DMF (WT and m/m) & 7 μM DMF WT | - | - | |
| Islet Area | - | - | Hatching: Non-significant ↑ vs 0 μM DMF WT | ||||||
X2 (7, N = 118) = 2.64, P < 0.05, with Bonferroni correction
Exposure to DMF during the hatching stage (48 – 54 hpf) impacted body length, and pericardial area in Nrf2a m/m larvae. Nrf2a m/m larvae exposed to 5, 7, and 10 μM DMF during the hatching stage had a shorter length by 10.3%, 6.5%, and 7.3%, respectively, compared to DMF treated WT embryos. In Nrf2a m/m larvae, exposure to 5 and 7 μM DMF during the hatching stage increased pericardial area by 52.2% and 74.6% compared to 0 μM DMF treatment in WT embryos, by 40.5% and 61.2% compared to 0 μM DMF in Nrf2a m/m embryos, and by 69.6% and 108.5% compared to 5 and 7 μM DMF in WT embryos, respectively. Additionally, at this timepoint the incidence of pericardial edema was increased from 6% in WT embryos treated with 10 μM DMF to 53% in Nrf2a m/m embryos treated with 10 μM DMF (Table 1). Although not significant (P=0.07), islet area increased by 17.8% with the treatment of 10 μM DMF in WT embryos.
There were minimal observed changes in morphology with exposures to DMF during the protruding-mouth stage (72 – 78 hpf). Exposure to 10 μM DMF in Nrf2a m/m embryos during the protruding-mouth stage increased yolk sac area by 36.4% compared to 10 μM DMF treated WT embryos. There was no significant anomalous islet morphology observed with DMF treatment in WT and Nrf2a m/m embryos at any timepoint (Supplemental Fig. 1).
Spatio-temporal changes in Nrf2a protein levels:
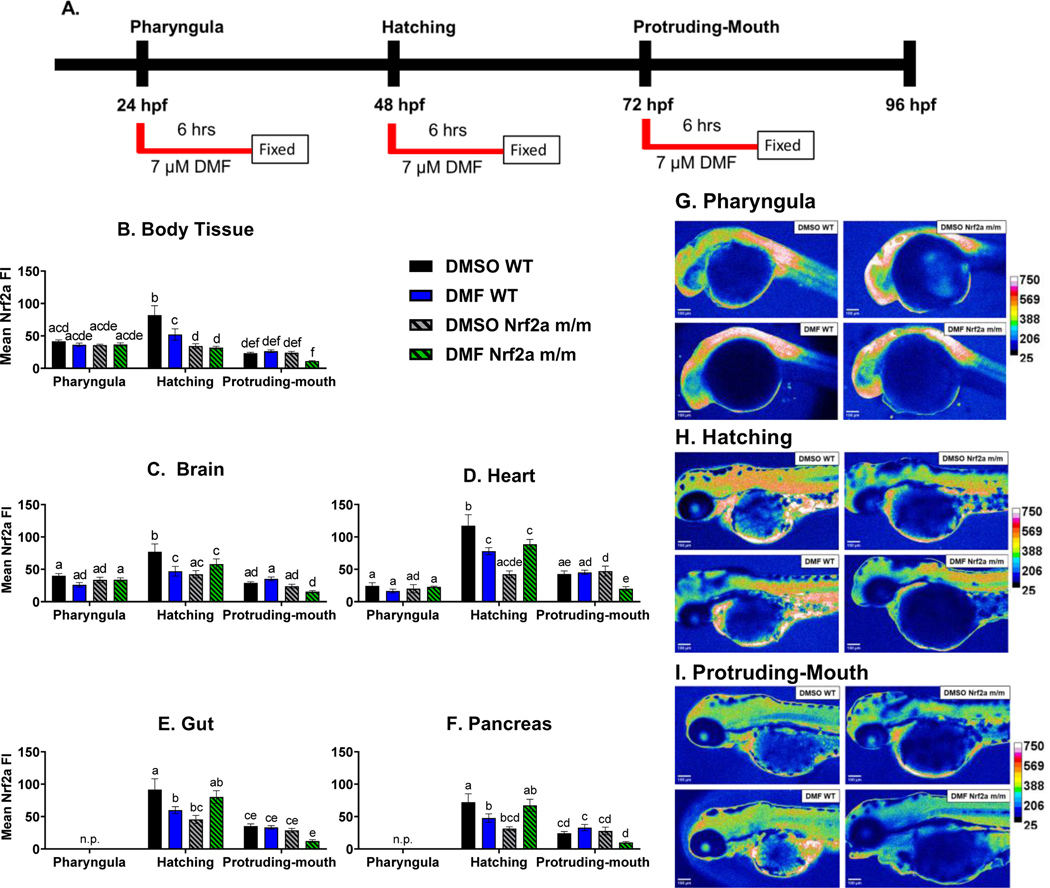
Zebrafish were treated with 7 μM DMF during the pharyngula, hatching, and protruding-mouth stage for 6 hrs, then immediately fixed and immunohistochemistry was used to detect Nrf2a protein in situ (Fig. 3A). Nrf2a protein in the body tissue (Fig. 3B) was increased at hatching stage by 97% and 252% in the control WT group compared to the pharyngula and protruding-mouth stage, respectively. Only during the hatching stage, control Nrf2a m/m embryos had decreased Nrf2a fluorescence in the body tissue by 58% compared to control WT embryos; DMF treatment decreased body tissue Nrf2a fluorescence by 37% and in the WT embryos.
Fig. 3.
A) Zebrafish were treated with 7 μM DMF during the pharyngula, hatching, and protruding-mouth stage for 6 hours and then immediately fixed and Nrf2a protein was labeled via Immunohistochemistry (IHC). Mean fluorescence intensity (FI) of Nrf2a protein of the B) body tissue, C) brain, D) heart, E gut, and F) pancreases was determined. Representative heatmaps of Nrf2a protein florescence at the G) pharyngula, H) hatching, and I) protruding-mouth stage. n.p. indicates timepoints when organ was not present. Calculations were performed using a two-way ANOVA followed by Fisher’s LSD post-hoc test. N = 6–12 fish. Different letters indicate significant differences (p ≤ 0.05) between treatment, genotype, and time point.
Similar trends were also observed in the brain (Fig. 3C), heart (Fig. 3D), gut (Fig. 3E), and pancreas (Fig. 3F). Nrf2a protein was increased in the brain and heart in control embryos at hatching stage by 94% and 379% respectively, in the WT group compared to the pharyngula stage. In comparing hatching stage vs. the protruding mouth stage, control embryos at the hatching stage had greater Nrf2a protein fluorescence in the brain, heart, gut and pancreas (166%, 295%, 160% and 197% respectively). Nrf2a appears to be self-regulating its own expression at this stage, as Nrf2a m/m embryos had lower Nrf2a protein levels in the brain, heart, gut and pancreas (45%, 64%, 50%, and 56%, respectively, compared to WT embryos at the hatching stage). Exposure of hatching-stage embryos to DMF resulted in lower Nrf2a levels in the brain, heart, gut and pancreas by ~35%, in the WT embryos, and there was no change in the Nrf2a mutant embryos compared to the control Nrf2a mutant embryos. Nrf2a m/m embryos exposed to DMF at the protruding-mouth stage, had lower levels of Nrf2a by ~58% in the brain, heart, gut and pancreas, compared to time and treatment-matched WT embryos.
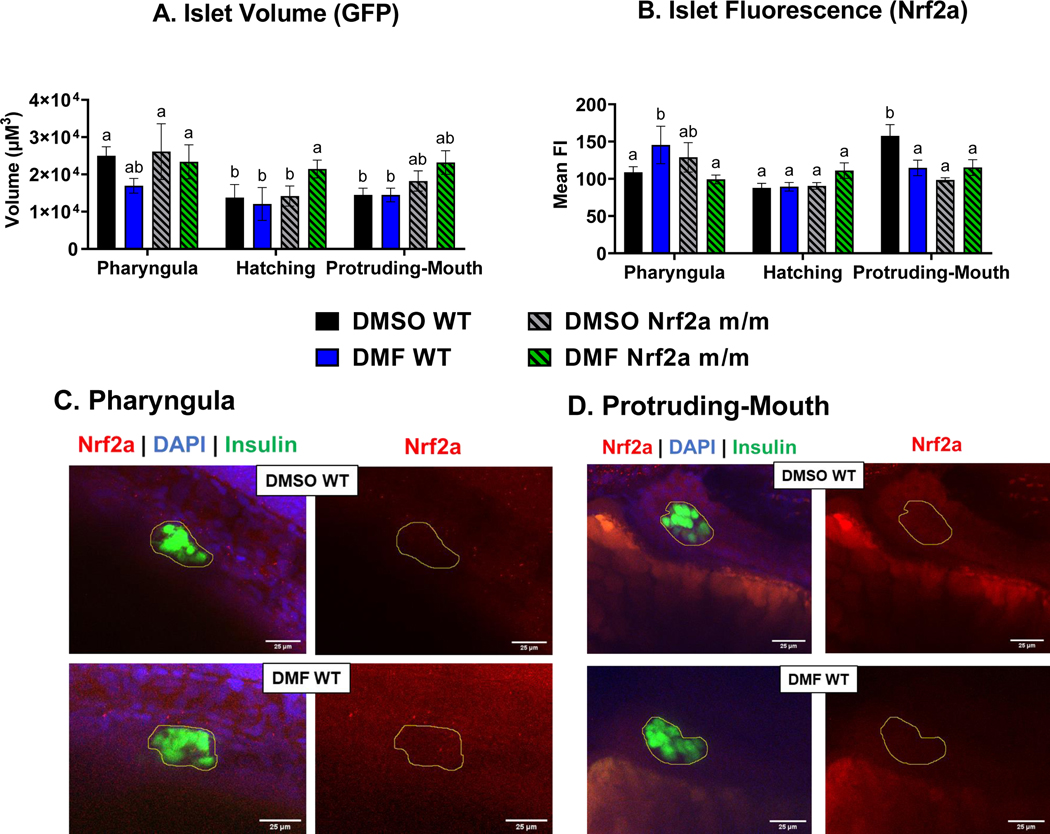
To image the pancreatic islet, confocal z-stacks were acquired from fixed embryos at different developmental stages and analyzed for volume and Nrf2 cellular localization in the β-cells. Control WT embryos during the hatching and protruding-mouth stages had a smaller islet volume (Fig. 4A) by 45% and 42%, respectively, compared to control WT embryos during the pharyngula stage. Nrf2a m/m embryos treated with DMF during the hatching stage had a larger islet volume by ~38% compared to DMF WT, control WT and Nrf2a m/m embryos treated during the hatching stage. Control WT embryos at the protruding-mouth stage had a greater amount of Nrf2a protein in the islet (Fig. 4B) by 24% and 39%, compared to the pharyngula and hatching stage, respectively. DMF treatment in the WT embryos during the pharyngula stage, but not the Nrf2a m/m embryos, increased islet Nrf2a protein by 28%. During the protruding-mouth stage, control Nrf2a m/m embryos had decreased islet Nrf2a fluorescence by 32% compared to WT embryos. DMF treatment in the WT embryos during the protruding-mouth stage increased islet Nrf2a protein by 31% compared to controls, while DMF treatment in the Nrf2a m/m embryos had no difference compared to control Nrf2a m/m embryos.
Fig. 4.
Zebrafish were treated with 7 μM DMF during the pharyngula, hatching, and protruding-mouth stage for 6 hours and then immediately fixed and Nrf2a protein was labeled via Immunohistochemistry (IHC). Z-stacks were taken of the entire endocrine pancreas using a confocal microscope under a 40x objective. A) Islet volume and B) islet mean fluorescence intensity (FI) of Nrf2a protein was determined via a batch analysis workflow was using Nikon NIS elements software. Representative images of the wild type (WT) zebrafish at the C) pharyngula and D) protruding-mouth stage are shown to demonstrate differences with DMF treatment. Images are max intensity projection of the z stack the pancreatic islet (circle in yellow) where FITC (green) represents the beta cells, TRITC (red) represents Nrf2a protein, and DAPI (blue) represents nuclei. Calculations were performed using a two-way ANOVA followed by Fisher’s LSD post-hoc test. N = 6–12 fish. Different letters indicate significant differences (p ≤ 0.05) between treatment, genotype, and time point.
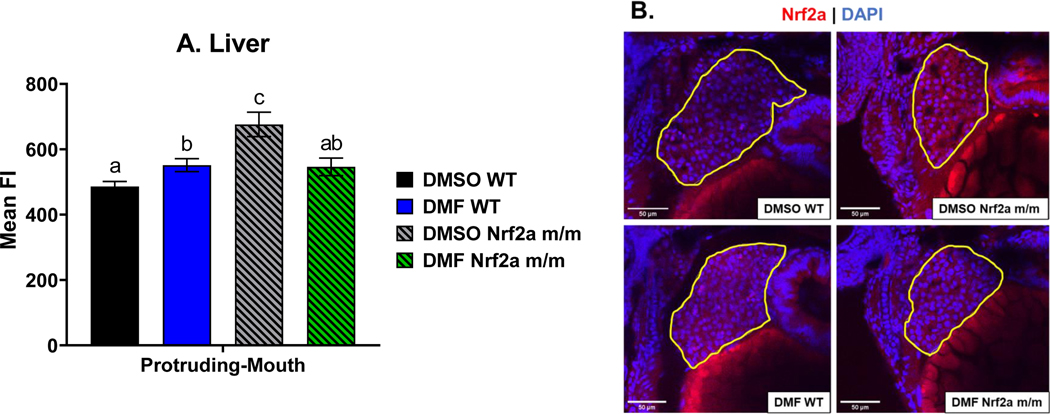
To measure Nrf2a in the liver, confocal images were taken under a 40x objective (Fig. 5). Control Nrf2a m/m embryos had a higher amount of liver Nrf2a protein by 39% compared to control WT embryos during the protruding-mouth stage. DMF treatment in WT increased liver Nrf2a protein by 13% compared to control WT embryos, and DMF treatment in Nrf2a m/m embryos decreased liver Nrf2a protein by 21% compared to control Nrf2a m/m embryos.
Fig. 5.
Zebrafish were treated with 7 μM DMF during protruding-mouth stage for 6 hours and then immediately fixed and Nrf2a protein was labeled via Immunohistochemistry (IHC). Images of the liver were taken using a confocal microscope under a 40x objective. A) Liver mean fluorescence intensity (FI) of Nrf2a protein was determined via image analysis. B) Representative images of the zebrafish liver are shown where the liver is circled in yellow, TRITC (red) represents Nrf2a, and DAPI (blue) represents nuclei. Calculations were performed using a one-way ANOVA followed by Fisher’s LSD post-hoc test. N = 8–13 fish. Different letters indicate significant differences (p ≤ 0.05) between treatment and genotype.
Colocalization:
Colocalization between anti-Nrf2a antibody staining and DAPI staining was used to compare relative amounts of Nrf2a in the nucleus. As previously stated, Nrf2 translocates into the nucleus when activated. Interestingly, the Nrf2a protein in the liver was significantly more localized to the nucleus than Nrf2a protein in the pancreatic islet by ~7-fold with DMF exposure at the protruding-mouth stage (Fig. 6). Differences in colocalization between treatments are presented in Supplemental Fig 2.
Fig. 6.
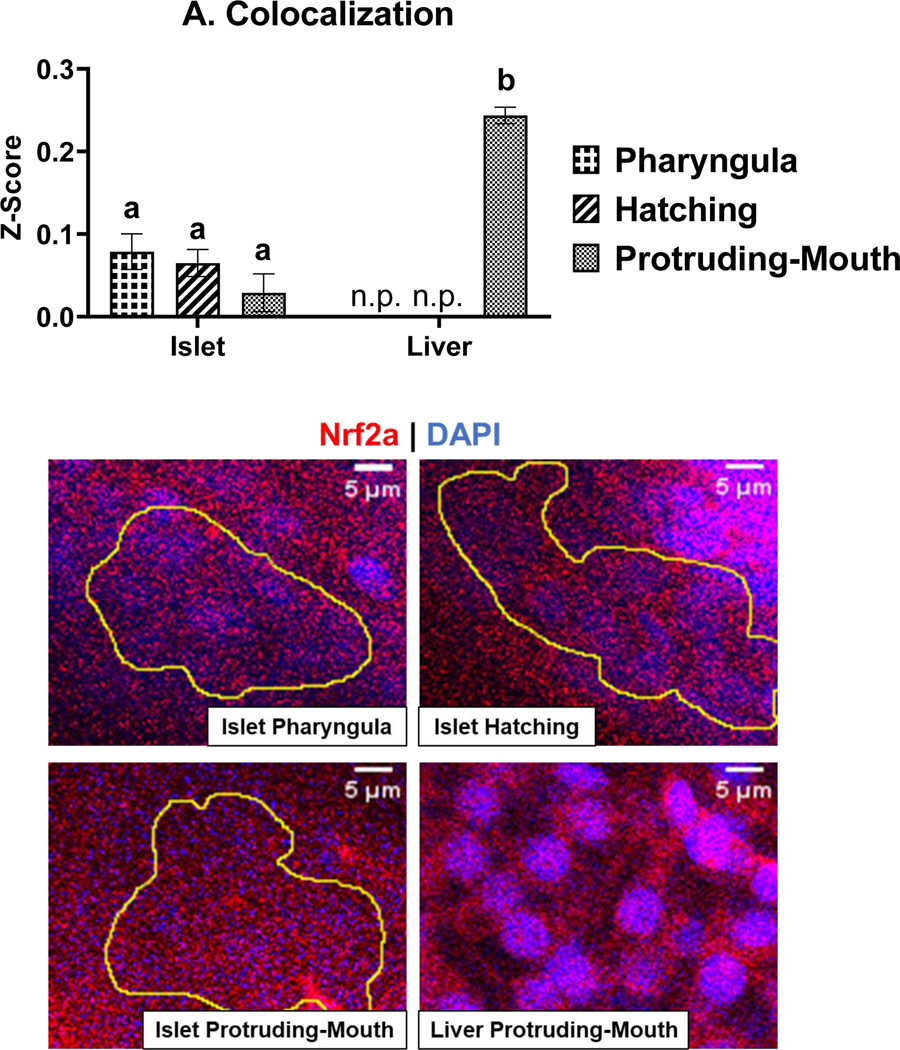
Zebrafish were treated with 7 μM DMF during the pharyngula, hatching, and protruding-mouth stage for 6 hours and then immediately fixed and Nrf2a protein was labeled via Immunohistochemistry (IHC). The colocalization analysis was performed on 40x confocal images of the liver, and a representative image of the pancreatic islet was taken from the Z-stack. The Pearson’s R coefficients of control (DMSO WT) embryos were converted to a normally distributed A) Z-scores and are shown as means ± SEM. Representative images, zoomed in to show individual cells of the pancreatic islet (yellow circle) and liver, are also shown to demonstrate Nrf2a protein (red) localization near the nuclei (blue). Calculations were performed using a one-way ANOVA followed by Fisher’s LSD post-hoc test. N = 6–12 fish. n.p. indicates timepoints when liver was not present. Calculations Different letters indicate significant differences (p ≤ 0.05).
Protein S-glutathionylation:
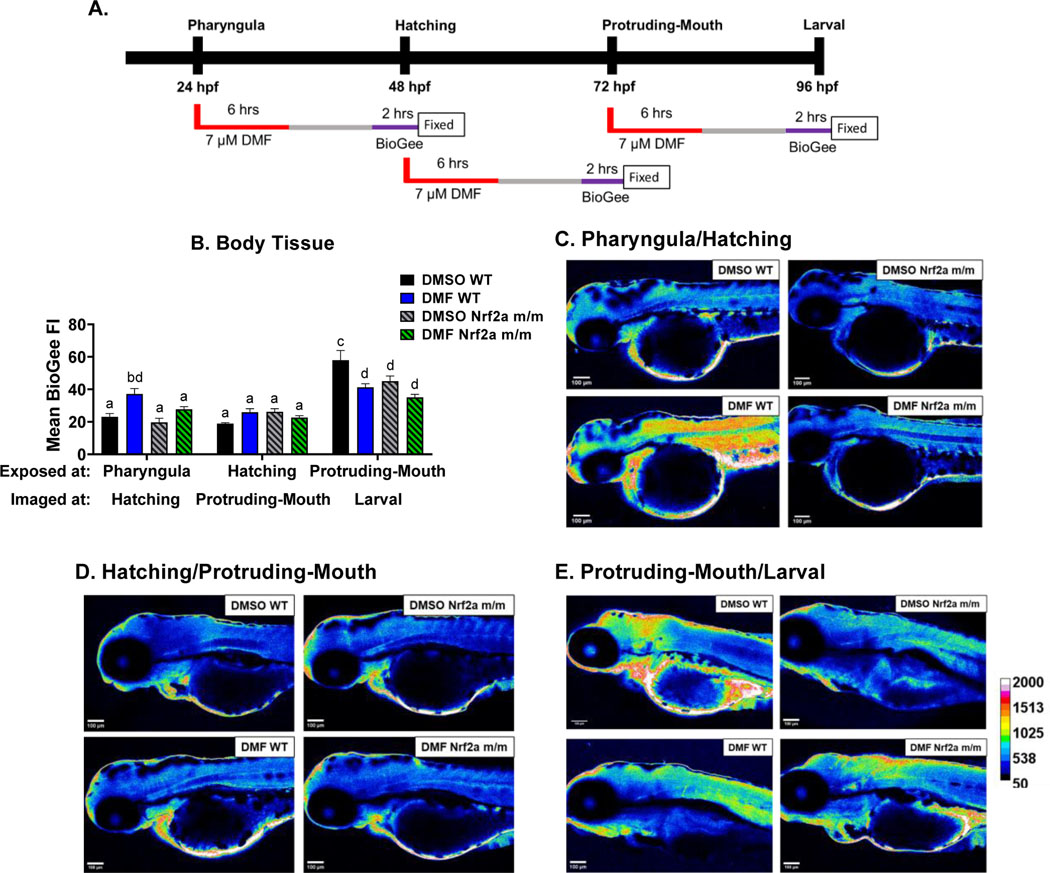
Zebrafish were treated with 7 μM DMF during the pharyngula, hatching, and protruding-mouth stage for 6 hours, washed, and then allowed to develop for an additional 24 hrs to capture downstream changes in protein-S-glutathyionylation following Nrf2a activation. Two hrs prior to fixation, embryos were immersed in 100 μM BioGee, and S-glutathionylation was labeled via IHC (Fig. 7A). The mean fluorescence intensity of protein S-glutathionylation in the body tissue (Fig. 7B) in the control WT embryos was highest at the larval stage, 150% higher than hatching stage and 207% higher than the protruding-mouth stage. The larval stage control Nrf2a m/m embryos displayed lower amounts of protein S-glutathionylation by 22% compared to control WT embryos. The only window of DMF exposure in the WT embryos that led to a subsequent increase in S-glutathionylation was the pharyngula/hatching stage, by 61%. In contrast, at the protruding-mouth/larval stage exposure window, DMF led to a decrease in S-glutathionylation in both genotypes by 29% in the WT and 22% in the Nrf2a m/m embryos.
Fig. 7.
A) Zebrafish were treated with 7 μM DMF during the pharyngula, hatching, and protruding-mouth stage for 6 hours, and then embryos were treated with BioGee for 2 hrs before fixation 24 hours after treatment, and BioGee protein conjugates were labeled in situ. B) Mean fluorescence intensity (FI) of BioGee protein conjugates of the body tissue was determined via image analysis. Representative heatmaps generated to visualize BioGee-protein conjugate florescence at the C) pharyngula/hatching, D) hatching/protruding-mouth, and E) hatching/protruding-mouth stage are shown. Calculations were performed using a two-way ANOVA followed by Fisher’s LSD post-hoc test. N = 8–10 fish. Different letters indicate significant differences (p ≤ 0.05) between treatment, genotype, and time point.
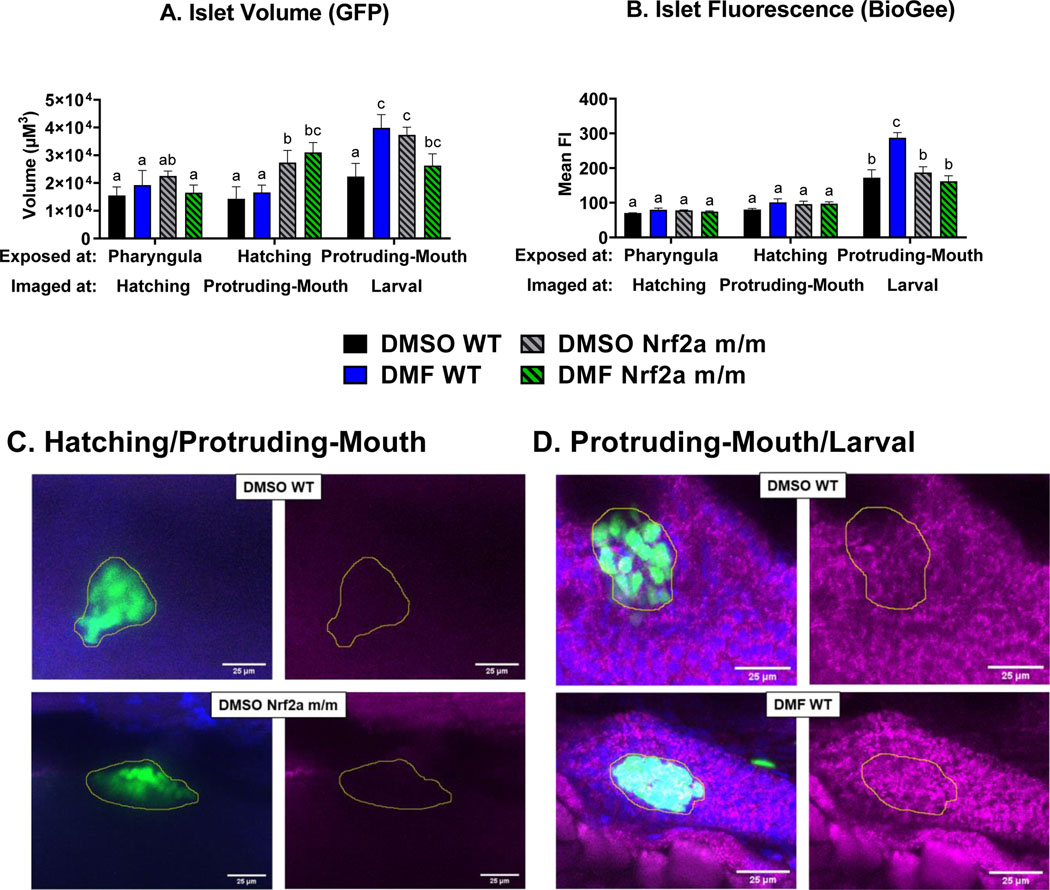
To analyze protein S-glutathionylation in the islet, confocal z-stacks were acquired and analyzed. Control Nrf2a m/m embryos at protruding-mouth and larval stage that were exposed during the hatching and protruding-mouth stage had larger islet volumes (Fig. 8A) by 91% and 67%, respectively, compared to control WT embryos. DMF treatment during the hatching stage increased islet volume by 16% in the Nrf2a m/m embryos at the protruding-mouth stage, however, DMF treatment during the protruding-mouth stage decreased islet volume by 13% in the Nrf2a m/m embryos at the larval stage compared to untreated control Nrf2a m/m embryos. Control WT embryos at the larval stage had an increase in islet S-glutathionylation (Fig. 8B) by 145% and 115%, compared to control WT embryos at the hatching and protruding-mouth stage, respectively. DMF treatment in the WT embryos during the protruding-mouth stage, but not the Nrf2a m/m embryos, increased islet S-glutathionylation by 65% at the larval stage.
Fig 8.
Zebrafish were treated with 7 μM DMF during the pharyngula, hatching, and protruding-mouth stage for 6 hours, and then embryos were treated with BioGee for 2 hrs before fixation 24 hours after treatment, and BioGee protein conjugates were labeled in situ. Z-stacks were taken of the entire endocrine pancreas using a confocal microscope under a 40x objective. A) Islet volume and B) islet mean fluorescence intensity (FI) of Nrf2a protein was determined via a batch analysis workflow was using Nikon NIS elements software. Representative images of the zebrafish at the C) hatching and D) protruding-mouth stage are shown to demonstrate differences with genotype and DMF treatment. Images are max intensity projections of the z stack the pancreatic islet (circle in yellow), where FITC (green) represents the beta cells, TRITC (purple) represents BioGee protein conjugates, and DAPI (blue) represents nuclei. Calculations were performed using a two-way ANOVA followed by Fisher’s LSD post-hoc test. N = 7–9 fish. Different letters indicate significant differences (p ≤ 0.05) between treatment, genotype, and time point.
Liver-specific protein S-glutathionylation was similarly interrogated with confocal microscopy (Fig. 9). Control WT embryos at the larval stage had greater liver S-glutathionylation by 31% compared to control WT embryos at the protruding-mouth stage (Fig. 9A). Control Nrf2a m/m embryos at the protruding-mouth and larval stage had an increase in liver S-glutathionylation by 25% and 39% compared to respective control WT embryos. DMF treatment during the hatching and protruding-mouth stage in only Nrf2a m/m embryos decreased liver S-glutathionylation by 6.8% and 16% respectively compared to control Nrf2a m/m embryos.
Fig. 9.
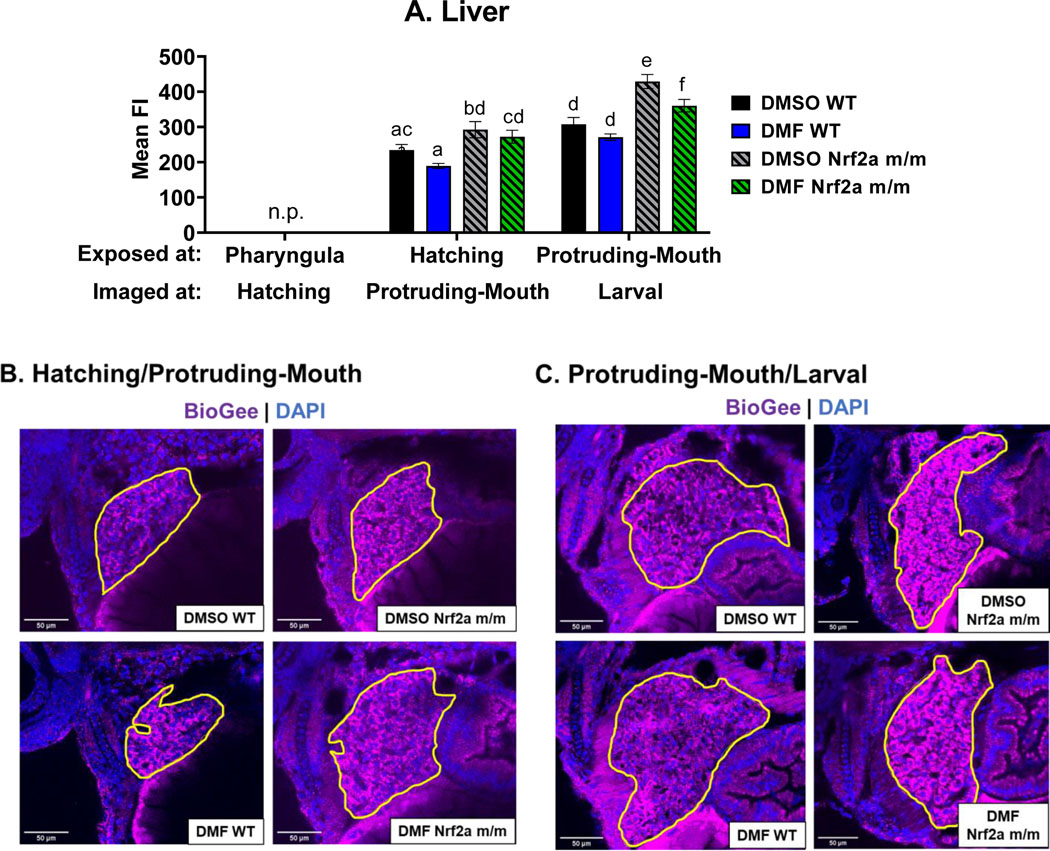
Zebrafish were treated with 7 μM DMF during hatching and protruding-mouth stage for 6 hours, and then embryos were treated with BioGee for 2 hrs before fixation 24 hours after treatment, and BioGee protein conjugates were labeled in situ. Images of the liver were taken using a confocal microscope under a 40x objective. A) Liver mean fluorescence intensity (FI) of Nrf2a protein was determined via image analysis. Representative images of the zebrafish liver treated during the B) hatching and C) protruding-mouth stage are shown where the liver is circled in yellow, where FITC (green) represents the beta cells, TRITC (purple) represents BioGee protein conjugates, and DAPI (blue) represents. n.p. indicates timepoints when liver was not present. Calculations were performed using a one-way ANOVA followed by Fisher’s LSD post-hoc test. N = 6–12 fish. Different letters indicate significant differences (p ≤ 0.05) between treatment, genotype, and time point.
RT-qPCR:
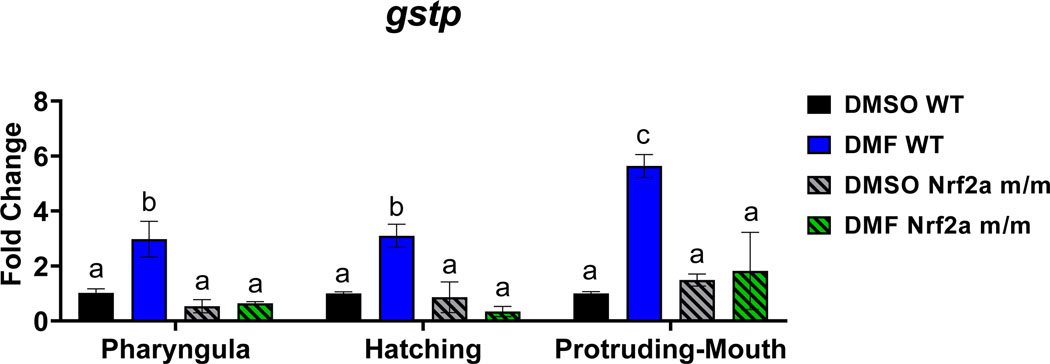
Expression of gstp was increased with DMF treatment in the Nrf2a WT embryos but not Nrf2a m/m embryos (Fig. 10). DMF treatment during all three stages, pharyngula, hatching, and protruding-mouth, increased gstp expression by 3.0-fold, 3.1-fold, and 5.6-fold in Nrf2a WT embryos, respectively. There was no difference in expression between control WT and Nrf2a m/m embryos.
Fig. 10.
Zebrafish were treated with 7 μM DMF during the pharyngula, hatching, and protruding-mouth stage for 6 hours. Embryos were pooled, and RNA was isolated, converted to cDNA, and each reaction was carried out in triplicate for each gene with primers targeted for glutathione S-transferase P (gstp) and β2-Microglobulin (b2m) Gstp gene transcription fold-change were calculated using the ΔΔCT method and b2m was used as a housekeeping gene. Values are mean fold change ± SEM. Calculations were performed using a two-way ANOVA followed by Fisher’s LSD post-hoc test. N = 2–3 pools of 15 to 20 or 20–40 fish. Different letters indicate significant differences (p ≤ 0.05) between treatment, genotype, and time point.
Discussion
Developing embryos are highly susceptible to exogenous sources of redox modulation, and perturbation of redox balance has been linked many adverse outcomes related to pancreatic β cells and liver such as dysregulated glucose levels and insulin resistance [24]–[27]. In this study, DMF-induced Nrf2 activation during three critical windows of development was evaluated. Using a mutant zebrafish line (nrf2afh318/fh318) with a point mutation in the DNA binding domain of Nrf2a [32], we have shown that both dependent and independent effects of Nrf2a activation can influence toxicity of DMF, and further refined our understanding of tissue-specific changes in Nrf2a protein levels and S-glutathionylation in pancreatic islets and liver during embryonic development.
During the survival studies of WT embryos, unsurprisingly, the longer exposures to DMF starting at the earlier pharyngula stage displayed higher mortality, with significant mortality starting at 10 μM DMF, whereas the later stages only had significant mortality starting at 15 μM DMF. Interestingly, in the Nrf2a m/m embryos, the probability of survival was higher than WT embryos, indicating that Nrf2a activation during development had a negative effect on survival. Klug et al. used an in vitro model of mouse limb bud formation to investigate developmental toxicity of DMF and its metabolites; metabolites resulting from the glutathione binding pathway demonstrated potent developmental toxicity [42]. As Nrf2 activation upregulates expression of detoxification enzymes, such as glutathione-S-transferase (GST) that conjugates xenobiotics to GSH, the difference in survival of Nrf2a mutants may be due to differences in metabolism. Further studies are needed to confirm this hypothesis.
Few morphological abnormalities were observed with DMF treatment in WT zebrafish embryos; this is in contrast to the study by Groth et al. [30] and is likely due to the difference in concentrations of DMF used. However, the Nrf2a m/m fish did display significant changes in morphology, indicating that Nrf2a plays a beneficial role in overall embryo development. DMF exposure in Nrf2a m/m embryos negatively impacted length, yolk sac area, and pericardial area in larvae at 96 hpf compared to DMF exposure in WT fish. This observation, again, may be related to the Nrf2a control over DMF metabolizing enzymes. Unlike mouse limb bud formation, other measures of DMF toxicity, such as abnormal liver function tests and chronic liver disease, have been found to be higher in human workers without a functional glutathione S-transferase θ (GSTT1) genotype [43]. These results highlight the importance of Nrf2 in modulating toxicity endpoints, and previous work highlights the role of Nrf2 in GSH regulation.
In addition to Nrf2a, other members of the Nfe2 family of transcription factors, such as Nrf1, have been shown to impact glutathione biosynthesis [44], and transcriptional regulation of Gst genes is responsive to other transcription factors such as the aryl hydrocarbon receptor [35]. Zebrafish include duplicate paralogous copies of Nrf1 and Nrf2, (Nrf2a and Nrf2b; Nrf1a and Nrf1b), which have undergone subfunctionalization. For instance, Nrf2a is a canonical activator of ARE targets and Nrf2b is a negative regulator of several crucial genes, controlling cell division and cell death [45]. Unlike Nrf2, cytoplasmic localization of Nrf1 is independent of Keap1 [46]; as the hypothesized mechanism of DMF activation of Nrf2 is the ability of DMF to interact with Cys residues on Keap1 [17], it seems unlikely that DMF will be able to interact with Nrf1 directly. Other electrophiles that are able to interact with cysteine residues on Keap1 could yield similar results and similar experiments with electrophilic compounds may be interesting for further study.
GSH, as reviewed by Hansen and Harris [18], fluctuates during development in concordance with stages of proliferation and differentiation and is evolutionarily conserved between fish and mammals. As DMF has been shown to inhibit differentiation, proliferation, and migration in endothelial cells [29], specific periods of development may be more sensitive to DMF toxicity. In the present study, DMF exposure in Nrf2a m/m embryos decreased total fish length, only during the hatching stage. In addition, DMF exposure in Nrf2a m/m embryos increased pericardial area during the hatching stage. This stage of development was also identified by Rastogi et al. [28] where chemical GSH modulation induced significant islet morphology changes. During this stage, the GSH redox potential in the zebrafish embryo is oxidizing and GSH levels are increasing, providing a possible explanation for the sensitivity to DMF at this timepoint [22],[42].
To further explore these findings, Nrf2a protein, protein S-glutathionylation, and gstp expression were evaluated. Protein S-glutathionylation occurs under conditions of oxidative stress [48], when cells transiently incorporate glutathione onto protein cysteine residues and is catalyzed by Gst enzymes. It was expected that DMF would activate Nrf2, upregulate glutathione synthesis and shift the redox potential towards more reducing conditions, which would decrease protein S-glutathionylation. Indeed, DMF in previous work has been shown protect mouse and rat neural stem cells and neurons from H2O2-induced oxidative stress and oxidative stress-induced apoptosis in an Nrf2-dependent manner, supporting the first components of our hypothesis [49]. To assess Nrf2a activation stabilization in embryos following DMF exposure via IHC, the embryos were examined immediately after exposure, while in the protein S-glutathionylation experiments, the fish were examined 24 hrs after exposure to link changes in Nrf2 activation at different developmental windows to downstream temporal alterations in glutathionylation.
At the pharyngula stage- with baseline levels of glutathione being relatively low with an oxidized redox potential- DMF exposure led to significant Nrf2a-mediated transcriptional activity, but no change in the amount of Nrf2a protein. This exposure led to a subsequent increase in total S-glutathionylation also in a Nrf2a-dependent manner. However, the presence of a fully functional Nrf2a pathway failed to protect the embryos from developing malformations when the exposure occurred at this stage. In contrast, the hatching stage- where baseline levels of glutathione are 2–3 times higher but have a similarly oxidized redox potential- is the only stage where DMF exposure lowered total Nrf2a protein (in a Nrf2a-independent manner; Fig. 3B), and there was no change in subsequent S-glutathionylation with DMF exposure (Fig. 7B), despite having a similar transcriptional response as at the pharyngula stage. However, embryos exposed to DMF at this stage with a fully functional Nrf2a pathway were significantly protected from developing malformations. Exposure to DMF at the protruding-mouth stage- with similar amounts of total glutathione but a more reduced redox potential than at the hatching stage- led to the largest increase in ARE-mediated gene expression of the three stages, despite lower levels of Nrf2a protein than the prior two stages. Further, while there was a significant basal increase in total S-glutathionylation, exposure to DMF led to a decrease in this measurement. At this stage, embryos with the wildtype Nrf2a genotype were protected from deformities. These findings collectively demonstrate the importance of the developmental baseline glutathione conditions in modifying the response to DMF and underscore the complexity of interactions between Nrf2a and glutathione in modifying embryotoxicity [23].
As protein S-glutathionylation was not modulated with DMF treatment or Nrf2a activity at the hatching stage, this may be an indicator of why more negative morphology outcomes were observed with DMF in the Nrf2a m/m embryos at this timepoint. GST catalyzes conjugation reactions with GSH, such as S-glutathionylation, and Nrf2 is one of the most important transcription factors recognized to stimulate the induction of many Gsts including gstp [50]. DMF at all three timepoints induced gstp expression in Nrf2a WT fish, but not Nrf2a m/m fish, which matches previous studies in Nrf2-Knockout mice and mouse embryonic fibroblasts, where DMF treatment upregulated Nrf2 genes, but not in Nrf2-Knockouts [51], as well as other fish studies [30],[46].
To further distinguish tissue-specific responses, we examined two redox sensitive tissues via confocal microscopy- one with high expression of Nrf2 (the liver) and one with low endogenous expression of Nrf2 (pancreatic β-cells in the islet of Langerhans). Islet volume was increased in DMF exposed Nrf2a m/m embryos treated during the hatching stage (Fig. 4A), however 24 hrs after treatment was initiated (when S-glutathionylation was measured), islet volume in Nrf2a m/m embryos, regardless of treatment, was increased (Fig. 8A). Similarly, there was no observed change in islet volume during the protruding-mouth stage (Fig. 4A), however islet volume was found to be increased in DMF exposed Nrf2a WT and control Nrf2a m/m embryos compared to control WT embryos 24 hrs after treatment was initiated (Fig. 8A) consistent with a more oxidized cellular redox environment. Similarly, there was no observed change in islet volume during the protruding-mouth stage (Fig. 4A), however islet volume was found to be increased by DMF exposure, independent of Nrf2a WT and control Nrf2a m/m embryos compared to control WT embryos 24 hrs after treatment was initiated (Fig. 8A). These results indicate that DMF treatment at an earlier stage of development may have lasting effects on islet size that persist to later points in development and warrants further investigation. Nrf2a protein in the pancreatic islet was increased with DMF exposure in Nrf2a WT fish at the pharyngula stage. At the protruding-mouth stage, Nrf2a protein in the pancreatic islet was decreased with DMF exposure in Nrf2a WT fish and in the Nrf2a m/m fish. While Nrf2a protein in the pancreatic islet decreased with DMF treatment at the protruding-mouth stage, protein S-glutathionylation, an indicator of oxidative stress, was increased with DMF exposure during the protruding-mouth stage only in Nrf2a WT fish, suggesting that the Nrf2a m/m fish may be protected from oxidative stress in the pancreatic islet.
The liver was also analyzed, but only at the later stages as it is not yet visually present at the pharyngula and hatching stages. Liver Nrf2a protein at the protruding-mouth stage, unlike the islet, was not decreased with DMF exposure and was only elevated in the control Nrf2a m/m fish. After observing this difference, colocalization of Nrf2a protein to the DAPI staining was evaluated, and there was a clear difference between Nrf2a protein nuclear colocalization in islet and liver cells (Fig. 6). Interestingly and in contrast to the pancreatic islet, there was no effect of DMF exposure on protein S-glutathionylation in the livers of Nrf2a WT fish. Unlike the islet, protein S-glutathionylation was increased in the Nrf2a m/m fish indicating more oxidative stress, and DMF exposure during the protruding-mouth stage decreased protein S-glutathionylation in Nrf2a m/m, suggesting that Nrf2a activation by DMF may be protective in the liver. DMF activation of Nrf2 has also been shown to protect livers of adult zebrafish from paracetamol injury [31], suggesting that even in embryonic liver, Nrf2, may play a critical in regulating liver injury. These results suggest that DMF may be affecting the GSH redox state differently in the islet and liver. Pancreatic islets, unlike the liver that actively detoxifies xenobiotics, do not possess extensive antioxidant defense machinery. Additionally, ROS in β-cells play an important role in cellular signaling and insulin secretion [48],[49], thus β-cells are more sensitive to redox modulation by DMF.
Conclusions
In this study, DMF treatment was found to have several adverse effects, dependent on Nrf2a activity and the exposure window during development. Total Nrf2a protein was decreased with DMF only at the hatching stage, while total protein S-glutathionylation was modulated by Nrf2a activity and DMF during the pharyngula and protruding-mouth stage. Pancreatic islets and livers also had tissue specific differences with Nrf2a protein expression and protein S-glutathionylation, due to possible tissue differences in Nrf2a activity. Although long term effects of DMF exposure, such as permanent disease phenotypical changes, were not investigated, the findings herein highlight how Nrf2 activity and critical windows of development can influence DMF toxicity.
Supplementary Material
Highlights.
DMF adverse effects on zebrafish morphology were modulated with Nrf2a activity
Changes at developmental windows with DMF correlated with Nrf2 and glutathionylation
DMF exposure decreased Nrf2 protein and increased glutathionylation in the islet
Unlike the islet, liver Nrf2 and glutathionylation results suggests Nrf2 is protective
Acknowledgements
We would like to thank members of the Timme-Laragy laboratory for providing excellent zebrafish care at UMass Amherst. We also thank Dr. James Chambers from the Light Microscopy Core at the UMass Amherst Institute for Applied Life Sciences for advice and assistance with instrumentation setup and data analysis of confocal images.
Funding:
This work was supported by the National Institutes of Health [R01ES025748].
Abbreviations:
- ARE
antioxidant response element
- BioGee
Biotinylated Glutathione Ethyl Ester
- DMF
Dimethyl fumarate
- GSH
glutathione
- GST
glutathione-S-transferase
- Gstp
glutathione S-transferase P
- hpf
hours post fertilization
- IHC
immunohistochemistry
- Keap1
Kelch-like ECH-associated protein 1
- MS
multiple sclerosis
- Nrf2(a)
nuclear factor erythroid 2-related factor 2
- ROS
reactive oxygen species
- WT
wild type
Footnotes
Publisher's Disclaimer: This is a PDF file of an unedited manuscript that has been accepted for publication. As a service to our customers we are providing this early version of the manuscript. The manuscript will undergo copyediting, typesetting, and review of the resulting proof before it is published in its final form. Please note that during the production process errors may be discovered which could affect the content, and all legal disclaimers that apply to the journal pertain.
References:
- [1].Loewe R. et al. , “Dimethylfumarate impairs melanoma growth and metastasis,” Cancer Res, vol. 66, no. 24, pp. 11888–11896, Dec. 2006, doi: 10.1158/0008-5472.CAN-06-2397. [DOI] [PubMed] [Google Scholar]
- [2].Saidu NEB et al. , “Dimethyl fumarate, a two-edged drug: Current status and future directions,” Medicinal Research Reviews, vol. 39, no. 5, pp. 1923–1952, 2019, doi: 10.1002/med.21567. [DOI] [PubMed] [Google Scholar]
- [3].Saidu NEB et al. , “Dimethyl Fumarate Controls the NRF2/DJ-1 Axis in Cancer Cells: Therapeutic Applications,” Mol Cancer Ther, vol. 16, no. 3, pp. 529–539, Mar. 2017, doi: 10.1158/1535-7163.MCT-16-0405. [DOI] [PubMed] [Google Scholar]
- [4].Yamazoe Y. et al. , “Dimethylfumarate inhibits tumor cell invasion and metastasis by suppressing the expression and activities of matrix metalloproteinases in melanoma cells,” Cell Biol Int, vol. 33, no. 10, pp. 1087–1094, Oct. 2009, doi: 10.1016/j.cellbi.2009.06.027. [DOI] [PubMed] [Google Scholar]
- [5].Carlström KE et al. , “Therapeutic efficacy of dimethyl fumarate in relapsing-remitting multiple sclerosis associates with ROS pathway in monocytes,” Nat Commun, vol. 10, no. 1, Art. no. 1, Jul. 2019, doi: 10.1038/s41467-019-11139-3. [DOI] [PMC free article] [PubMed] [Google Scholar]
- [6].Schulze-Topphoff U et al., “Dimethyl fumarate treatment induces adaptive and innate immune modulation independent of Nrf2,” Proceedings of the National Academy of Sciences, vol. 113, no. 17, pp. 4777–4782, Apr. 2016, doi: 10.1073/pnas.1603907113. [DOI] [PMC free article] [PubMed] [Google Scholar]
- [7].Brandes MS and Gray NE, “NRF2 as a Therapeutic Target in Neurodegenerative Diseases,” ASN Neuro, vol. 12, p. 1759091419899782, Jan. 2020, doi: 10.1177/1759091419899782. [DOI] [PMC free article] [PubMed] [Google Scholar]
- [8].Nguyen T, Nioi P, and Pickett CB, “The Nrf2-Antioxidant Response Element Signaling Pathway and Its Activation by Oxidative Stress *,” Journal of Biological Chemistry, vol. 284, no. 20, pp. 13291–13295, May 2009, doi: 10.1074/jbc.R900010200. [DOI] [PMC free article] [PubMed] [Google Scholar]
- [9].Jiang T, Harder B, Rojo M. de la Vega PK Chapman Wong, E., and Zhang DD, “p62 links autophagy and Nrf2 signaling,” Free Radical Biology and Medicine, vol. 88, pp. 199–204, Nov. 2015, doi: 10.1016/j.freeradbiomed.2015.06.014. [DOI] [PMC free article] [PubMed] [Google Scholar]
- [10].Kobayashi A. et al. , “Oxidative stress sensor Keap1 functions as an adaptor for Cul3-based E3 ligase to regulate proteasomal degradation of Nrf2,” Mol Cell Biol, vol. 24, no. 16, pp. 7130–7139, Aug. 2004, doi: 10.1128/MCB.24.16.7130-7139.2004. [DOI] [PMC free article] [PubMed] [Google Scholar]
- [11].Hoffmann C, Dietrich M, Herrmann A-K, Schacht T, Albrecht P, and Methner A, “Dimethyl Fumarate Induces Glutathione Recycling by Upregulation of Glutathione Reductase,” Oxid Med Cell Longev, vol. 2017, p. 6093903, 2017, doi: 10.1155/2017/6093903. [DOI] [PMC free article] [PubMed] [Google Scholar]
- [12].Robledinos-Antón N, Fernández-Ginés R, Manda G, and Cuadrado A, “Activators and Inhibitors of NRF2: A Review of Their Potential for Clinical Development,” Oxid Med Cell Longev, vol. 2019, p. 9372182, Jul. 2019, doi: 10.1155/2019/9372182. [DOI] [PMC free article] [PubMed] [Google Scholar]
- [13].Gopal S, Mikulskis A, Gold R, Fox RJ, Dawson KT, and Amaravadi L, “Evidence of activation of the Nrf2 pathway in multiple sclerosis patients treated with delayed-release dimethyl fumarate in the Phase 3 DEFINE and CONFIRM studies,” Mult Scler, vol. 23, no. 14, pp. 1875–1883, Dec. 2017, doi: 10.1177/1352458517690617. [DOI] [PubMed] [Google Scholar]
- [14].Morales Pantoja IE, Hu C-L, Perrone-Bizzozero NI, Zheng J, and Bizzozero OA, “Nrf2-dysregulation correlates with reduced synthesis and low glutathione levels in experimental autoimmune encephalomyelitis,” J Neurochem, vol. 139, no. 4, pp. 640–650, Nov. 2016, doi: 10.1111/jnc.13837. [DOI] [PMC free article] [PubMed] [Google Scholar]
- [15].Ohl K, Tenbrock K, and Kipp M, “Oxidative stress in multiple sclerosis: Central and peripheral mode of action,” Exp Neurol, vol. 277, pp. 58–67, Mar. 2016, doi: 10.1016/j.expneurol.2015.11.010. [DOI] [PMC free article] [PubMed] [Google Scholar]
- [16].Brennan MS et al. , “Dimethyl Fumarate and Monoethyl Fumarate Exhibit Differential Effects on KEAP1, NRF2 Activation, and Glutathione Depletion In Vitro,” PLOS ONE, vol. 10, no. 3, p. e0120254, Mar. 2015, doi: 10.1371/journal.pone.0120254. [DOI] [PMC free article] [PubMed] [Google Scholar]
- [17].Blewett MM et al. , “Chemical proteomic map of dimethyl fumarate–sensitive cysteines in primary human T cells,” Science Signaling, vol. 9, no. 445, pp. rs10–rs10, Sep. 2016, doi: 10.1126/scisignal.aaf7694. [DOI] [PMC free article] [PubMed] [Google Scholar]
- [18].Hansen JM and Harris C, “Glutathione during embryonic development,” Biochimica et Biophysica Acta (BBA) - General Subjects, vol. 1850, no. 8, pp. 1527–1542, Aug. 2015, doi: 10.1016/j.bbagen.2014.12.001. [DOI] [PubMed] [Google Scholar]
- [19].FDA, “Tecfidera (dimethyl fumarate) prescribing information.” 2013. Accessed: Apr. 08, 2022. [Online]. Available: http://www.accessdata.fda.gov/drugsatfda_docs/label/2013/204063lbl.pdf
- [20].Hellwig J, Merkle J, Klimisch HJ, and Jäckh R, “Studies on the prenatal toxicity of N,N-dimethylformamide in mice, rats and rabbits,” Food and Chemical Toxicology, vol. 29, no. 3, pp. 193–201, Jan. 1991, doi: 10.1016/0278-6915(91)90037-8. [DOI] [PubMed] [Google Scholar]
- [21].Wallin MT et al. , “The prevalence of MS in the United States: A population-based estimate using health claims data,” Neurology, vol. 92, no. 10, pp. e1029–e1040, Mar. 2019, doi: 10.1212/WNL.0000000000007035. [DOI] [PMC free article] [PubMed] [Google Scholar]
- [22].Walton C. et al. , “Rising prevalence of multiple sclerosis worldwide: Insights from the Atlas of MS, third edition,” Mult Scler, vol. 26, no. 14, pp. 1816–1821, Dec. 2020, doi: 10.1177/1352458520970841. [DOI] [PMC free article] [PubMed] [Google Scholar]
- [23].Timme-Laragy AR, Goldstone JV, Imhoff BR, Stegeman JJ, Hahn ME, and Hansen JM, “Glutathione redox dynamics and expression of glutathione-related genes in the developing embryo,” Free Radic Biol Med, vol. 65, pp. 89–101, Dec. 2013, doi: 10.1016/j.freeradbiomed.2013.06.011. [DOI] [PMC free article] [PubMed] [Google Scholar]
- [24].Gentric G. et al. , “Oxidative stress promotes pathologic polyploidization in nonalcoholic fatty liver disease,” J Clin Invest, vol. 125, no. 3, pp. 981–992, Mar. 2015, doi: 10.1172/JCI73957. [DOI] [PMC free article] [PubMed] [Google Scholar]
- [25].Pi J. and Collins S, “Reactive oxygen species and uncoupling protein 2 in pancreatic β-cell function,” Diabetes, Obesity and Metabolism, vol. 12, no. s2, pp. 141–148, 2010, doi: 10.1111/j.1463-1326.2010.01269.x. [DOI] [PubMed] [Google Scholar]
- [26].Wells PG et al. , “Molecular and biochemical mechanisms in teratogenesis involving reactive oxygen species,” Toxicology and Applied Pharmacology, vol. 207, no. 2, Supplement, pp. 354–366, Sep. 2005, doi: 10.1016/j.taap.2005.01.061. [DOI] [PubMed] [Google Scholar]
- [27].Wu KC, Cui JY, Liu J, Lu H, Zhong X, and Klaassen CD, “RNA-Seq provides new insights on the relative mRNA abundance of antioxidant components during mouse liver development,” Free Radical Biology and Medicine, vol. 134, pp. 335–342, Apr. 2019, doi: 10.1016/j.freeradbiomed.2019.01.017. [DOI] [PMC free article] [PubMed] [Google Scholar]
- [28].Rastogi A, Severance EG, Jacobs HM, Conlin SM, Islam ST, and Timme-Laragy AR, “Modulating glutathione thiol status alters pancreatic β-cell morphogenesis in the developing zebrafish (Danio rerio) embryo,” Redox Biol, vol. 38, p. 101788, Jan. 2021, doi: 10.1016/j.redox.2020.101788. [DOI] [PMC free article] [PubMed] [Google Scholar]
- [29].García-Caballero M, Marí-Beffa M, Medina MÁ, and Quesada AR, “Dimethylfumarate Inhibits Angiogenesis In Vitro and In Vivo: A Possible Role for Its Antipsoriatic Effect?,” Journal of Investigative Dermatology, vol. 131, no. 6, pp. 1347–1355, Jun. 2011, doi: 10.1038/jid.2010.416. [DOI] [PubMed] [Google Scholar]
- [30].Groth G, Kronauer K, and Freundt KJ, “Effects of N,N-dimethylformamide and its degradation products in zebrafish embryos,” Toxicol In Vitro, vol. 8, no. 3, pp. 401–406, Jun. 1994, doi: 10.1016/0887-2333(94)90161-9. [DOI] [PubMed] [Google Scholar]
- [31].Meseguer-Ripolles J. et al. , “Dimethyl fumarate reduces hepatocyte senescence following paracetamol exposure,” iScience, vol. 24, no. 6, p. 102552, Jun. 2021, doi: 10.1016/j.isci.2021.102552. [DOI] [PMC free article] [PubMed] [Google Scholar]
- [32].Mukaigasa K, Nguyen LTP, Li L, Nakajima H, Yamamoto M, and Kobayashi M, “Genetic evidence of an evolutionarily conserved role for Nrf2 in the protection against oxidative stress,” Mol Cell Biol, vol. 32, no. 21, pp. 4455–4461, Nov. 2012, doi: 10.1128/MCB.00481-12. [DOI] [PMC free article] [PubMed] [Google Scholar]
- [33].diIorio PJ, Moss JB, Sbrogna JL, Karlstrom RO, and Moss LG, “Sonic hedgehog Is Required Early in Pancreatic Islet Development,” Developmental Biology, vol. 244, no. 1, pp. 75–84, Apr. 2002, doi: 10.1006/dbio.2002.0573. [DOI] [PubMed] [Google Scholar]
- [34].Kimmel CB, Ballard WW, Kimmel SR, Ullmann B, and Schilling TF, “Stages of embryonic development of the zebrafish,” Developmental Dynamics, vol. 203, no. 3, pp. 253–310, 1995, doi: 10.1002/aja.1002030302. [DOI] [PubMed] [Google Scholar]
- [35].Hahn ME et al. , “The Transcriptional Response to Oxidative Stress during Vertebrate Development: Effects of tert-Butylhydroquinone and 2,3,7,8-Tetrachlorodibenzo-p-Dioxin,” PLOS ONE, vol. 9, no. 11, p. e113158, Nov. 2014, doi: 10.1371/journal.pone.0113158. [DOI] [PMC free article] [PubMed] [Google Scholar]
- [36].Kobayashi M. et al. , “Identification of the interactive interface and phylogenic conservation of the Nrf2-Keap1 system,” Genes to Cells, vol. 7, no. 8, pp. 807–820, 2002, doi: 10.1046/j.1365-2443.2002.00561.x. [DOI] [PubMed] [Google Scholar]
- [37].Hill BG and Bhatnagar A, “Protein S-glutathiolation: Redox-sensitive regulation of protein function,” J Mol Cell Cardiol, vol. 52, no. 3, pp. 559–567, Mar. 2012, doi: 10.1016/j.yjmcc.2011.07.009. [DOI] [PMC free article] [PubMed] [Google Scholar]
- [38].Rousseau ME, Sant KE, Borden LR, Franks DG, Hahn ME, and Timme-Laragy AR, “Regulation of Ahr signaling by Nrf2 during development: Effects of Nrf2a deficiency on PCB126 embryotoxicity in zebrafish (Danio rerio),” Aquat Toxicol, vol. 167, pp. 157–171, Oct. 2015, doi: 10.1016/j.aquatox.2015.08.002. [DOI] [PMC free article] [PubMed] [Google Scholar]
- [39].Livak KJ and Schmittgen TD, “Analysis of relative gene expression data using real-time quantitative PCR and the 2(-Delta Delta C(T)) Method,” Methods, vol. 25, no. 4, pp. 402–408, Dec. 2001, doi: 10.1006/meth.2001.1262. [DOI] [PubMed] [Google Scholar]
- [40].Schindelin J. et al. , “Fiji: an open-source platform for biological-image analysis,” Nat Methods, vol. 9, no. 7, Art. no. 7, Jul. 2012, doi: 10.1038/nmeth.2019. [DOI] [PMC free article] [PubMed] [Google Scholar]
- [41].Costes SV, Daelemans D, Cho EH, Dobbin Z, Pavlakis G, and Lockett S, “Automatic and Quantitative Measurement of Protein-Protein Colocalization in Live Cells,” Biophysical Journal, vol. 86, no. 6, pp. 3993–4003, Jun. 2004, doi: 10.1529/biophysj.103.038422. [DOI] [PMC free article] [PubMed] [Google Scholar]
- [42].Klug S, Merker HJ, and Jäckh R, “Potency of monomethyl-, dimethylformamide and some of their metabolites to induce abnormal development in a limb Bud organ culture,” Toxicol In Vitro, vol. 12, no. 2, pp. 123–132, Apr. 1998, doi: 10.1016/s0887-2333(97)00094-5. [DOI] [PubMed] [Google Scholar]
- [43].Luo J-C, Cheng T-J, Kuo H-W, and Chang MJW, “Abnormal liver function associated with occupational exposure to dimethylformamide and glutathione S-transferase polymorphisms,” Biomarkers, vol. 10, no. 6, pp. 464–474, Dec. 2005, doi: 10.1080/13547500500333648. [DOI] [PubMed] [Google Scholar]
- [44].Sant KE et al. , “The role of Nrf1 and Nrf2 in the regulation of glutathione and redox dynamics in the developing zebrafish embryo,” Redox Biology, vol. 13, pp. 207–218, Oct. 2017, doi: 10.1016/j.redox.2017.05.023. [DOI] [PMC free article] [PubMed] [Google Scholar]
- [45].Timme-Laragy AR et al. , “Nrf2b, Novel Zebrafish Paralog of Oxidant-responsive Transcription Factor NF-E2-related Factor 2 (NRF2),” J. Biol. Chem, vol. 287, no. 7, pp. 4609–4627, Feb. 2012, doi: 10.1074/jbc.M111.260125. [DOI] [PMC free article] [PubMed] [Google Scholar]
- [46].Wang W. and Chan JY, “Nrf1 is targeted to the endoplasmic reticulum membrane by an N-terminal transmembrane domain. Inhibition of nuclear translocation and transacting function,” J Biol Chem, vol. 281, no. 28, pp. 19676–19687, Jul. 2006, doi: 10.1074/jbc.M602802200. [DOI] [PubMed] [Google Scholar]
- [47].Rastogi A, Clark CW, Conlin SM, Brown SE, and Timme-Laragy AR, “Mapping glutathione utilization in the developing zebrafish (Danio rerio) embryo,” Redox Biol, vol. 26, Jun. 2019, doi: 10.1016/j.redox.2019.101235. [DOI] [PMC free article] [PubMed] [Google Scholar]
- [48].Dalle-Donne I, Rossi R, Colombo G, Giustarini D, and Milzani A, “Protein S-glutathionylation: a regulatory device from bacteria to humans,” Trends Biochem Sci, vol. 34, no. 2, pp. 85–96, Feb. 2009, doi: 10.1016/j.tibs.2008.11.002. [DOI] [PubMed] [Google Scholar]
- [49].Wang Q. et al. , “Dimethyl Fumarate Protects Neural Stem/Progenitor Cells and Neurons from Oxidative Damage through Nrf2-ERK1/2 MAPK Pathway,” Int J Mol Sci, vol. 16, no. 6, pp. 13885–13907, Jun. 2015, doi: 10.3390/ijms160613885. [DOI] [PMC free article] [PubMed] [Google Scholar]
- [50].Bartolini D. and Galli F, “The functional interactome of GSTP: A regulatory biomolecular network at the interface with the Nrf2 adaption response to oxidative stress,” J Chromatogr B Analyt Technol Biomed Life Sci, vol. 1019, pp. 29–44, Apr. 2016, doi: 10.1016/j.jchromb.2016.02.002. [DOI] [PubMed] [Google Scholar]
- [51].Ahuja M. et al. , “Distinct Nrf2 Signaling Mechanisms of Fumaric Acid Esters and Their Role in Neuroprotection against 1-Methyl-4-Phenyl-1,2,3,6-Tetrahydropyridine-Induced Experimental Parkinson’s-Like Disease,” J. Neurosci, vol. 36, no. 23, pp. 6332–6351, Jun. 2016, doi: 10.1523/JNEUROSCI.0426-16.2016. [DOI] [PMC free article] [PubMed] [Google Scholar]
- [52].Nakayama T. et al. , “Seasonal changes in NRF2 antioxidant pathway regulates winter depression-like behavior,” Proceedings of the National Academy of Sciences, vol. 117, no. 17, pp. 9594–9603, Apr. 2020, doi: 10.1073/pnas.2000278117. [DOI] [PMC free article] [PubMed] [Google Scholar]
- [53].Benáková Š, Holendová B, and Plecitá-Hlavatá L, “Redox Homeostasis in Pancreatic β-Cells: From Development to Failure,” Antioxidants (Basel), vol. 10, no. 4, p. 526, Mar. 2021, doi: 10.3390/antiox10040526. [DOI] [PMC free article] [PubMed] [Google Scholar]
- [54].Graciano MFR, Valle MMR, Kowluru A, Curi R, and Carpinelli AR, “Regulation of insulin secretion and reactive oxygen species production by free fatty acids in pancreatic islets,” Islets, vol. 3, no. 5, pp. 213–223, Oct. 2011, doi: 10.4161/isl.3.5.15935. [DOI] [PubMed] [Google Scholar]
Associated Data
This section collects any data citations, data availability statements, or supplementary materials included in this article.


