Abstract
The purposes are to explore the effect of Digital Twins (DTs) in Unmanned Aerial Vehicles (UAVs) on providing medical resources quickly and accurately during COVID-19 prevention and control. The feasibility of UAV DTs during COVID-19 prevention and control is analyzed. Deep Learning (DL) algorithms are introduced. A UAV DTs information forecasting model is constructed based on improved AlexNet, whose performance is analyzed through simulation experiments. As end-users and task proportion increase, the proposed model can provide smaller transmission delays, lesser energy consumption in throughput demand, shorter task completion time, and higher resource utilization rate under reduced transmission power than other state-of-art models. Regarding forecasting accuracy, the proposed model can provide smaller errors and better accuracy in Signal-to-Noise Ratio (SNR), bit quantizer, number of pilots, pilot pollution coefficient, and number of different antennas. Specifically, its forecasting accuracy reaches 95.58% and forecasting velocity stabilizes at about 35 Frames-Per-Second (FPS). Hence, the proposed model has stronger robustness, making more accurate forecasts while minimizing the data transmission errors. The research results can reference the precise input of medical resources for COVID-19 prevention and control.
Keywords: Unmanned aerial vehicles, digital twins, epidemic, deep learning, medical resource, COVID-19 prevention and control
I. Introduction
As cases of Coronavirus Disease 2019 (COVID-19) keep growing, social-distancing, including wearing a mask, becomes the everyday practice. COVID-19 is still not optimistic up to today. Unmanned Aerial Vehicles (UAVs) have become broadly applied in real-life settings to suppress COVID-19 from spreading, including safety inspections, material delivery, disinfection, thermal sensing, temperature measurement, and prevention and control propaganda, a powerful means of COVID-19 prevention and control [1], [2]. Using UAVs for “non-contacting” COVID-19 prevention and control can improve work efficiency while reducing the infection risks, creating a stereo disease prevention and control model [3]. While their performances are improved through advanced technologies such as big data and Artificial Intelligence (AI), applying UAVs to COVID-19 prevention and control has attracted researchers and scholars worldwide.
Against COVID-19, the efficiency of prevention and control directly affects the effectiveness of governance. Based on informatization and intelligence, updating ground grid management systems into “big data + grid” air-space patrol systems can strictly prevent and control severely affected areas and vital nodes, thereby improving the efficiency of group defense, group control, and group governance while saving human resource costs [4]. Such systems can make full use of the fast maneuvering features of UAVs. The suddenness, unpredictability, and uncertainty of epidemics require quick responses and control of UAVs, thereby ensuring smooth prevention and control works. Hence, UAVs can quickly perform tasks, saving time and improving the efficiency of prevention and control. Moreover, data transmission requires high confidentiality against COVID-19 prevention and control. COVID-19 prevention and control involve diverse information, such as the disinfection of key locations, the materials and equipment in medical spots, and the transportation information. During epidemics, accurate and safe data transmission helps decision-makers make timely and accurate commands and supports scientific plans and policies [5], [6].
While preventing and controlling epidemics such as COVID-19, UAVs can substitute vehicles to monitor the flows of vehicles and pedestrians from high altitudes and transmit surveillance footages to the headquarters of the Public Security Bureau in real-time, thereby help the works of monitoring and supervision [7]. However, the high costs of manually screening massive data features such as images and videos returned by UAVs cause frequent errors and omissions. In this regard, Computer Vision (CV) can be introduced as an auxiliary monitoring tool. CV mimics the observing behaviors of human beings using computers and associated devices, enabling computers to observe and understand the world via vision. Deep Learning (DL) is an AI algorithm; the Convolutional Neural Network (CNN), one of DL networks, can provide excellent performance in image feature extraction [8]. Therefore, AI approaches, such as CNN, can remove the fundamental technical limitations for UAVs in perception problems and applications. In addition, due to the complexity of UAV flight path in reality, the existing UAV field situation is mapped to the virtual space for analysis, namely digital twins (DTs) technology. The innovation and development of DTs technology in intelligent manufacturing and other fields has brought new guiding ideas to solve the intelligent problem of UAV system driven by DTs, which is of great significance to the intelligent development of UAV system [9].
In summary, during epidemic outbreaks, reliable prevention and control measures and accurate supplies of medical resources are of vital practical values. The innovative points are: (1) analyzing the feasibility of UAV DTs for COVID-19 prevention and control while using UAVs; (2) introducing AI algorithms such as DL to build a UAV DTs information forecasting model based on improved AlexNet. The research results can provide experimental evidence for the precise input of medical resources during COVID-19 prevention and control.
II. Related Works
A. Research Progress of UAVs Data Collection
As a new aerial working platform, UAVs have been universally applied in aerial photography, patrol inspection, and precision agriculture. As the Fifth Generation (5G) communication technology gets popularized, UAVs begin to present strong data collection advantages, attracting researchers worldwide. Fawaz et al. improved the performance of relay-assisted File System Object (FSO) by integrating UAVs as buffer auxiliary mobile relays into the traditional relay-assisted FSO [10]. Ye et al. researched the confidentiality performance of a UAV on the UAV systems. One UAV acted as the source (S) that transmitted information to a legitimate UAV receiver, while a group of UAVs attempted to eavesdrop on information transmitted between S and the legitimate UAV receivers. Finally, the proposed model was verified by Monte Carlo simulation [11]. Zhang et al. investigated how to achieve millimeter-wave channel capture and precoder design for UAVs. They also discussed the challenges and possible solutions of UAV millimeter-wave cellular networks, including communication and spectrum sharing of UAVs to base stations and users [12]. To improve the coverage and performance of UAV communication systems, Yang et al. proposed a reconfigurable UAV scheme based on Reconfigurable Intelligent Surface (RIS). This scheme employed RIS installed on the architecture to reflect signals from the ground sources to UAVs. Meanwhile, UAVs were deployed as relays to forward the decoded signals to the destinations. Results demonstrated that RIS could improve the coverage and reliability of UAV communication systems [13].
B. Influences of UAVs Data Collection on COVID-19 Prevention and Control
Medical resources have become increasingly scarce since the outbreak of COVID-19, forcing most countries to partially or completely lockdown. Moreover, countless false reports, rumors, and unsolicited fears about the coronavirus are spreading. In this regard, scholars worldwide have researched the impact of data collection during COVID-19 prevention and control. Against the current COVID-19 situation, Chamola et al. applied the Internet of Things (IoT), UAVs, blockchain, AI, and 5G to prevent and control COVID-19, in an effort to mitigate the impacts of COVID-19 [14]. Li et al. designed a Flight Resource Allocation Scheme based on Deep Deterministic Policy Gradients, denoted as DDPG-FRAS. This scheme could optimize UAV flight control and data collection and scheduling jointly in real-time during COVID-19, thereby minimizing the packet loss of the ground sensor networks asymptotically [15]. Regarding the increasing number of newly diagnosed and suspected COVID-19 cases worldwide, Kumar et al. explored the possibilities and opportunities of UAVs to fight against the disease. They put forward some suggestions that could help healthcare sectors to suppress the virus from spreading [16].
To sum up, data collection is extremely critical during epidemic outbreaks. Despite that UAVs have been applied to COVID-19 prevention and control, the collected data are not analyzed particularly. Therefore, using DL approaches to extract features from disease-associated data collected by UAVs is vital for COVID-19 prevention and control, as well as the accurate supplies of medical resources.
III. Information Forecasting Analysis of UAV DTS for COVID-19 Prevention and Control
A. Feasibility Analysis of UAV DTs for COVID-19 Prevention and Control
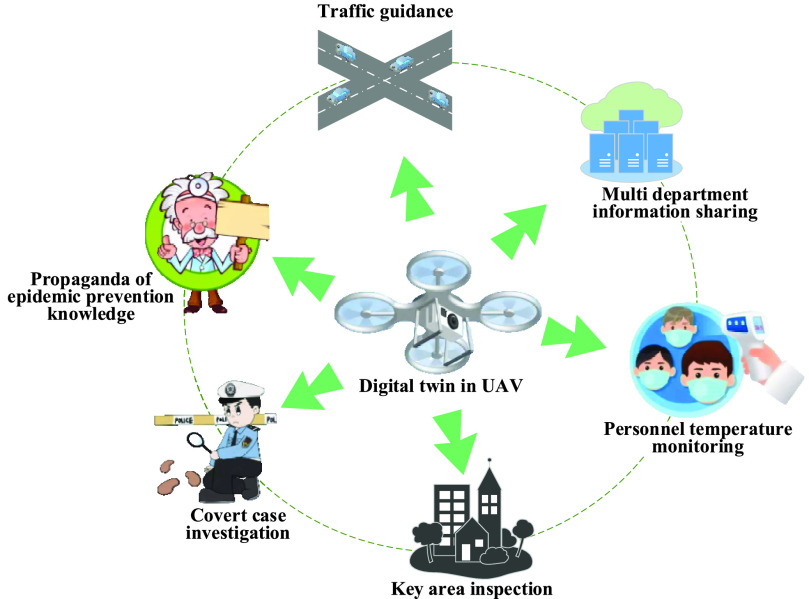
Sufficient information sources are important foundations for post-epidemic works. Comprehensive information about public health can create favorable conditions for decision-making. Only technical support can increase urban governors’ abilities to resist risks. As a product of science and technology development, UAVs have the features of flexibility, comprehensive vision, and easy operation. UAVs can collect information and complete various tasks, such as key area inspections, temperature measurement, and aerial panoramic reconnaissance [17], [18]. Therefore, linking space-time information via UAVs to acquire panoramic dynamic data of the cities helps build a smart city and assists COVID-19 prevention and control. The demand analysis of UAV DTs in COVID-19 prevention and control is presented in Figure 1.
Fig. 1.
Demand analysis of COVID-19 prevention and control by UAV DTs.
Figure 1 presents that UAVs have been gradually applied in many fields, such as traffic guidance, big data information sharing, personal temperature measurement, key area inspection, secret case investigation, and epidemic prevention knowledge publicity. Data collection during COVID-19 prevention and control pose following demands. Regarding key area inspections, the features of UAVs can solve insufficient resources, limited monitoring ranges, and blind inspection spots. In particular, for high-risk areas such as medical spots, quarantine spaces, and resettlement areas, UAVs can assist in 24-hour dynamic control of key personnel and places in the jurisdiction [19].
Regarding temperature measurement, for cities with large-scale population migrations every day, traditional temperature measurement tools have problems such as low efficiency, low safety, and poor reliability. In comparison, UAVs equipped with infrared thermometers and face recognizers can achieve functions such as simultaneously scanning multiple persons and recording body temperatures in real-time.
Regarding hidden crime investigations, the community is closed for management during the epidemic; however, hidden crimes, such as gambling and drug abuse, may occur in closed places, bringing a bad impact on social security. UAVs can detect these places panoramically and identify personnel and surrounding environment quickly, playing a vital role in multiple stages such as forensics and reconnaissance [20].
Regarding information propagation, UAVs can propagate epidemic prevention knowledge, dredge traffic jams, and share information between multiple departments. While propagating epidemic prevention knowledge, modern and traditional means, online and offline propaganda, and air and ground tools are jointly utilized to launch propaganda from multiple channels and aspects. In this way, people can learn the latest epidemic situation, thereby eliminating social panic [21].
Regarding traffic jam dredging, the successful combination of UAVs, high-definition cameras, and 5G technology can easily obtain high-definition and high-current aerial images, thereby strengthening video surveillance management and improving urban traffic management during major epidemics.
Regarding information sharing, the key protection areas, as well as the location information and health status of key personnel, can be classified using different colors and codes and superimposed on the electronic maps, thereby serving the linkage system of COVID-19 prevention and control [22].
During the outbreak, the prevention and control of a major epidemic are characterized by complexity and uncertainty. A series of complicated factors such as the difficulty of sequencing the virus’s gene and analyzing the transmission path pose a serious challenge to people’s life safety and health. The chaos and delays in the fight against epidemics reflect the fragmentation and incoordination of data collection, sharing, and processing. Therefore, it is of great significance to apply UAV DTs to acquire and share medical information resources during epidemic prevention and control.
B. UAVs Data Processing and Transmission Analysis
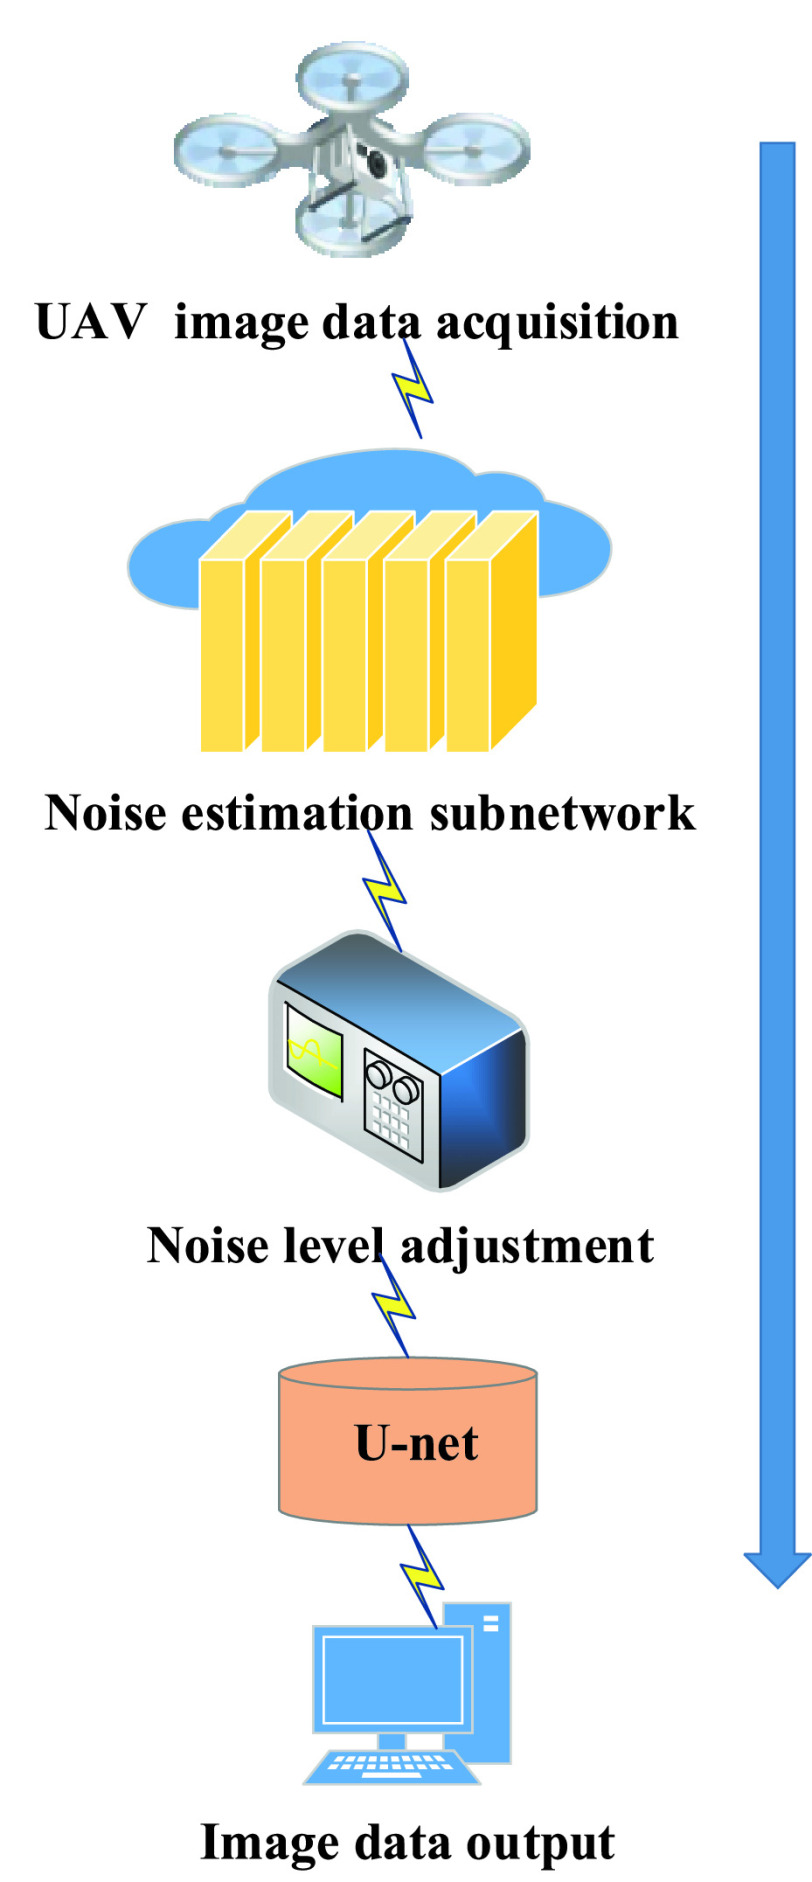
During COVID-19 prevention and control, while detecting targets and collecting data, images taken by UAV sensors are often degraded due to imaging technique, shooting environment, relative movement between objects, and camera shaking. Noises and blurs are the most typical image degradation phenomena, requiring image preprocessing before they can be utilized [23]. Therefore, it is critical to preprocess the image data obtained by UAVs, and Figure 2 presents the detailed process.
Fig. 2.
Flowchart of UAVs image data preprocessing.
Figure 2 shows the pre-processing process of the collected image data information, which mainly includes using the sub-network to estimate the noise, adjusting the noise level of the image, using U-Net to remove the noise, and finally outputting the image data. The image data collected by UAVs can be transmitted after preprocessing. The channel matrix from the paired user
 to the
 -th base station cluster is defined as
 , where
 indicates the fast fading channel from the paired user to the
 -th base station, and
 refers to the diagonal array. Thus, the equivalent Multiple Input Multiple Output (MIMO) channel of the multi-point coordinated system based on base station cooperation can be obtained as:
 |
The data flow sent is
 , where
 refers to the
 -th data flow sent by the
 -th user, calculated as:
 |
The received signal at the cluster end of the cooperative base station can be expressed as:
 |
In (3),
 refers to the interference from the
 -th interfering base station cluster. The cooperative base station cluster is detected using Mini-Mental State Examination (MMSE) to eliminate the interference between users. The MMSE equalization matrix is:
 |
Data flow after detection can be expressed as:
 |
Suppose that A = GH, and
 . In that case, the Signal-to-Interference plus Noise Ratio (SINR) of the
 -th data flow is:
 |
Furthermore, factors such as UAV fast and slow decays in image data transmission are considered. The combined channel for multi-user transmission with
 user-pairs can be expressed as:
 |
At
 , channel matrices of the first k-1 users are paired, and the matrix dimension is
 . Suppose the transmitting end evenly distributes its power to each transmit antenna and the channel gains. In that case, the channel capacity can be expressed as:
 |
In (8),
 refers to interference intensity. If
 , the channel capacity in the above equation can be approximated as:
 |
Hence, if
 takes its maximal value, channel capacity will also reach the maximum. The determinant
 can be defined:
 |
In (10),
 is the channel matrix on the
 -th subcarrier, and
 refers to the conjugate transposition of
 . According to the maximum capacity principle, the selected
 -th paired user should be:
 |
In (11),
 refers to the number of subcarriers occupied by the user group.
C. DL-Based UAV DTs Information Forecasting Model Under COVID-19 Prevention and Control
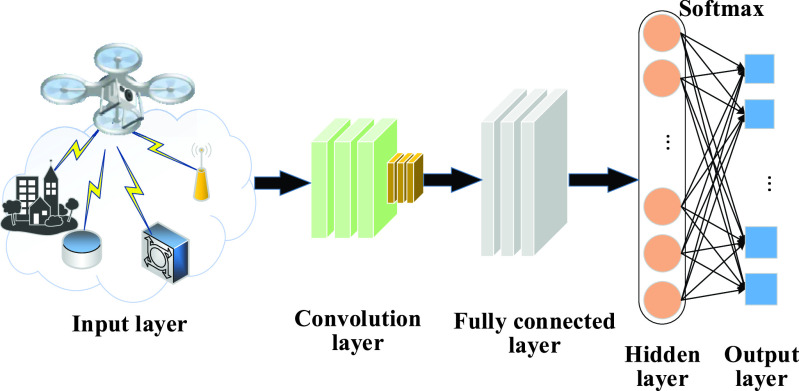
UAVs transmit image data via wireless channels; afterward, these data can be analyzed and forecasted to accurately supply medical resources for COVID-19 prevention and control. AlexNet [24], a deep CNN model, is selected considering its multiple network layers and stronger learning ability to extract features from the image data transmitted by UAVs. Furthermore, the functional layer of AlexNet’s convolutional layer is improved. The operation of “local normalization before pooling” is advanced to “pooling before local normalization” to reduce the calculation amount and enhance CNN’s generalization performance. Therefore, a UAV DTs information forecasting model is designed based on the improved AlexNet, which balances the model’s forecasting effect and the system’s real-time performance, as illustrated in Figure 3.
Fig. 3.
UAV DTs information forecasting model based on improved AlexNet.
In this information forecasting model, the
 -th feature map
 of the
 -th convolutional layer is sampled using overlapping pooling:
 |
In (12),
 is the pooling movement step size,
 refers to the width of the pooling area, and
 .
.
A local normalization layer is added after the first and second pooling layers of AlexNet to standardize feature map
 :
:
 |
In (13),
 are all hyperparameters valuing 2, 0.78, 10−4, and 7, respectively, and
 is the total number of convolution kernels in the
 -th convolutional layer. To prevent “gradient dispersion” [25], the activation function takes Rectified Linear Unit (ReLU) to activate the convolution output
 :
:
 |
In (14),
 represents ReLU. To prevent over-fitting in the fully connected layer, the dropout parameter is set to 0.5 [26]. All the feature maps when
 values 5 in equation (12) are reconstructed into a high-dimensional single-layered neuron structure
 ; thus, the input
 of the
 -th neuron in the sixth fully connected layer is:
 |
In (15),
 and
and
 are the weight and bias of the
 -th neuron in the sixth fully connected layer, respectively.
While improving the generalization ability, the neurons
 of the sixth and seventh fully connected layers are discarded and output,
 ; in this regard, the
 -th neuron’s input in the seventh and eighth fully connected layers
 is
is
 , where the
 -th neuron’s input in the sixth and seventh fully connected layers
 is
is
 , namely
 . Finally, the input
 of the
 -th neuron in the eighth fully connected layer can be obtained:
 |
The cross-entropy loss function suitable for classification is taken as the model’s error function, and the equation is:
 |
In (17) and (18),
 denotes the number of categories,
 describes the true category distribution of the sample,
 describes the network output, and
 represents the classification result after SoftMax classifier. SoftMax’s input is a
 -dimensional real number vector, denoted as
 . Its equation is:
 |
Essentially, SoftMax can map an
 -dimensional arbitrary real number vector to an
 -dimensional vector whose values all fall in the range of (0,1), thereby normalizing the vector. To reduce the computational complexity, the output data volume is reduced to 28 through
 companding conversion, that is,
 , thereby improving the model’s forecasting efficiency.
 |
The model is trained through learning rate updating using the polynomial decay approach (Poly) [27]. The equation is:
 |
In (21), the initial learning rate
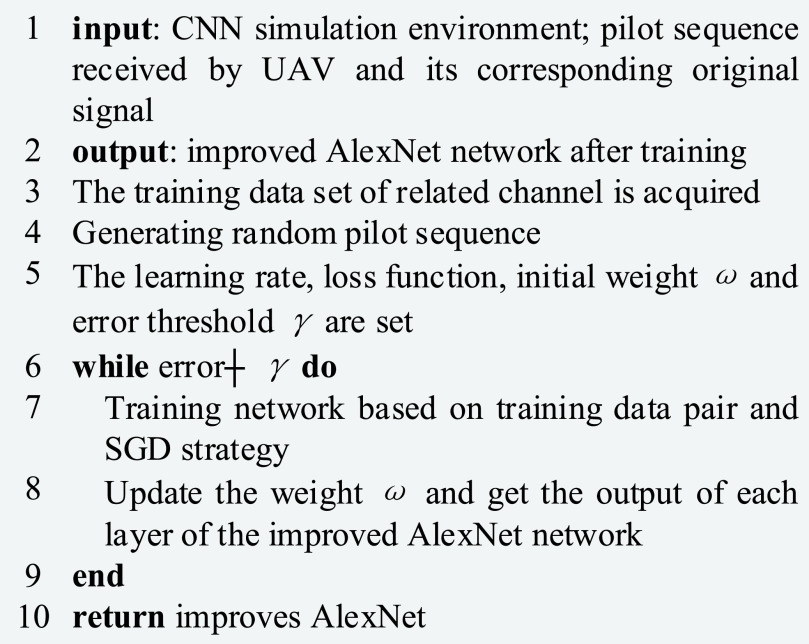
 is 0.0005 (or 5e−4), and power is set to 0.9. The algorithm flow of the improved AlexNet is demonstrated in Figure 4.
Fig. 4.
Algorithm flow of the improved AlexNet.
Due to category imbalance in different epidemic situations, the Weighted Cross-Entropy (WCE) is accepted as a cost function to optimize model training.
Suppose that
 describes the unnormalized logarithmic probability of the pixel
 in the
 -th category under the given network parameter
 . In that case, the SoftMax function
 is defined as:
 |
In (22),
 represents the total number of situation categories. During forecasting, once equation (17) reaches the maximum, pixel
 will be marked as the
 -th category, namely
 . A semantic segmentation task needs to sum the pixel data loss in each input mini-batch. Here,
 denotes the total number of pixels in the training batch of image data,
 refers to the real semantic annotation of pixel
 , and
, and
 describes the forecasted probability of pixel
 belonging to the
 -th semantic category, that is, the log-normalized probability, abbreviated as
 . Hence, the training process aims to find the optimal network parameter
 by minimizing the WCE loss function
 , denoted as
 . Training samples with unbalanced categories in various epidemic situations usually make the network notice some easily distinguishable categories, resulting in poor recognition on some more difficult samples. In this regard, the Online Hard Example Mining (OHEM) strategy [28] is adopted to optimize the network training process. The improved loss function is:
 |
In (23),
 refers to the predefined threshold, and
 describes the symbolic function, which will take 1 if the condition is met and 0 otherwise. The weighted loss function for different COVID-19 prevention and control scenarios is defined as:
 |
In (24) and (25),
 denotes the true label distribution of the
 -th category of pixel
 , as explained in equation (21);
 refers to the weighting coefficient. The following strategy is employed during training:
 |
In (26),
 is an additional hyperparameter, set to 1.10 based on experience during simulation experiments.
D. Simulation Analysis
The proposed model is simulated by OPNET [29] to verify its performance during COVID-19 prevention and control. OPNET builds a cellular network comprising three macro base stations and 15 micro base stations, covering an area of 5km
 5km. Each macro base station covers a circle whose radius is 1km, in which there are five micro base stations. Users are randomly distributed in their respective cells. UAVs connect users at all edge positions to include all users in the enclosed area formed by their trajectories. The built-in camera model of UAV here is FC6310. Finally, the data collected are split into a training dataset and a test dataset in 7:3. The proportion of each failure data in the two datasets shall be kept consistent. Hyperparameters of AlexNet are set as follows: the number of iterations is 120, the simulation time is 2,000 seconds, and the batch size is 128. Some state-of-art models are included for performance comparison, including Long Short-Term Memory (LSTM) [30], CNN, Naive Bayes [31], AlexNet, and Multi-Layer Perceptron (MLP) [32]. In the performance analysis, the proposed algorithm is compared with the model algorithm proposed by other scholars from the data transmission delay [33], throughput [34], average transmission power [35], and data transmission accuracy [36]. The modeling tools are summarized in Table I:
TABLE I. Modeling Tools in Simulation Experiments.
| Versions | ||
|---|---|---|
| Software | Operating System | Linux 64-bit |
| Python | Python 3.6.1 | |
| Simulation Platform | OPNET 14.5 | |
| Development Platform | PyCharm | |
| Hardware | CPU | Intel core i7–7700@4. 2GHz 8 Cores |
| Internal Memory | Kingston DDR4 2400 MHz 16G | |
| GPU | Nvidia GeForce 1060 8G | |
| Parameters | Training SNR

|
−5:5:20dB |
| Number of test channels | 70 | |
| Number of training channels | 410 | |
| Number of pilots | 50 | |
| User terminal transmission power | −10dBm | |
IV. Results and Discussions
A. Data Transmission Performance
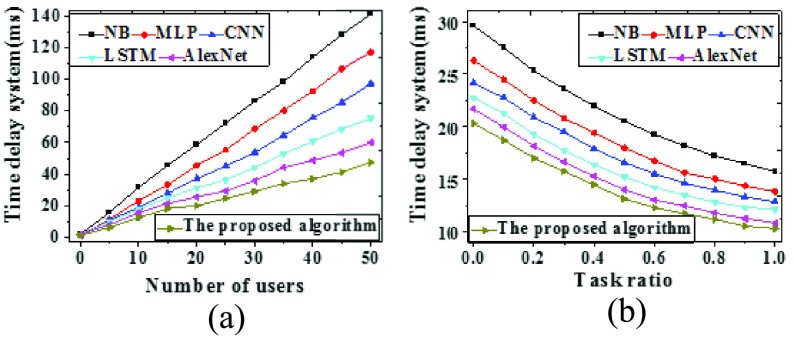
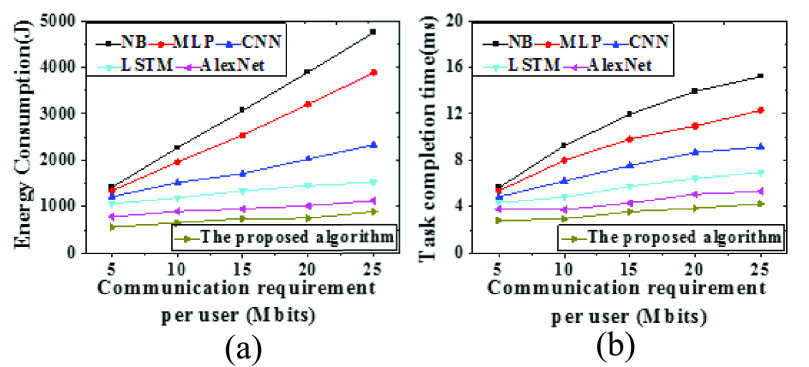
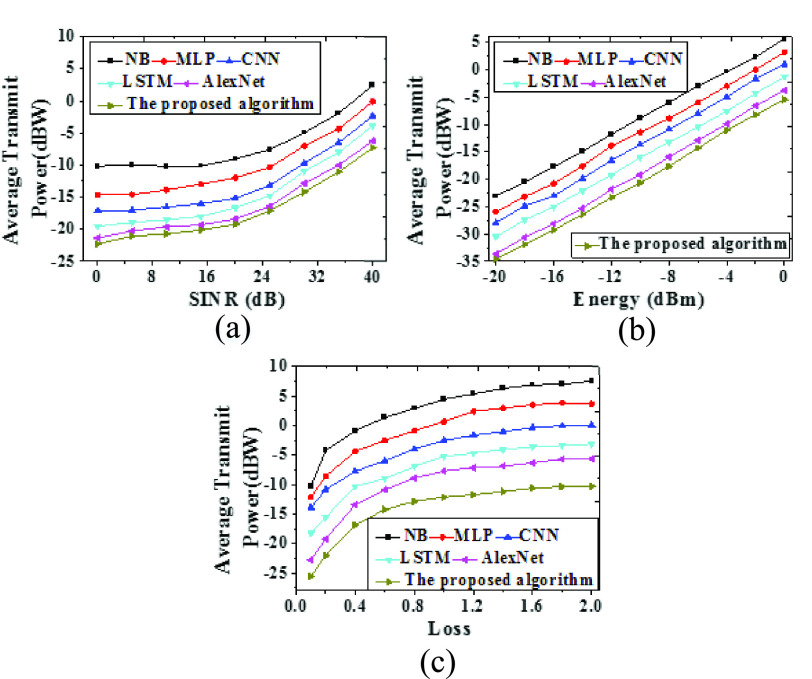
Data transmission performances are analyzed in terms of transmission delay, throughput, and average transmission power. Results are presented in Figures 5 ~ 7.
Fig. 5.
Transmission delays (a. Under different numbers of end-users; b. Under different task proportions).
Fig. 6.
Relationships of energy consumption and task completion time to throughput demand (a. Energy consumption; b. Task completion time).
Fig. 7.
Influencing factors of average transmission power (a. SINR demand; b. Energy harvesting demand; c. Cross link gain demand).
As shown in Figure 5a, as end-users in a cell increase, competition for the same communication resource gets fierce, and the system delay increases accordingly. According to Figure 5b, as the proportion of end-users performing task offloading increases, the system delay becomes lower. Furthermore, the proposed model can provide the lowest transmission delay. Therefore, in the UAV terminal transmission delay, the UAV DTs information prediction model based on improved AlexNet neural network has stronger robustness, that is, the model has smaller error and stability.
Figure 6 analyzes the throughput demands of UAVs when performing tasks. Compared with other models, the proposed model significantly reduces the energy consumption and task completion time of UAVs. More importantly, minimizing task completion time and minimizing energy consumption are not two opposite optimization goals. In fact, minimizing energy consumption can also minimize task completion time, and vice versa.
Figure 7 demonstrates factors influencing the average transmission power. An increase of SINR demand from 0dB to 40dB require more transmission power. The proposed model provides the smallest average transmission power. Moreover, a minimal SINR demand still requires some amount of transmission power due to the fixed user energy demand. Therefore, a tiny information rate demand will require some transmission power if the energy demand exists. An increase in energy harvested asks for more transmission power as well. Still, the proposed model provides the smallest average transmission power. As the cross-link becomes stronger and the interference becomes smaller, the required transmission power stabilizes after it increases to a particular value. The above results demonstrate that the proposed model can reduce the power required to complete the communication demand, utilize the originally wasted radiofrequency energy, and thereby improve the resource utilization rate.
B. Data Transmission Accuracy
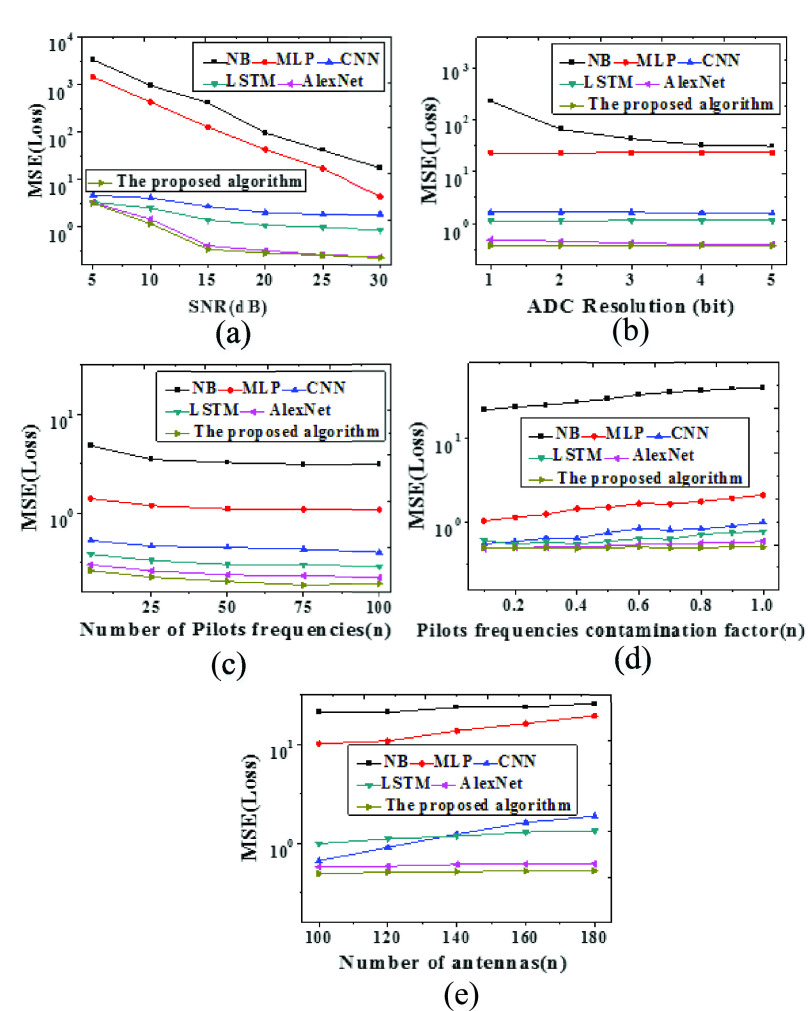
Data transmission accuracies are compared regarding Signal-to- Noise Ratio (SNR), bit quantizer, number of pilots, pilot pollution coefficient, and number of different antennas. Results are demonstrated in Figure 8:
Fig. 8.
Data transmission accuracies (a. Different SNR; b. Different bit quantizer; c. Different length pilot frequency; d. Different pilot frequency pollution coefficient; e. Different antenna number).
As shown in Figure 8a, each model presents a decreasing error rate as SNR goes uptrend. The proposed model performs the best in almost all SNR situations, nearly 80 times than other models. Figure 8b suggests that ADC accuracy affects the estimation performance considerably. Specifically, NB’s performance decreases by 8 times, while AlexNet decreases by 20%. Figure 8c reveals that as the number of pilots increases from 10 to 50, all models’ Mean Square Error (MSE) gets improved; however, after 50, the MSE stops changing significantly. As shown in Figure 8d, as the pilot pollution coefficient increases, the improved AlexNet can maintain its MSE unchanged; in contrast, other models’ errors increase dramatically. As shown in Figure 8e, as antennas add up, MSEs of NB, MLP, CNN, and LSTM all increase linearly because the size of the channel matrix to be estimated increases linearly. Nevertheless, changes in antenna numbers only suggest different sizes of input “image” data for the proposed model, leading to smaller errors. To sum up, the proposed UAV DTs information forecasting model based on the improved AlexNet can provide higher accuracy than other state-of-art models.
C. Forecasting Performance
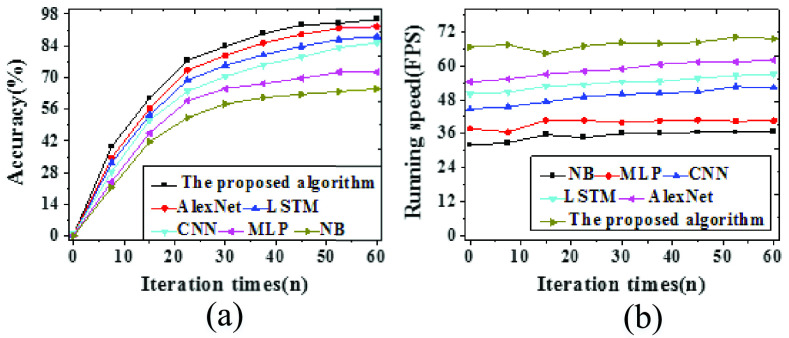
Forecasting performances are assessed considering accuracy and velocity. Figure 9 presents the results.
Fig. 9.
Changes in forecasting accuracy and velocity (a. Forecasting accuracy; b. Forecasting velocity).
Figure 9 proves that the proposed model can provide the highest forecasting accuracy, reaching 95.58%; meanwhile, it also outperforms other models in forecasting velocity, stabilizing at about 35 Frames-Per-Second with iterations. Hence, the above results reveal that the UAV DTs information forecasting model algorithm based on the improved AlexNet neural network can greatly reduce the error of UAV data transmission prediction for each situation in the process of urban COVID-19 prevention and control, and achieve more accurate forecasting effect.
V. Conclusion
UAVs and associated techniques play a positive role in COVID-19 prevention and control, showing huge application potentials. The prediction model of UAV DTs epidemic information based on improved AlexNet neural network is constructed based on the use of UAV, a new technology product, to prevent and control epidemic diseases. The performance analysis of simulation experiment suggests that the transmission delay of UAV data information is significantly lower than that of other algorithms, the energy consumption is less in throughput demand, the task completion time is shorter, and the resource utilization rate is obviously higher. The data transmission accuracy reaches 95.58%, and the prediction speed is also stable at about 35 FPS. It provides experimental reference for epidemic prevention and control and precise investment of medical resources in the later stage.
Nevertheless, the present study also has some weaknesses. The proposed model assumes that UAV communication systems have sufficient resources to ensure offline training and running deployment of DL algorithms. However, computing power and power resources are often limited is real-life settings. How to exercise the advantages of DL algorithms with limited resources will be explored in the future. Moreover, all the experiments are simulated on software. Physical simulation platforms or tests can be constructed and performed in the future for further exploration.
Biographies

Zhihan Lv (Senior Member, IEEE) has contributed 300 articles, including more than 50 articles on IEEE/ACM Transactions. He has received U.S. $1.5 million funding as a PI. He has been involved in many European and Chinese projects supported with funding of U.S. $25 million. He received more than 20 awards from China, Europe, and IEEE. He has given more than 80 invited talks for universities and companies in Europe and China. He has given 15 keynote speeches for international conferences. He is currently the Co-Chair or a TPC of 50 conferences, including ACM MM 2021 and ACM IUI 2015-2022. He has reviewed 400 articles. He is also the Editor-in-Chief of Internet of Things and Cyber-Physical Systems (KeAi); an Associate Editor of 18 journals, including IEEE Transactions on Intelligent Transportation Systems, IEEE Transactions on Network and Service Management, and IEEE Technology Policy and Ethics Newsletter; and a Leading Guest Editor for 40 special issues, including nine IEEE.

Dongliang Chen (Graduate Student Member, IEEE) is currently pursuing the M.S. degree with the College of Computer Science and Technology, Qingdao University, China. He has published ten articles in IEEE Internet of Things Journal, FGCS, TOIT, SCS, and IMAVIS journals. His research interests include deep learning, computer vision, serious game, cyber security, reinforcement learning, and game analysis.

Hailin Feng (Member, IEEE) received the Ph.D. degree in computer science from the University of Science and Technology of China in June 2007. Since 2007, he has been working with the School of Information Engineering, Zhejiang A & F University. From 2013 to 2014, he was a Visiting Professor with the Forest Products Laboratory, USDA. He is currently a Professor with the School of Information Engineering. His main research interests include computer vision, intelligent information processing, and the Internet of Things.

Hu Zhu (Member, IEEE) received the B.S. degree in mathematics and applied mathematics from Huaibei Coal Industry Teachers College, Huaibei, China, in 2007, and the M.S. and Ph.D. degrees in computational mathematics and pattern recognition and intelligent systems from the Huazhong University of Science and Technology, Wuhan, China, in 2009 and 2013, respectively. In 2013, he joined Nanjing University of Posts and Telecommunications, Nanjing, China. His research interests include pattern recognition, image processing, and computer vision.

Haibin Lv (Senior Member, IEEE) received the Ph.D. degree from the First Institute of Oceanography, State Oceanic Administration, in 1990. He is currently a Full Professor with North China Sea Offshore Engineering Survey Institute, Ministry of Natural Resources North Sea Bureau, Qingdao, China. He has 30 years of research and practical experience in geoinformatics, image processing, the Internet of Things, marine surveying and mapping, and evaluation and assessment of the marine environment. He has completed more than 30 consulting and research projects in related fields. He has published more than 80 high quality articles on journals, such as IEEE Transactions on Industrial Informatics, IEEE Access, and Neurocomputing, and including five IEEE Transactions on Industrial Informatics articles. He received Chinese National Oceanic Science and Technology Progress Award for two times. He is also a member of the Editor Board of PLOS One, IET Image Processing, and PeerJ Computer Science. He is also a Leading Guest Editor of IEEE Transactions on Intelligent Transportation Systems, IEEE Journal of Biomedical and Health Informatics, Computers & Electrical Engineering, The Journal of Supercomputing, Image and Vision Computing, and Journal of Sensors. He is also a Reviewer of IEEE Transactions on Industrial Informatics, IEEE Internet of Things Journal, IEEE Access, Multimedia Tools and Applications, PLOS One, and Scientific Reports.
Funding Statement
This work was supported in part by the National Natural Science Foundation of China under Grant 61902203 and in part by the Key Research and Development Plan—Major Scientific and Technological Innovation Projects of Shandong Province under Grant 2019JZZY020101.
Contributor Information
Zhihan Lv, Email: lvzhihan@gmail.com.
Dongliang Chen, Email: cdlord@qq.com.
Hailin Feng, Email: hlfeng@zafu.edu.cn.
Hu Zhu, Email: zhuhu@njupt.edu.cn.
Haibin Lv, Email: lvhaibinsoa@gmail.com.
References
- [1].Deren L., Wenbo Y., and Zhenfeng S., “Smart city based on digital twins,” Comput. Urban Sci., vol. 1, no. 1, pp. 1–11, Dec. 2021. [Google Scholar]
- [2].Alsamhi S. H., Lee B., Guizani M., Kumar N., Qiao Y., and Liu X., “Blockchain for decentralized multi-drone to combat COVID-19,” 2021, arXiv:2102.00969. [Online]. Available: https://arxiv.org/abs/2102.00969
- [3].Gökalp E., Kayabay K., and Gökalp M. O., “Leveraging digital transformation technologies to tackle COVID-19: Proposing a privacy-first holistic framework,” Emerg. Technol. During Era COVID-19 Pandemic, vol. 348, p. 149, Mar. 2021. [Google Scholar]
- [4].Allam Z. and Jones D. S., “Future (post-COVID) digital, smart and sustainable cities in the wake of 6G: Digital twins, immersive realities and new urban economies,” Land Use Policy, vol. 101, pp. 105201–105203, Feb. 2021. [Google Scholar]
- [5].Kemppinen O., Laning J. C., Mersmann R. D., Videen G., and Berg M. J., “Imaging atmospheric aerosol particles from a UAV with digital holography,” Sci. Rep., vol. 10, no. 1, pp. 1–12, Dec. 2020. [DOI] [PMC free article] [PubMed] [Google Scholar]
- [6].Queiroz M. M., Ivanov D., Dolgui A., and Wamba S. F., “Impacts of epidemic outbreaks on supply chains: Mapping a research agenda amid the COVID-19 pandemic through a structured literature review,” Ann. Oper. Res., vol. 116, pp. 1–38, Jun. 2020. [DOI] [PMC free article] [PubMed] [Google Scholar]
- [7].Yigitcanlar T.et al. , “Artificial intelligence technologies and related urban planning and development concepts: How are they perceived and utilized in Australia?” J. Open Innov., Technol., Market, Complex., vol. 6, no. 4, p. 187, Dec. 2020. [Google Scholar]
- [8].Hassija V., Chamola V., Gupta V., Jain S., and Guizani N., “A survey on supply chain security: Application areas, security threats, and solution architectures,” IEEE Internet Things J., vol. 8, no. 8, pp. 6222–6246, Apr. 2021. [Google Scholar]
- [9].Lei L., Shen G., Zhang L., and Li Z., “Toward intelligent cooperation of UAV swarms: When machine learning meets digital twin,” IEEE Netw., vol. 35, no. 1, pp. 386–392, Jan. 2021. [Google Scholar]
- [10].Fawaz W., Abou-Rjeily C., and Assi C., “UAV-aided cooperation for FSO communication systems,” IEEE Commun. Mag., vol. 56, no. 1, pp. 70–75, Aug. 2018. [Google Scholar]
- [11].Ye J., Zhang C., Lei H., Pan G., and Ding Z., “Secure UAV-to-UAV systems with spatially random UAVs,” IEEE Wireless Commun. Lett., vol. 8, no. 2, pp. 564–567, Apr. 2018. [Google Scholar]
- [12].Zhang C., Zhang W., Wang W., Yang L., and Zhang W., “Research challenges and opportunities of UAV millimeter-wave communications,” IEEE Wireless Commun., vol. 26, no. 1, pp. 58–62, Feb. 2019. [Google Scholar]
- [13].Yang L., Meng F., Zhang J., Hasna M. O., and Renzo M. D., “On the performance of RIS-assisted dual-hop UAV communication systems,” IEEE Trans. Veh. Technol., vol. 69, no. 9, pp. 10385–10390, Sep. 2020. [Google Scholar]
- [14].Chamola V., Hassija V., Gupta V., and Guizani M., “A comprehensive review of the COVID-19 pandemic and the role of IoT, drones, AI, blockchain, and 5G in managing its impact,” IEEE Access, vol. 8, PP. 90225–90265, 2020. [Google Scholar]
- [15].Li K., Emami Y., Ni W., Tovar E., and Han Z., “Onboard deep deterministic policy gradients for online flight resource allocation of UAVs,” IEEE Netw. Lett., vol. 2, no. 3, pp. 106–110, Sep. 2020. [Google Scholar]
- [16].Kumar A., Elsersy M., Darwsih A., and Hassanien A. E., “Drones combat COVID-19 epidemic: Innovating and monitoring approach,” in Digital Transformation and Emerging Technologies for Fighting COVID-19 Pandemic: Innovative Approaches. Cham, Switzerland: Springer, 2021, pp. 175–188. [Google Scholar]
- [17].Laplante P., Milojicic D., Serebryakov S., and Bennett D., “Artificial intelligence and critical systems: From hype to reality,” Computer, vol. 53, no. 11, pp. 45–52, Nov. 2020. [Google Scholar]
- [18].Mardani A., Saraji M. K., Mishra A. R., and Rani P., “A novel extended approach under hesitant fuzzy sets to design a framework for assessing the key challenges of digital health interventions adoption during the COVID-19 outbreak,” Appl. Soft Comput., vol. 96, Nov. 2020, Art. no. 106613. [DOI] [PMC free article] [PubMed] [Google Scholar]
- [19].Verma S. and Gustafsson A., “Investigating the emerging COVID-19 research trends in the field of business and management: A bibliometric analysis approach,” J. Bus. Res., vol. 118, pp. 253–261, Sep. 2020. [DOI] [PMC free article] [PubMed] [Google Scholar]
- [20].Kalaboukas K., Rožanec J., Košmerlj A., Kiritsis D., and Arampatzis G., “Implementation of cognitive digital twins in connected and agile supply networks—An operational model,” Appl. Sci., vol. 11, no. 9, p. 4103, Apr. 2021. [Google Scholar]
- [21].Hussain Z., “Paradigm of technological convergence and digital transformation: The challenges of CH sectors in the global COVID-19 pandemic and commencing resilience-based structure for the post-COVID-19 era,” Digit. Appl. Archaeol. Cultural Heritage, vol. 21, Jun. 2021, Art. no. e00182. [Google Scholar]
- [22].Gupta M., Abdelsalam M., and Mittal S., “Enabling and enforcing social distancing measures using smart city and ITS infrastructures: A COVID-19 use case,” 2020, arXiv:2004.09246. [Online]. Available: https://arxiv.org/abs/2004.09246
- [23].Rahman M. F. F., Fan S., Zhang Y., and Chen L., “A comparative study on application of unmanned aerial vehicle systems in agriculture,” Agriculture, vol. 11, no. 1, p. 22, Jan. 2021. [Google Scholar]
- [24].Kunze O. and Frommer F., “The matrix vs. the fifth element—Assessing future scenarios of urban transport from a sustainability perspective,” Sustainability, vol. 13, no. 6, p. 3531, Mar. 2021. [Google Scholar]
- [25].Kaivosoja J.et al. , “Reference measurements in developing UAV systems for detecting pests, weeds, and diseases,” Remote Sens., vol. 13, no. 7, p. 1238, 2021. [Google Scholar]
- [26].Lu H.et al. , “Social signal-driven knowledge automation: A focus on social transportation,” IEEE Trans. Comput. Social Syst., vol. 8, no. 3, pp. 1–17, Jun. 2021. [Google Scholar]
- [27].Devadas T. J., “A survey on agent learning architecture that adopts Internet of Things and wireless sensor networks,” Int. J. Wavelets, Multiresolution Inf. Process., vol. 2020, Dec. 2020, Art. no. 2030002. [Google Scholar]
- [28].Li H., Ota K., and Dong M., “Learning IoT in edge: Deep learning for the Internet of Things with edge computing,” IEEE Netw., vol. 32, no. 1, pp. 96–101, Jan./Feb. 2018. [Google Scholar]
- [29].Zhou X., Liang W., Wang K., Wang H., Yang L. T., and Jin Q., “Deep-learning-enhanced human activity recognition for internet of healthcare things,” IEEE Internet Things J., vol. 7, no. 7, pp. 6429–6438, Jul. 2020. [Google Scholar]
- [30].HaddadPajouh H., Dehghantanha A., Khayami R., and Choo K.-K. R., “A deep recurrent neural network based approach for Internet of Things malware threat hunting,” Future Gener. Comput. Syst., vol. 85, pp. 88–96, Aug. 2018. [Google Scholar]
- [31].Wang X., Wang X., and Mao S., “RF sensing in the Internet of Things: A general deep learning framework,” IEEE Commun. Mag., vol. 56, no. 9, pp. 62–67, Sep. 2018. [Google Scholar]
- [32].Hua W., Dai F., Huang L., Xiong J., and Gui G., “HERO: Human emotions recognition for realizing intelligent Internet of Things,” IEEE Access, vol. 7, pp. 24321–24332, 2019. [Google Scholar]
- [33].Shangguan X.-C.et al. , “Robust load frequency control for power system considering transmission delay and sampling period,” IEEE Trans. Ind. Informat., vol. 17, no. 8, pp. 5292–5303, Aug. 2021. [Google Scholar]
- [34].Deng C.et al. , “IEEE 802.11be Wi-Fi 7: New challenges and opportunities,” IEEE Commun. Surveys Tuts., vol. 22, no. 4, pp. 2136–2166, Jul. 2020. [Google Scholar]
- [35].Fahim H., Javaid S., Li W., Mabrouk I. B., Hasan M. A., and Rasheed M. B. B., “An efficient routing scheme for intrabody nanonetworks using artificial bee colony algorithm,” IEEE Access, vol. 8, pp. 98946–98957, 2020. [Google Scholar]
- [36].Nguyen V. D., Khanh T. T., Tran N. H., Huh E.-N., and Hong C. S., “Joint offloading and IEEE 802.11 p-based contention control in vehicular edge computing,” IEEE Wireless Commun. Lett., vol. 9, no. 7, pp. 1014–1018, Mar. 2020. [Google Scholar]


