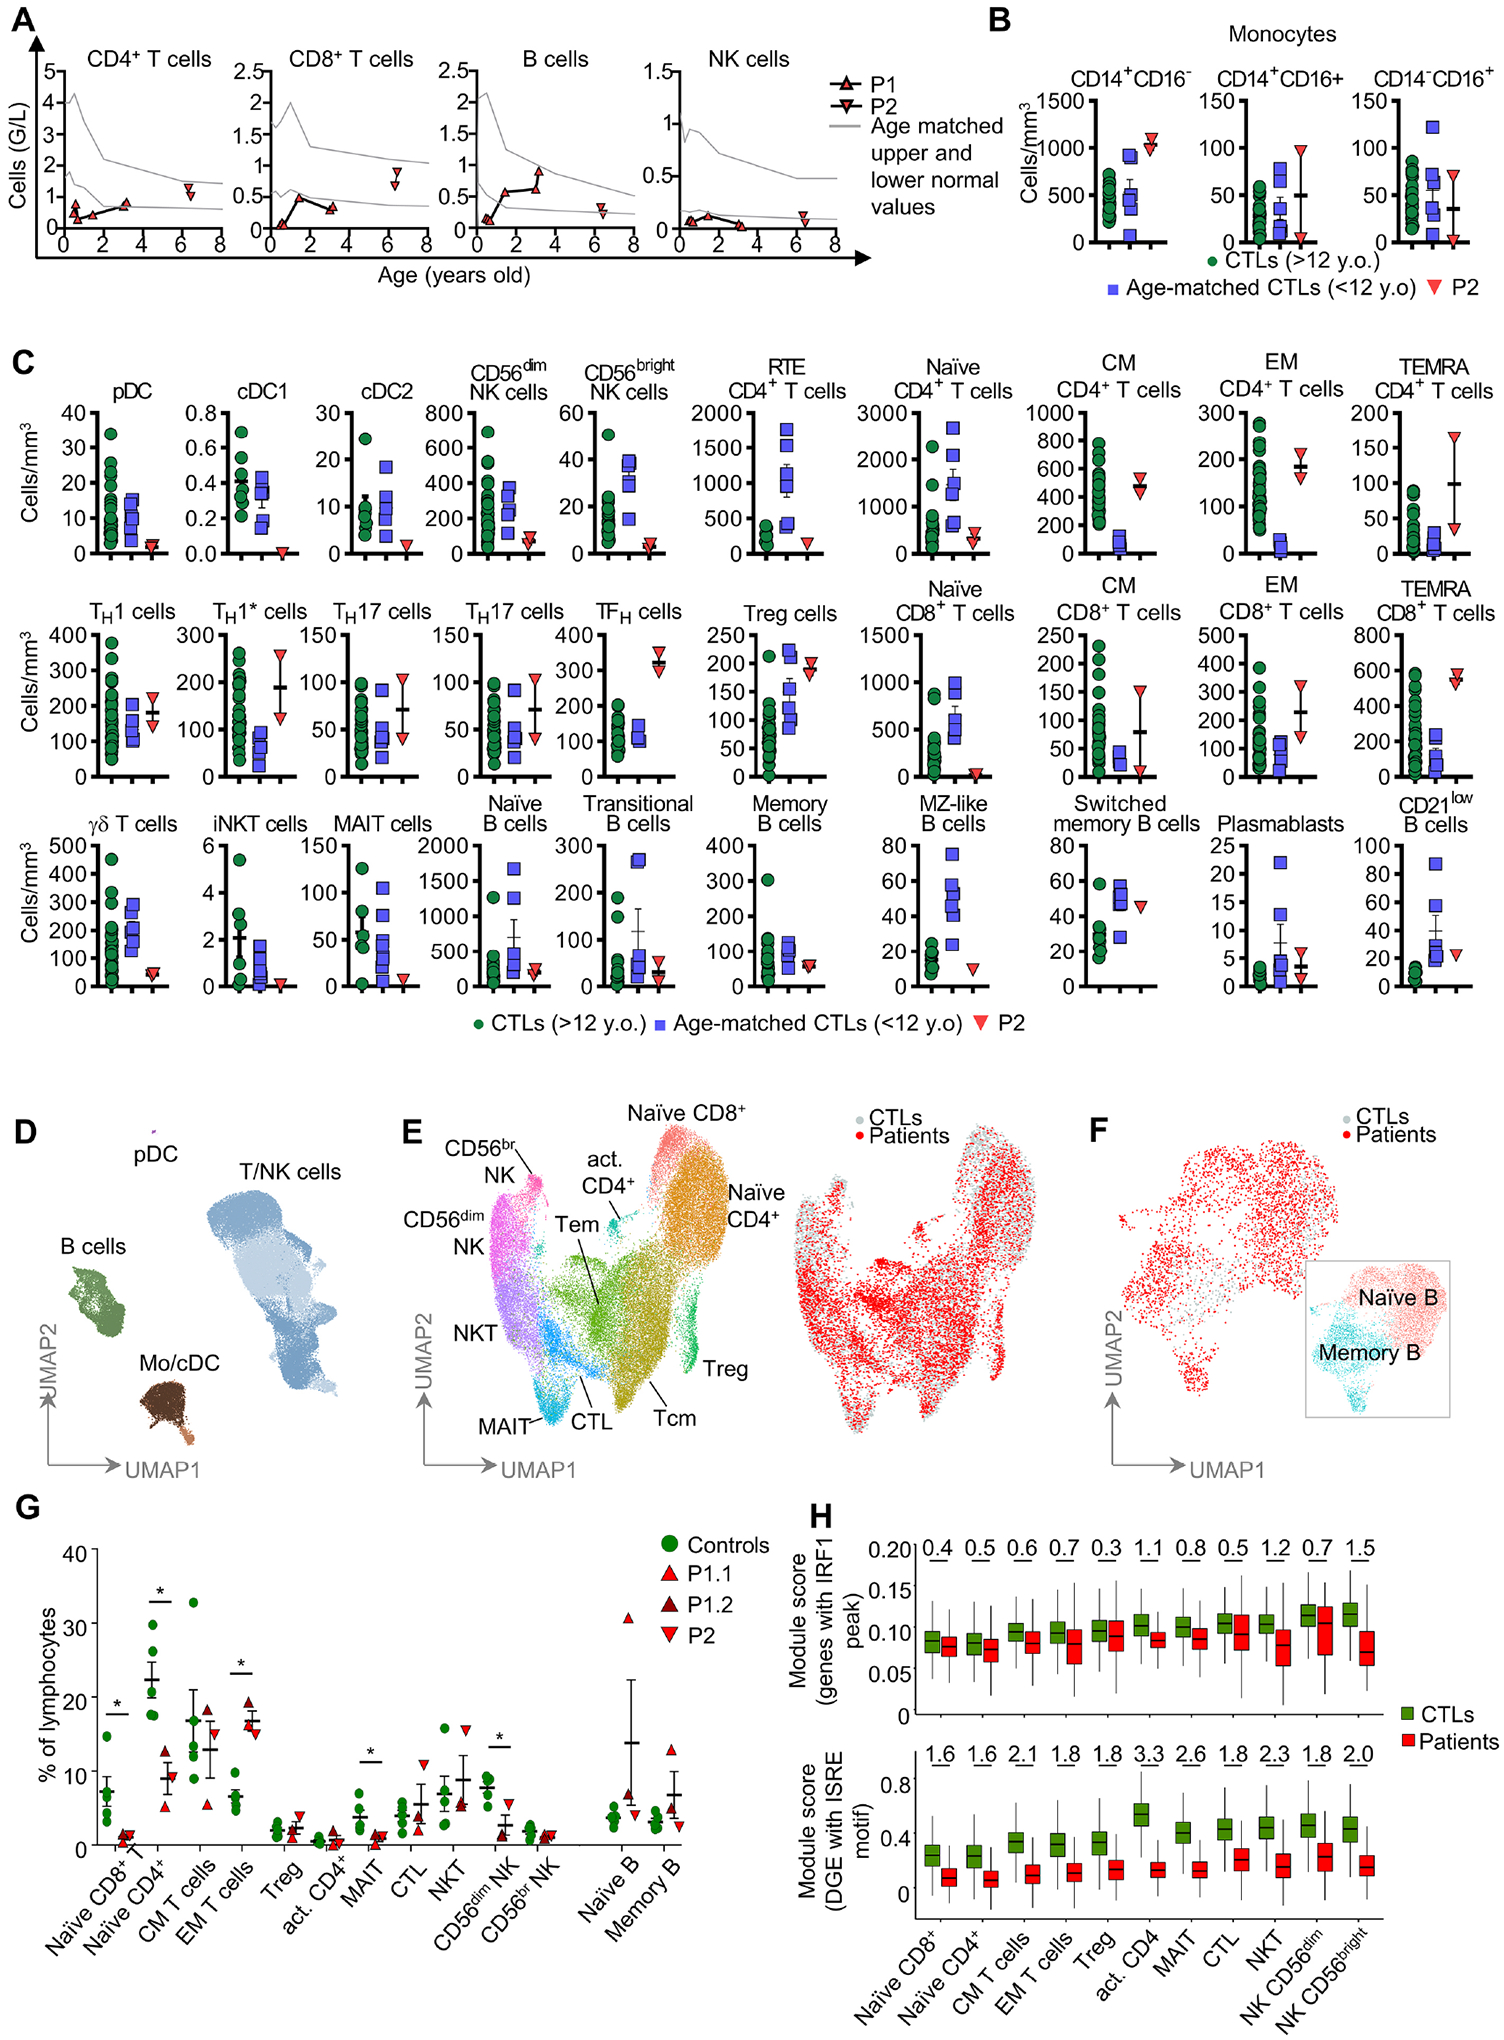
Figure 3 – Phenotyping of peripheral blood leukocytes and single-cell PBMCs from IRF1-deficient patients.

(A) Monitoring of lymphoid cell numbers in the whole blood or PBMCs of patients. (B) Counts for monocyte subsets by mass cytometry on fresh whole-blood cells. (C) Counts of myeloid and lymphoid subsets in fresh whole blood. (D) UMAP clustering for CTLs and samples from the IRF1-deficient patients (2x P1 and 1x P2) profiled by scRNA-seq or CITE-seq. General lineage populations are annotated. (E) Subclustering of T and NK cells to define cell subtypes. Overlay of 10,000 PBMCs from CTLs (gray) and 10,000 PBMCs from an IRF1-deficient patient (red) (F) As in (E), B-cell subclustering and cell-type annotation, together with an overlay of the patients’ and CTLs cells. (G) Proportions of each cell type expressed as a percentage of total lymphocytes. P1.1 corresponds to the first scRNA-seq analysis for P1 and P1.2 corresponds to the CITE-seq performed later on. (H) Module score analysis comparing the expression of genes with IRF1-binding sites within 10 kb of their TSS (top panel), and genes differentially expressed between patients and controls and predicted to have ISRE motifs in their promoters (bottom panel). Cohen’s d effect size estimates are shown for every significant variation of module expression. They were obtained by comparing the module score distribution in every cell subset in Wilcoxon signed-rank tests (q-value <= 0.05).
