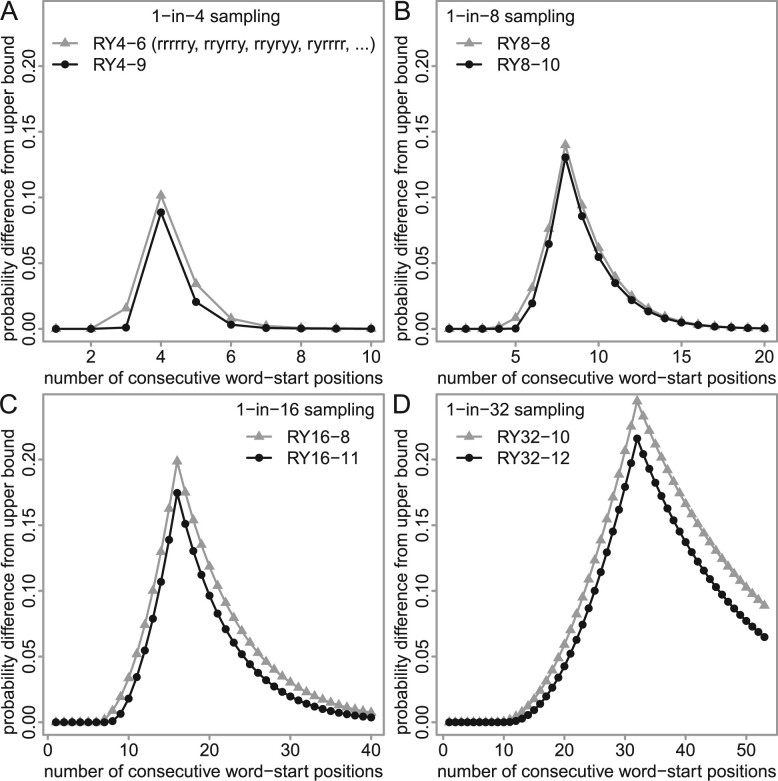
Fig. 3.
Run-hitting probabilities, for sampling schemes with sparsity: (A) 4, (B) 8, (C) 16 and (D) 32. For each run size (horizontal axis), the probability difference from the upper bound is shown (vertical axis). The gray triangles show the best schemes we found previously (Frith et al., 2020), and the black dots show new schemes. The triangles in (A) are equivalent to the triangles in Figure 2

