Fig. 4.

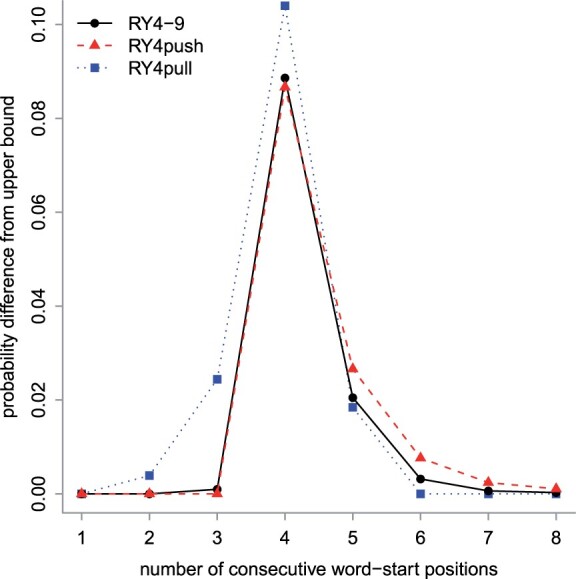
Run-hitting probabilities, for three 1-in-4 sampling schemes. For each run size (horizontal axis), the probability difference from the upper bound is shown (vertical axis). The black dots are the same as in Figure 3A

Run-hitting probabilities, for three 1-in-4 sampling schemes. For each run size (horizontal axis), the probability difference from the upper bound is shown (vertical axis). The black dots are the same as in Figure 3A