Abstract
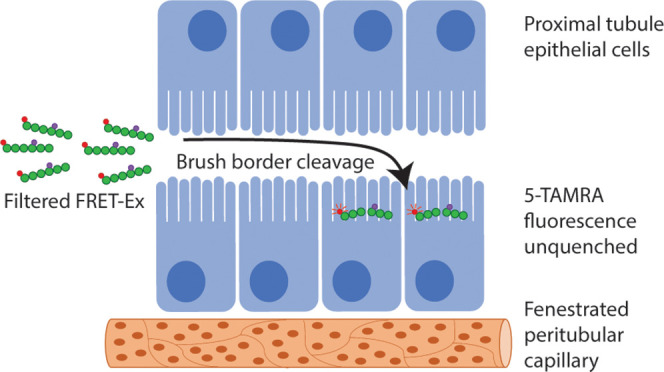
Despite the understanding that renal clearance is pivotal for driving the pharmacokinetics of numerous therapeutic proteins and peptides, the specific processes that occur following glomerular filtration remain poorly defined. For instance, sites of catabolism within the proximal tubule can occur at the brush border, within lysosomes following endocytosis, or even within the tubule lumen itself. The objective of the current study was to address these limitations and develop methodology to study the kidney disposition of a model therapeutic protein. Exenatide is a peptide used to treat type 2 diabetes mellitus. Glomerular filtration and ensuing renal catabolism have been shown to be its principal clearance pathway. Here, we designed and validated a Förster resonance energy transfer-quenched exenatide derivative to provide critical information on the renal handling of exenatide. A combination of in vitro techniques was used to confirm substantial fluorescence quenching of intact peptide that was released upon proteolytic cleavage. This evaluation was then followed by an assessment of the in vivo disposition of quenched exenatide directly within kidneys of living rats via intravital two-photon microscopy. Live imaging demonstrated rapid glomerular filtration and identified exenatide metabolism occurred within the subapical regions of the proximal tubule epithelia, with subsequent intracellular trafficking of cleaved fragments. These results provide a novel examination into the real-time, intravital disposition of a protein therapeutic within the kidney and offer a platform to build upon for future work.
Keywords: renal metabolism, FRET, intravital two-photon microscopy
Introduction
Following glomerular filtration, peptides and proteins in the ultrafiltrate can be catabolized by enzymes at the brush border or within the tubular lumen, internalized by proximal tubule epithelial cells (PTECs), or excreted unmodified into the urine. Reabsorbed proteins and peptides undergo intracellular trafficking to either lysosomes with subsequent catabolism or transcytosis of intact protein to the peritubular circulation.1−3 However, traditional techniques to study the renal disposition of proteins and peptides do not fully recapitulate the complex environment of the nephron. Current methods to measure renal metabolism, such as brush border membrane isolations, kidney slices, and isolated proximal tubule cells, often fail to capture proximal tubule architecture or proper cellular physiology. Therefore, novel methods to obtain and quantify the renal disposition of protein therapeutics are needed. Additionally, techniques capable of producing detailed measurements in short time scales (seconds to minutes) are required for peptides that undergo fast glomerular filtration.
Intravital two-photon microscopy (IVM) has rapidly advanced the study of intracellular and intercellular processes at the organ level. IVM has emerged as a unique tool to study the dynamics of kidney physiology.4 It possesses the capability of directly measuring the cell-specific disposition of fluorescently labeled proteins within living kidneys, all in real-time.5,6 This latter attribute is crucial because current resolutions can differentiate the spatial localization within key segments of mammalian kidneys: glomeruli, proximal tubules, distal tubules, collecting ducts, and renal capillaries. To our knowledge, no other method can dynamically obtain the renal pharmacokinetics of protein therapeutics in a multitude of cell types at the magnifications and resolutions obtained with IVM. We therefore proposed IVM would provide a powerful technique to address existing limitations.
The current project had two objectives. The first was to study the renal handling of fluorescently labeled exenatide using IVM. Exenatide is a 39 amino acid peptide therapeutic used for the treatment of type 2 diabetes mellitus.7 It was chosen as a model therapeutic modality because glomerular filtration and subsequent renal catabolism is the predominant clearance pathway, though additional mechanisms have been proposed.7,8 However, a key limitation would be the inability to discern intact from metabolized exenatide. Thus, our second aim was to develop the means of measuring in vivo peptide catabolism to pinpoint the precise metabolic sites within the kidney. Förster resonance energy transfer (FRET) identifies distance-dependent interactions of two distinct dye-linked molecules: the “fluorophore” and the “quencher”. When located near (∼10–100 Å) an appropriate quencher molecule which possesses absorption spectra equivalent to fluorophore emission, excited fluorophores transfer resonance energy to the quencher in lieu of photon emissions.9 We incorporated the 5-TAMRA:QSY7 fluorophore-quencher pair onto exenatide such that significant ablation of 5-TAMRA fluorescence would occur on the intact peptide. When cleaved, the QSY7 dye would be released to permit 5-TAMRA fluorescence.
The current work utilized a variety of in vitro techniques to validate the functionality of FRET-quenched exenatide (FRET-Ex). Following confirmation, intravital two-photon imaging was successfully employed to study the renal disposition of exenatide, including the real-time assessment of exenatide metabolism directly within intact kidneys.
Experimental Methods
FRET-Quenched Exenatide Design and Synthesis
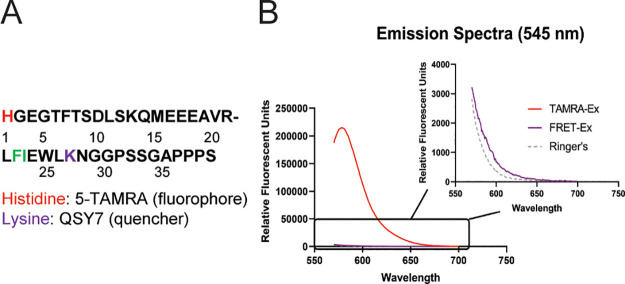
The histidine at position 1 (5-TAMRA) and lysine at position 27 (QSY7) of the exenatide peptide were chosen as labeling sites because of their amenability to fluorescent conjugation, optimal separation for FRET quenching and location on opposite sides of the conserved cleavage site that was reported previously (Figure 1A).7 Synthesis of 5-TAMRA exenatide (TAMRA-Ex) and the dual labeled 5-TAMRA-QSY7 exenatide (FRET-Ex) was performed by CPC Scientific (San Jose, CA).
Figure 1.
QSY7 significantly quenches 5-TAMRA fluorescence on labeled exenatide. A. Exenatide amino acid sequence, indicating labeling sites for 5-TAMRA and QSY7. F–I Cleavage sites determined to be conserved across several species in Copley et al.7 Peptides synthesized were exenatide labeled with 5-TAMRA alone (TAMRA-Ex) or with both 5-TAMRA and QSY7 (FRET-Ex). B. Emission spectra at 545 nm excitation of intact peptides demonstrated substantial fluorescent quenching of 5-TAMRA when the QSY7 dye was present. Ringer’s solution was used to dissolve both peptides and was included as a reference of the background fluorescence.
Fluorescent Measurements of Exenatide Fluorescent Derivatives
TAMRA-Ex and FRET-Ex were dissolved in Ringer’s solution (122.5 mM NaCl, 5.4 mM KCl, 1.2 mM CaCl2, 0.8 mM MgCl2, 0.8 mM Na2HPO4, 0.2 mM NaH2PO4, 5.5 mM d-glucose, and 10 mM HEPES; pH 7.4) at 10 μg/mL and fluorescence emission spectra obtained at 545 nm excitation on a standard fluorometer (Photon Technology International, Birmingham, NJ).
Enzymatic Digestion Assays
Sequencing-grade trypsin (T6567, Millipore-Sigma, St. Louis, MO) and chymotrypsin (V106A, Promega, Madison, WI) were used for cleavage studies in a manner consistent with their respective product material sheets. Trypsin was resuspended in 1 mM HCl. Chymotrypsin was resuspended in 1 mM HCl and 2 mM CaCl2. Reaction buffers used were 100 mM ammonium bicarbonate (pH 8.5) for trypsin and 50 mM Tris-HCl, 10 mM CaCl2 (pH 7.8) for chymotrypsin. An enzyme-to-exenatide ratio of 1:100 was utilized for both enzymes because it provided ideal cleavage kinetics based on our preliminary experiments. Exenatide (ProSpec, East Brunswick, NJ), TAMRA-Ex, and FRET-Ex were added to prechilled reaction tubes on ice at final concentrations of 0.5 mg/mL and final reaction volumes of 500 μL. Trypsin and chymotrypsin were then added to tubes containing their appropriate reaction buffers. Tubes were mixed, the initial samples collected, and all tubes then placed in a 37 °C water bath to initiate reactions. Sampling was conducted at 5, 15, 30, and 60 min. An additional sample for FRET-Ex alone was obtained at 3.5 h to confirm total degradation. At each time point, 50 μL of sample was added to 950 μL of 1% (v/v) formic acid to halt enzymatic activity and immediately analyzed as described in the ensuing sections.
Liquid Chromatography–Electrospray Ionization–Mass Spectrometry (LC-ESI-MS/MS)
A Sciex (Framingham, MA) API 3000 triple quadrupole mass spectrometer/Shimadzu (Columbia, MD) Prominence HPLC was utilized for analysis. The mass spectrometer was run in two different modes for the evaluation of the peptide samples.
Mode 1
For relative evaluation of each intact peptide, the LC-ESI-MS/MS was run in positive multiple reaction monitoring mode with the following ion transitions observed: 838.4/948.8 (exenatide), 926.9/1051.9 (TAMRA-Ex), and 1049.1/1212.4 (FRET-Ex). This method provided a means to monitor the presence of each intact peptide over time with and without the addition of trypsin and chymotrypsin. The chromatographic separation was performed on an XSelect CSH C18 column 2.1 × 100 mm2 3.5u particle size (Waters, Milford, MA) utilizing a gradient elution. The mobile phase consisted of the following: A: 5/95 acetonitrile/water + 0.1% formic acid, B: 95/5 acetonitrile/water + 0.1% formic acid. The gradient was as follows: 0 min (20% B), 5 min (85% B), 7 min (85% B), 7.1 min (20% B), 12 min (20% B).
Mode 2
The digested peptides from the study were evaluated to determine what fragments were formed by the enzymatic activity of trypsin and chymotrypsin utilizing the Sciex API 3000 triple quadrupole mass spectrometer with ESI ionization and running in full scan mode. Samples were scanned from 350 to 1800 Da. Since the peptides form multiply charged species, this range allowed for monitoring of the intact peptide as well as the fragment peptides formed by the enzymatic activity. Characteristic fragment ions were determined in preliminary studies. The same chromatographic column and mobile phase were used, but a longer gradient was employed to separate the fragments formed from the digestion: 0 min (0% B), 20 min (85% B), 25 min (85% B), 25.1 min (0% B), 30 min (0% B).
High-Pressure Liquid Chromatography
To determine if the QSY7 cleavage products were fluorescent, digestion assay samples were run on a Shimadzu Prominence HPLC with both UV/vis and fluorescence detectors. The UV detector was set to monitor 235 and 245 nm, and the fluorescence detector was set at an excitation of 545 nm and an emission of 580 nm to monitor the intact peptides and the fragments formed by digestion. This method used the same mobile phase and gradient profile as Mode 2.
Cell Culture
Studies utilized a subclonal population of the Opossum Kidney PTEC line (OK/P),10 which we have used previously to study proximal tubular protein endocytosis.11,12 OK/P cells were obtained from the lab of Dr. Peter Aronson (Yale University, New Haven, CT) and grown in a 5% CO2 humidified incubator at 37 °C using DMEM (4.5 g/L glucose) containing 4 mM l-glutamine, 1 mM sodium pyruvate, and 10% FBS in the absence of antibiotics.
FRET-Ex Uptake and Cleavage under Static OK/P Culture Conditions
FRET-Ex metabolism was evaluated using an assay previously developed by our group to measure protein endocytosis.11−13 OK/P cells seeded at 12,500 cells/cm2 were grown for 4 days until confluent monolayers formed, then serum starved for 24 h prior to experimentation. Cells were washed three times using ice-cold Ringer’s solution and chilled on ice for 30 min. FRET-Ex (50 μg/mL) was then added and incubated for 60 min on ice to facilitate binding but not internalization based on a previous report.14 Cells were washed twice with ice-cold Ringer’s and then either maintained on ice or placed at 37 °C for 120 min to allow endocytosis and intracellular processing. Cells collected for the 60 min time point and the two 120 min groups were washed four times with ice-cold Ringer’s, trypsinized, centrifuged, resuspended in 400 μL of FACS buffer (2% FBS, 1 mM EDTA, 0.1% sodium azide in PBS), and analyzed via flow cytometry on a BD LSRFortessa (Becton Dickson, San Diego, CA). Results were analyzed using FlowJo software (BD).
Animals
Munich Wistar Frömter rats (9–12 weeks old) were derived from a colony generously provided by Dr. Roland Blantz (UCSF, San Diego, CA.) and maintained in the Indiana University LARC facility. This strain of rat has superficial glomeruli, and the S1 proximal tubule segment can often be identified.4 All rats received water and food ad libitum throughout the study. All experiments followed NIH Guide for the Care and Use of Laboratory Animals guidelines and approved by the Animal Care and Use Committee at the Indiana University School of Medicine. Male and female rats were anesthetized using isofluorane 5% induction and 2% maintenance at 1.0 L/min O2. Jugular and femoral venous lines were used to introduce fluorescent molecules in rapid succession. All rats had normal body temperature during the imaging procedure and were monitored as previously described.15
Two-Photon Microscopy
Intravital two-photon imaging of the kidney outer cortex was conducted using a Leica Dive SP-8 (Leica Microsystems, Buffalo Grove, IL) on an inverted platform for two-photon microscopy as previously described.16 Simultaneous two-photon excitation of the nuclear dye Hoechst 33342, fluorescein (FITC), and 5-TAMRA dyes was accomplished using a tunable Mai-Tai mode locked two-photon laser at a wavelength of 800 nm; laser transmissivity was kept at 2.0%.
FRET-Ex Metabolism in Renal Proximal Tubules
Utilizing two-photon microscopy to visualize the kidney surface, individual glomeruli were identified and marked prior to infusion of the exenatide fluorescent conjugates. Single bolus injections of TAMRA-Ex and FRET-Ex were administered at a dose of ∼300 μg/kg via an indwelling jugular venous line. A 200 frame movie with an acquisition rate of approximately 1.5 frames/s was taken to capture the administration and immediate renal biodistribution (Supporting Video 2). For studies utilizing the 40 kDa FITC-conjugated dextran (Invitrogen, Waltham, MA), the dextran was infused intravenously through a second indwelling femoral venous line prior to administration of the FRET-Ex peptide.
Statistical Analyses
Statistical comparisons were performed in GraphPad Prism 8 (San Diego, CA), with specific test information reported in relevant figure legends.
Results
Confirmation of FRET-Ex Quenching Functionality: Enzymatic Digestion Assays
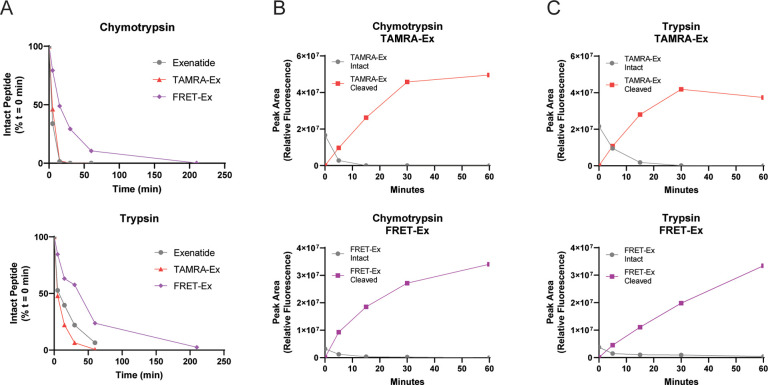
Fluorescent emission spectra at 545 nm excitation indicated near-complete ablation of 5-TAMRA fluorescence on intact FRET-Ex when compared to TAMRA-Ex (Figure 1B). To measure the capability of 5-TAMRA to fluoresce upon proteolytic cleavage, TAMRA-Ex and FRET-Ex were incubated with trypsin or chymotrypsin to enable enzymatic degradation and timed collections made. The goal of these studies was to confirm the functionality of the FRET-Ex probe through an in vitro approach such that fluorescence dequenching would occur following enzymatic degradation. Unlabeled exenatide was included as a reference. LC/MS/MS demonstrated the experimental conditions resulted in complete loss of intact peptides (Figure 2A) as well as matching metabolites generated by the individual enzymes that possessed the 5-TAMRA fluorophore (i.e., chymotrypsin produced the same 5-TAMRA containing metabolite for both FRET-Ex and TAMRA-Ex; Supporting Figures 1 and 2). HPLC with fluorescent detection was conducted on simultaneously collected samples. Intact TAMRA-Ex exhibited significantly higher fluorescence when compared to intact FRET-Ex at baseline (Figure 2B,C). Time-dependent increases in the amount of fluorescent metabolites were observed for both peptides by both enzymes. This demonstrates that cleavage of FRET-Ex by either chymotrypsin or trypsin releases QSY7-mediated FRET quenching, allowing the 5-TAMRA-containing cleavage product to fluoresce.
Figure 2.
Enzymatic digestion releases QSY7 fluorescent quenching. A. Exenatide, TAMRA-Ex, and FRET-Ex peptides were incubated with either trypsin or chymotrypsin and timed collections made to determine the enzymatic reaction kinetics for each peptide. LC/MS/MS was used to quantify the amount of intact peptides remaining relative to the initial time point. Unlabeled exenatide and TAMRA-Ex exhibited similar rates of metabolism. FRET-Ex was cleaved at a slower rate by both purified enzymes. An additional FRET-Ex time point was performed to capture a near complete product loss. B, C. Peptides were subjected to proteolytic digestion using either recombinant chymotrypsin (B) or trypsin (C), with fluorescence of intact and cleaved peptide determined via HPLC. Results from both enzymes indicated rise of cleavage product and loss of intact peptide. The ability to detect a fluorescent FRET-Ex metabolite indicates the release of fluorescence quenching in the cleavage product. LC/MS/MS was used to confirm the identity of intact and cleaved peptides.
Confirmation of FRET-Ex Quenching Functionality: FRET-Ex Metabolism by Cultured PTECs
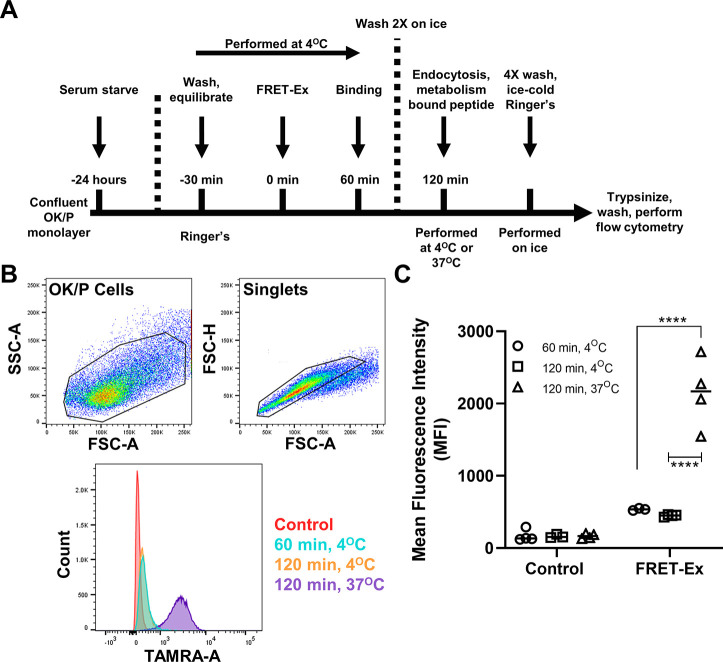
We next assessed FRET-Ex metabolism by the subclonal OK/P PTEC line. The experimental workflow is outlined in Figure 3A. Following a 24 h serum starve, confluent OK/P cell monolayers were washed and equilibrated at 4 °C. Cells were then incubated with FRET-Ex under a maintained 4 °C temperature to facilitate receptor and surface binding but to prevent endocytosis. Untreated OK/P cells were included as controls. After 60 min, cells were washed with ice-cold Ringer’s and either collected for flow cytometry or incubated for an additional 60 min at 4 or 37 °C. All remaining cells were washed, and samples were then processed for and analyzed via flow cytometry (Figure 3B). Relative to the 60 min time point, significant increases in mean 5-TAMRA fluorescence were measured only in the 37 °C group in which endolysosomal processing occurred (Figure 3C). These results therefore indicate FRET-Ex endocytosis and lysosomal degradation, but not binding alone (4 °C), results in the detection of 5-TAMRA fluorescence.
Figure 3.
QSY7-Ex metabolism in cultured OK/P cells. A. Experimental outline. Following a 24 h serum starve, OK/P cells were washed and equilibrated in Ringer’s solution at 4 °C for 30 min. QSY7-Ex was then added to cells for 60 min at 4 °C to facilitate binding but not intracellular trafficking. Afterward, OK/P cells were washed twice with Ringer’s solution. Cells were then incubated at either 37 °C to permit internalization, trafficking, and metabolism or left at 4 °C to inhibit cellular endocytosis. B. Representative gating strategy and histogram plots for each experimental condition. C. At 4 °C, fluorescent intensity of the FRET-Ex peptide significantly rose when incubated at 37 °C but not when maintained at 4 °C (****, p < 0.001, two-way ANOVA with Tukey’s multiple comparisons test). This indicates a release of fluorescence upon intracellular catabolism.
Intravital Renal Disposition of TAMRA-Ex and FRET-Ex
IVM studies were centered on outer cortical glomeruli with visible S1 proximal tubule segment openings to capture the glomerular filtration and ensuing proximal tubular reabsorption of the exenatide fluorescent derivatives. Intravenous infusion of TAMRA-Ex into Munich Wistar Frömter rats resulted in the immediate and pronounced detection of fluorescence within observed vascular compartments alongside rapid and extensive proximal tubule binding and endocytosis (Figure 4, left panels; Supporting Video 1). Successive imaging over the remaining time points indicated apical to basolateral endosomal trafficking patterns. Endogenous fluorescence patterns under two-photon excitation were used to identify PTEC lysosomal compartments.5,6,17,18 In contrast, vascular fluorescence of FRET-Ex was undetectable throughout the initial infusion (Figure 5),and time-matched proximal tubule fluorescence was substantially lower, especially at the earlier time points (Figure 4, right panels; Supporting Video 2). Instead of the immediate PTEC apical fluorescence observed for TAMRA-Ex, we measured a gradual increase in brush border 5-TAMRA fluorescence for FRET-Ex over the first 300 s (Figure 5). Because no measurable increase in 5-TAMRA fluorescence was seen for the FRET-Ex peptide during this time frame in the vasculature, Bowman’s space, or proximal tubule lumens, the rate of fluorescent appearance at the brush border signified the proximal tubular metabolism of FRET-Ex.
Figure 4.
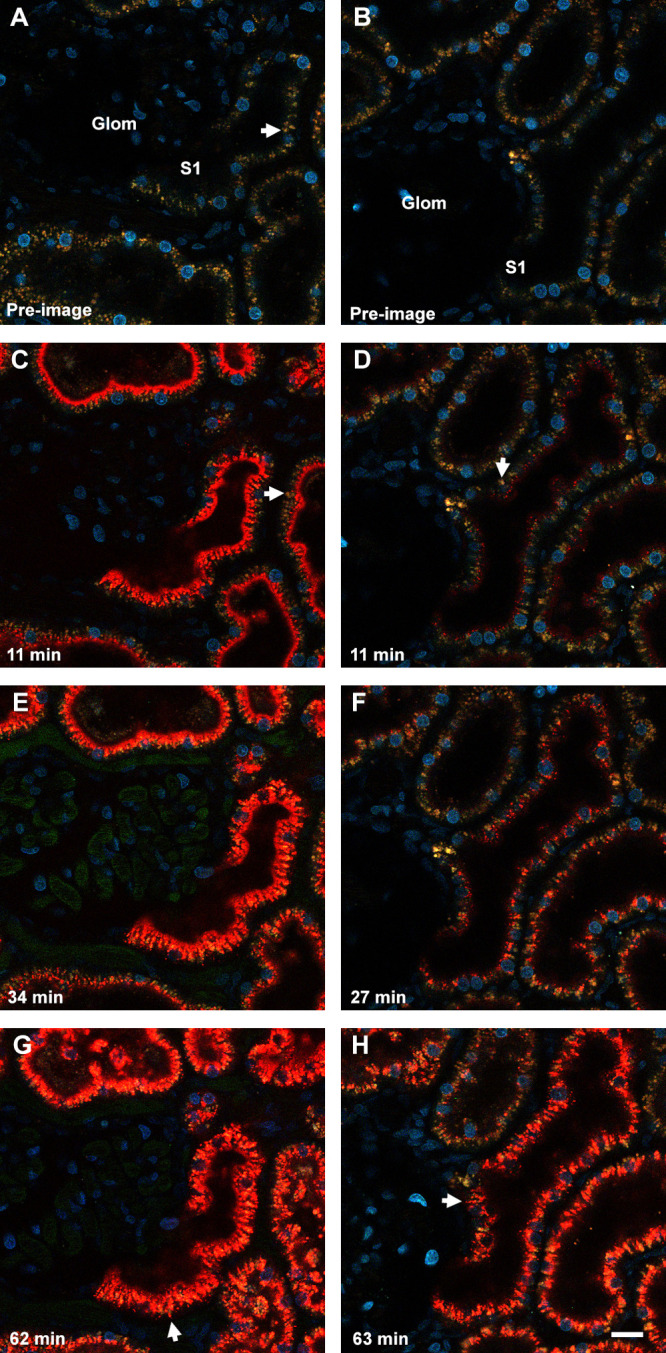
Renal biodistribution of TAMRA-Ex and FRET-Ex. IVM of the rat kidney surface was conducted for approximately 60 min to measure glomerular filtration and proximal tubule (PT) accumulation of TAMRA-Ex and FRET-Ex. Panels A and B show a color image prior to infusion of TAMRA-Ex or FRET-Ex; respectively. Hoechst 33342 was administered to label the nuclei of all cell types (cyan). TAMRA-Ex handling by the kidney at 11 min post infusion (panel C) showed dense binding along the apical brush border and early evidence of small endocytic vesicles forming just below that layer. At this time point, the distinct yellow/orange autofluorescence emanating from the lysosomes remained unchanged (arrow). The endocytic accumulation pattern for the FRET-Ex (panel D) appeared similar at the same time point, but lacked the extensive brush border binding see for TAMRA-Ex. The number of vesicles and associated fluorescence for the FRET-Ex was reduced by comparison; here again the lysosomes retained their characteristic yellow/orange color (arrows). TAMRA-Ex imaging at 34 min demonstrated further movement along the endocytic pathway, with fluorescence appearing closer to the basolateral pole of the PTs (panel E). At this time, the lysosomes began to become TAMRA+ due to the progressive fusion with the fluorescent endocytic vesicles. Accumulation of FRET-Ex at 27 min showed the same, albeit less intense, pattern of trafficking deeper into the PT cells (panel F) with more TAMRA+ lysosomes. Here, however, many of the lysosomes still retained their distinctive yellow/orange autofluorescence when compared to the TAMRA-Ex. Panels G and H show images taken approximately 60 min after infusion of the TAMRA-Ex and FRET-Ex; respectively. Peptide trafficking reached regions extending well into the basolateral region of the PT cells. The arrows in both panels highlight vesicular–tubular structures that formed from the bright structures and extend/retract to and from the basolateral region. Bar = 20 μm.
Figure 5.
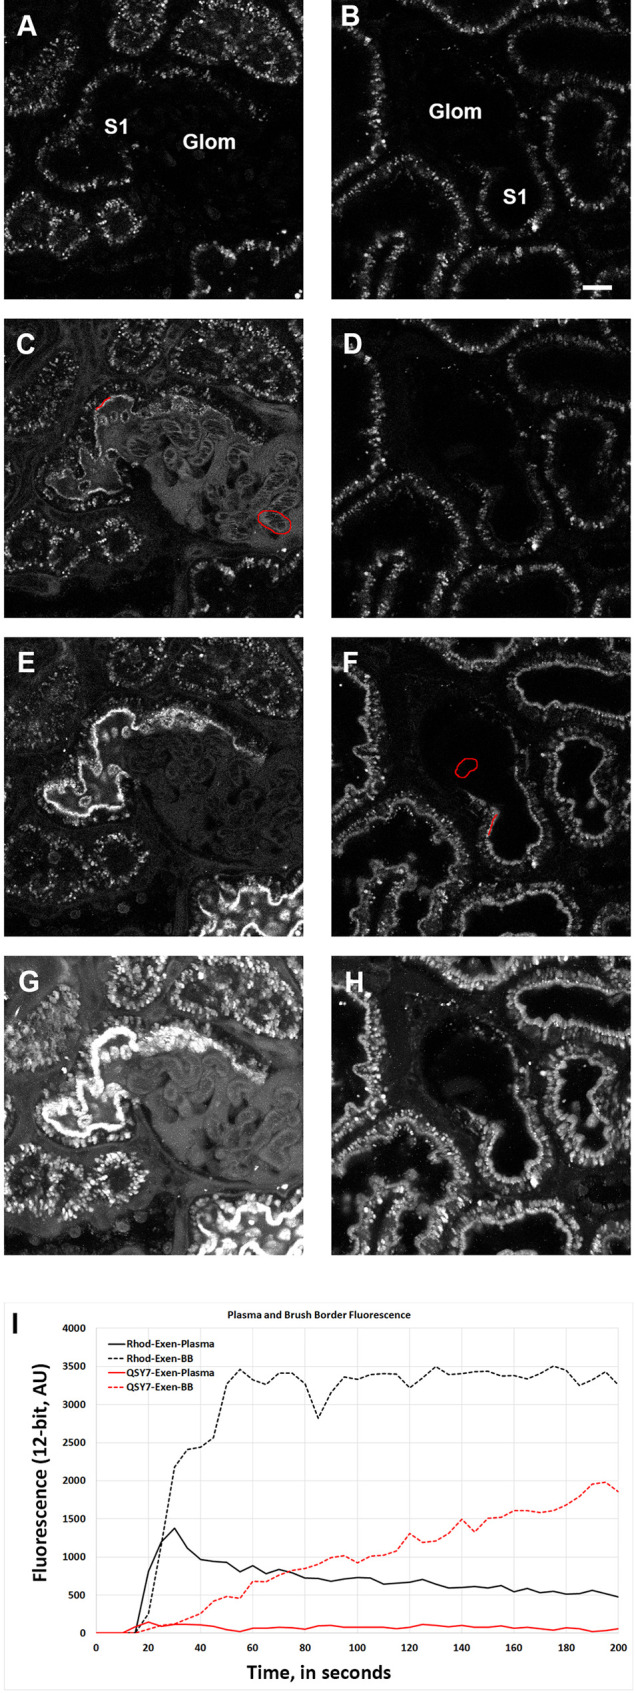
Measurement of the initial renal metabolism of FRET-Ex. Munich Wistar Frömter rats were given a bolus of either TAMRA-Ex (panels A, C, E, and G; left column) or FRET-Ex (panels B, D, F, and H; right column) and the infusion was followed for ∼2 min, 10 s. Panels A and B show images of a glomerulus and adjacent S1 proximal tubule segment in the Rhodamine channel (TAMRA) prior to infusion for TAMRA-Ex and FRET-Ex; respectively. Panel C. Image taken at ∼20 s where TAMRA-Ex was readily detectable in the Bowman’s space and the capillary loops. Enriched apical PTEC binding in the S1 segment is seen as this fluorescence is brighter than the filtered material in the S1 lumen. The highlighted red regions indicate where vascular fluorescence (capillary loops) and brush border fluorescence (red line along subapical region) were determined and graphed in panel I. Panel E shows an image at ∼175 s post infusion of TAMRA-Ex, where the subapical binding peaked in intensity. At this time point, TAMRA was reduced in both the Bowman’s space around the glomerulus and in the plasma within the capillary loops due to rapid glomerular filtration. A time projection of all 200 frames for this movie is seen in panel G, which depicts the combined localized accumulation of the probe in the different regions of the kidney. The slight haze is not due to direct motion artifact but to a slight distention of the tubular lumens in response to the bolus infusion. In contrast, the infusion of FRET-Ex displayed no fluorescence within the capillary loops of the glomerulus (right column of images). Although there is no visible trace of fluorescence within the vasculature, the photomicrograph taken at 20 s in panel D shows the maximum fluorescence seen within the plasma. Note the lack of fluorescence at the subapical space at this time point. Panel F taken at ∼195 s shows the maximum fluorescence detected at the subapical brush border in the time series. The red regions denote where intensity values were taken at the capillary loop and subapical brush border. A comparison of the time projection for FRET-Ex (panel H) showed no detectable fluorescence in either the capillary loops or Bowman’s space; only the subapical region of the proximal tubules displayed any associated fluorescence from dequenching of FRET-Ex. Intensity measurements from the highlighted regions in red were taken every 5 s from the infusion movie, and the background corrected values are graphed in panel I. The values are left as arbitrary fluorescence units, with a maximum value of 4095 (12-bit detectors). The solid black line showing plasma intensities for TAMRA-Ex exhibited a rapid rise peaking at ∼30 s that subsequently decreased as glomerular filtration and nephron transit occurred. The vascular intensity from the FRET-Ex (solid red line) is virtually undetectable; these values remained constant and were only slightly brighter than background fluorescence. The values taken along the subapical brush border region for TAMRA-Ex (broken black line) showed a rapid appearance therein that quickly approached peak values. The data from the same region for FRET-Ex displayed a protracted linear increase in subapical brush border fluorescence, indicative that dequenching occurred gradually in this region. Bar = 20 μm, panel C.
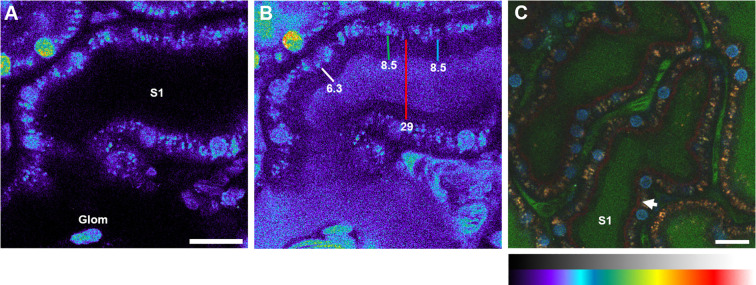
We expanded upon these results and focused our intravital imaging efforts on delineating the cellular localization of the early FRET-Ex fluorescence, which would correspond to its initial renal metabolism. A 40 kDa FITC-labeled dextran was administered intravenously just prior to FRET-Ex. As seen in Figure 6, this sized particle underwent rapid glomerular filtration as evidenced by the measurable FITC fluorescence within proximal tubule lumens. However, there was negligible PTEC binding or endocytosis. Instead, the 40 kDa FITC-dextran generated an outline of the PTEC brush border area that was seen as a 6–8.5 μm voided space between the luminal FITC and intrinsic PTEC fluorescent signals (Figure 6B). FRET-Ex fluorescence was detected within apical vesicular arrangements by 80 s postinjection, becoming marked by 200 s (Figure 6C). The FRET-Ex spatial fluorescence was observed just above the endogenous PTEC fluorescence but below the brush border location voided by the FITC-dextran. These results specify that the FRET-Ex renal metabolism occurred within the subapical regions of the PTECs and indicate exenatide can undergo metabolism prior to its intracellular trafficking through PTECs (Figure 7).
Figure 6.
Brush border and subapical region of renal proximal tubules can be distinguished using a 40 kDa FITC dextran in Munich Wistar Frömter rats. A. Preinfusion image of the FITC channel with an S1 segment adjacent to a glomerulus (Glom). Image provided in pseudocolor to better distinguish subtle intensity differences which can be missed in color or black/white formats. A pseudocolor/grayscale reference palette is shown below panel C. B. 3D data set taken of the same region as in panel A after infusion of the 40 kDa FITC dextran. Measurements were taken along what appears to be the brush border at the widest cross section of the 3D volume. The white, green, and light blue bars extend from the subapical region, to the top of the apical microvilli that appear to exclude the dextran (dark blue color). This border is clearly demarcated by a sharp increase in fluorescence in the tubular lumen. The numbers represent measurements in micrometers. The red line shows a region extending between opposite sides of the PT with the ends anchored at the subapical region. C. Color micrograph taken at approximately 150 s where the 40 kDa FITC dextran (green) was coinfused with FRET-Ex (red after unquenching); nuclei were labeled with Hoechst 33342 (cyan). FRET-Ex dequenching occurred at the subapical region, appearing as a continuous line seen well before any evidence of endocytosis. This latter time point was selected to better show the appearance of this continuous line in the color micrograph, but occurs much earlier (within tens of seconds, see Figure 5I). Bars = 20 μm.
Figure 7.
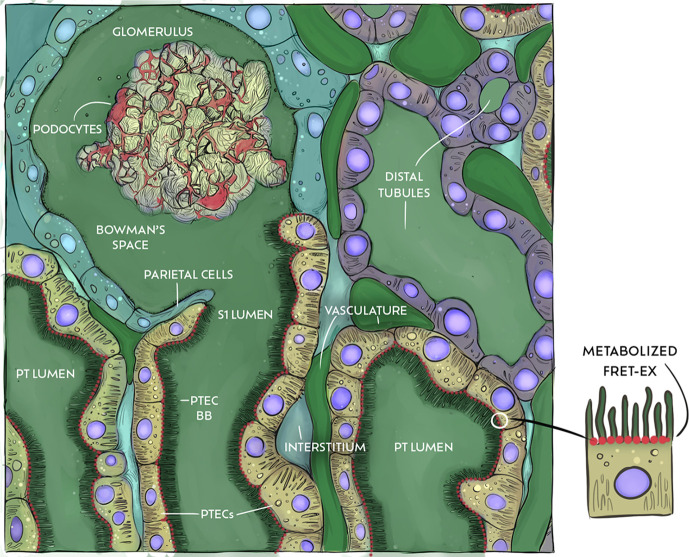
Illustrative summary of the major findings within the current study. Image depicting the renal distribution of a 40 kDa FITC-conjugated dextran post intravenous administration, where it can be rapidly detected in the vasculature, Bowman’s space, and PT and distal tubule lumens. However, within the conditions of the imaging study, the FITC-dextran does not undergo PTEC internalization but rather “shades” the apical aspect. Thus, it provides a means to outline the brush border and help estimate the upper and lower boundaries of the PTEC microvilli. FRET-Ex was administered just after the FITC-dextran. In contrast to the TAMRA-Ex imaging studies, little to no change in TAMRA vascular fluorescence was observed for FRET-Ex due to significant quenching of the intact peptide. Instead, the first appearance of TAMRA fluorescence occurred within the bottom-most portions of the apical space voided by the FITC-dextran. Therefore, the initial TAMRA fluorescent appearance for FRET-Ex corresponds to the site of its initial renal metabolism: the subapical region of the PTEC. PT, proximal tubule; PTEC, proximal tubule epithelial cell; BB, brush border.
Discussion
IVM has enabled tremendous advancements in numerous scientific disciplines and further understandings in multiple organs, but its use within the field of protein therapeutic pharmacokinetics remains limited. Through the combination of a FRET-quenched design and IVM, we have successfully measured the intravital disposition of exenatide within the rat kidney. Previous work demonstrated exenatide possesses high renal clearance, which is expected for a low molecular weight protein.7 Following glomerular filtration, exenatide can undergo either brush border metabolism and/or PTEC reabsorption.1,7 Internalization is likely via receptor-mediated endocytosis by megalin (LRP2), which is expressed at the apical membrane of PTECs and binds a wide range of protein/peptide ligands that includes exenatide.3,19 This was supported by our OK/P cell studies within the current work, which we have previously shown express functioning cell surface megalin.11,12 Internalized exenatide and its cleavage products would then be projected to dissociate from megalin following endosomal acidification and undergo further endolysosomal processing.3
Our current results confirmed the anticipated renal biodistribution of a low molecular weight protein and of exenatide that agree with past and recent findings.1,20,21 The IVM imaging of the TAMRA-Ex peptide demonstrated rapid glomerular filtration, ensuing entry into Bowman’s space, immediate and extensive binding to the S1 PTEC brush border, and the subsequent internalization and intracellular trafficking in an apical to basolateral direction. Additionally, our observations with FRET-Ex supported the brush border metabolism of exenatide within the proximal tubules.
PTEC brush borders contain an abundance of enzymes capable of peptide and protein metabolism.22−26 Past work using traditional membrane preparations inferred exenatide metabolism occurred within the PTEC brush border.7 In the current study, IVM provided the methodology to study this process directly within intact rat kidneys. Our findings afford support for the brush border metabolism of exenatide while providing spatial and temporal information in vivo that was previously unattainable. We observed a near-linear rise in the fluorescent intensity of 5-TAMRA at the PTEC brush border that corresponded to the cleavage of the FRET-Ex peptide based on our in vitro experiments. However, it is important to note that shifts in the metabolic kinetics of exenatide are likely to have occurred because of the fluorescent conjugation. Evidence for this was observed in the current study where FRET-Ex possessed slower rates of proteolytic cleavage then TAMRA-Ex and exenatide. Future work incorporating kinetic studies of TAMRA-Ex and FRET-Ex with rat PT brush border membrane preparations could assist with quantifying the shift in the metabolic rates. These types of comparisons would also be useful in establishing the relationship between in vitro membrane preparations and intravital metabolic measurements.
Based on this limitation, we focused our efforts on determining the spatial localization of the initial FRET-Ex metabolism. We have generated evidence for the initial site of renal metabolism as being the subapical regions of the brush border. This site is consistent with the ultrastructural location of γ-glutamyltransferase in rat kidney, a brush border enzyme.27 The same past report also observed γ-glutamyltransferase in PTEC endosomal vesicle membranes. Therefore, if the degradative enzyme(s) responsible for exenatide cleavage remain active during luminal pH changes within endosomal vesicles, further exenatide metabolism is likely to occur during endocytic transit prior to ensuing intracellular transport (e.g., entering lysosomes). Such a pathway would be consistent with general peptide metabolism in mammalian kidneys proposed previously.1,21,28
Our measurements of the S1 brush border space voided by the 40 kDa dextran were 6–8.5 μm. Past ultrastructural studies in rats measured the S1 PTEC villi height as approximately 4 μm.29 The 29 μm luminal diameter is consistent with previous quantitative assessments in rats.30 The difference in the brush border values may be attributed to several factors. First, the current measurements were made within living tissue absent of any fixation impact where the villi are subjected to intravital fluid dynamics. Second, electron microscopic techniques remain far superior to the magnifications and resolutions attained by current IVM instrumentation that enable precise ultrastructural measurements. Third, the inability to demarcate the PTEC plasma membrane and cytosolic regions would result in overestimation of the brush border. However, it was not our objective to quantitatively measure the villi height but rather utilize an experimental technique to aid in defining the apical aspect of the S1 PTECs. Our imaging demonstrated that the FRET-Ex unquenching occurred at the bottom-most portions of the voided apical space. This in addition to the uniform, ring-like appearance throughout the S1 PT led us to conclude that the initial exenatide metabolism occurred within the subapical regions of the PTEC (Figure 7).
The ability to obtain spatial and dynamic dispositional information for a protein therapeutic is crucial within pharmacokinetics. This is especially important when heterogeneous tissue distribution occurs, such as within the kidneys. Renal IVM can be used to obtain several pharmacokinetic parameters. The glomerular sieving coefficient of a fluorescently conjugated protein can be measured via IVM as previously described.15 This is the ratio of the protein amount within Bowman’s space to that within plasma and is an assessment of glomerular permeability. The glomerular sieving coefficient can then be coupled with plasma concentrations obtained from timed blood collections via analytical techniques (e.g., immunoassay) and glomerular filtration rate (also measurable via IVM) to quantify the filtered load of the therapeutic protein over the study duration, all within the same individual animal.31,32 Furthermore, proximal tubule endocytosis can be quantified using IVM via time-dependent measurements of fluorescent intensities in predefined proximal tubule locations.5 PTEC endocytosis values can even be obtained within the same nephrons as the preceding parameters. Finally, the FRET-Ex probe developed within the current study can be used to calculate the rate of fluorescence formation at the brush border as an indication of the intravital metabolic rate when taking the aforementioned limitations under consideration.
Furthermore, IVM can generate robust data sets at unmatched levels relative to typical experimental workflows within pharmacokinetics and drug metabolism. For instance, the pharmacokinetic information that can be acquired within a single animal during one IVM study matches that of a multianimal, multi-time-point biodistribution study with immunohistochemical detection. However, there are limitations. High-resolution two-photon imaging depths can be superficial, so visualizing certain anatomical sites is either not possible or requires extensive surgery. Additionally, IVM necessitates fluorescent conjugation which can influence the behavior of a protein or peptide.33 Such an impact was seen with the in vitro cleavage rate of FRET-Ex when compared to both TAMRA-Ex and native exenatide (Figure 2A). Therefore, including IVM within typical large molecule workstreams can provide supportive techniques while also enabling a truly unique assessment of in vivo drug behavior.
Conclusion
IVM offers a solution to questions that cannot be answered with other techniques or at similar workloads. It can be used to better understand the dynamics of tissue deposition, either off or on target. For example, past work utilized IVM to measure the tumor extravasation of bispecific T-cell engagers.34 Furthermore, other pharmacokinetic aspects like metabolism can be evaluated in vivo at unparalleled resolutions and timeframes. One such use could be extending our FRET-based strategy to examine the protein/peptide metabolism within other tissues, such as the skin. IVM enables an exclusive ability to study real-time dynamics that will only further our understanding of drug metabolism and disposition.
Acknowledgments
Funding for this project was provided by the Center for Protein Therapeutics (University at Buffalo, M.E.M.) and by grants from the National Institutes of Health, NIH P30DK079312-13 (B.A.M.) and 1R01DK091623-06 (B.A.M.). We thank Alana Tedmon for generating Figure 7.
Supporting Information Available
The Supporting Information is available free of charge at https://pubs.acs.org/doi/10.1021/acs.molpharmaceut.2c00671.
Author Present Address
∇ Department of Pharmacokinetics and Drug Metabolism, Amgen Inc., 750 Gateway Blvd. Suite 100, South San Francisco, CA, 94080, USA
Author Contributions
# M.A.B. and R.M.S. contributed equally to this work.
The authors declare no competing financial interest.
Supplementary Material
References
- Carone F. A.; Peterson D. R.; Oparil S.; Pullman T. N. Renal tubular transport and catabolism of proteins and peptides. Kidney Int. 1979, 16, 271–278. 10.1038/ki.1979.129. [DOI] [PubMed] [Google Scholar]
- Dickson L. E.; Wagner M. C.; Sandoval R. M.; Molitoris B. A. The proximal tubule and albuminuria: really!. J. Am. Soc. Nephrol 2014, 25, 443–453. 10.1681/ASN.2013090950. [DOI] [PMC free article] [PubMed] [Google Scholar]
- Christensen E. I.; Birn H. Megalin and cubilin: multifunctional endocytic receptors. Nat. Rev. Mol. Cell. Biol. 2002, 3, 258–267. 10.1038/nrm778. [DOI] [PubMed] [Google Scholar]
- Dunn K. W.; Molitoris B. A.; Dagher P. C. The Indiana O’Brien Center for Advanced Renal Microscopic Analysis. Am. J. Physiol Renal Physiol 2021, 320, F671–F682. 10.1152/ajprenal.00007.2021. [DOI] [PMC free article] [PubMed] [Google Scholar]
- Sandoval R. M.; Molitoris B. A. Quantifying endocytosis in vivo using intravital two-photon microscopy. Methods Mol. Biol. 2008, 440, 389–402. 10.1007/978-1-59745-178-9_28. [DOI] [PubMed] [Google Scholar]
- Sandoval R. M.; Molitoris B. A. Intravital multiphoton microscopy as a tool for studying renal physiology and pathophysiology. Methods 2017, 128, 20–32. 10.1016/j.ymeth.2017.07.014. [DOI] [PMC free article] [PubMed] [Google Scholar]
- Copley K.; et al. Investigation of exenatide elimination and its in vivo and in vitro degradation. Current drug metabolism 2006, 7, 367–374. 10.2174/138920006776873490. [DOI] [PubMed] [Google Scholar]
- Cirincione B.; Mager D. E. Population pharmacokinetics of exenatide. Br. J. Clin. Pharmacol. 2017, 83, 517–526. 10.1111/bcp.13135. [DOI] [PMC free article] [PubMed] [Google Scholar]
- Jares-Erijman E. A.; Jovin T. M. FRET imaging. Nat. Biotechnol. 2003, 21, 1387. 10.1038/nbt896. [DOI] [PubMed] [Google Scholar]
- Cole J. A.; Forte L. R.; Krause W. J.; Thorne P. K. Clonal sublines that are morphologically and functionally distinct from parental OK cells. Am. J. Physiol. 1989, 256, F672–679. 10.1152/ajprenal.1989.256.4.F672. [DOI] [PubMed] [Google Scholar]
- Bryniarski M. A.; Yee B. M.; Jaffri I.; Chaves L. D.; Yu J. A.; Guan X.; Ghavam N.; Yacoub R.; Morris M. E.; et al. Increased Megalin Expression in Early Type 2 Diabetes: Role of Insulin Signaling Pathways. Am. J. Physiol. Renal Physiol. 2018, 315, F1191–F1207. 10.1152/ajprenal.00210.2018. [DOI] [PubMed] [Google Scholar]
- Bryniarski M. A.; et al. Immunoglobulin G Is a Novel Substrate for the Endocytic Protein Megalin. AAPS journal 2021, 23, 40. 10.1208/s12248-021-00557-1. [DOI] [PubMed] [Google Scholar]
- Bryniarski M. A.; et al. Megalin-mediated albumin endocytosis in cultured murine mesangial cells. Biochemical and biophysical research communications 2020, 529, 740–746. 10.1016/j.bbrc.2020.05.166. [DOI] [PubMed] [Google Scholar]
- Nagai M.; Meerloo T.; Takeda T.; Farquhar M. G. The adaptor protein ARH escorts megalin to and through endosomes. Mol. Biol. Cell 2003, 14, 4984–4996. 10.1091/mbc.e03-06-0385. [DOI] [PMC free article] [PubMed] [Google Scholar]
- Sandoval R. M.; et al. Multiple factors influence glomerular albumin permeability in rats. J. Am. Soc. Nephrol 2012, 23, 447–457. 10.1681/ASN.2011070666. [DOI] [PMC free article] [PubMed] [Google Scholar]
- Wagner M. C.; et al. Mechanism of increased clearance of glycated albumin by proximal tubule cells. Am. J. Physiol Renal Physiol 2016, 310, F1089–1102. 10.1152/ajprenal.00605.2015. [DOI] [PMC free article] [PubMed] [Google Scholar]
- Sandoval R. M.; Molitoris B. A. In Advances in Intravital Microscopy: From Basic to Clinical Research; Weigert R., Ed.; Springer: Netherlands, 2014; pp 205–219. [Google Scholar]
- Dunn K. W.; Sutton T. A.; Sandoval R. M. Live-animal imaging of renal function by multiphoton microscopy. Curr. Protoc. Cytom. 2012, 62, 12.9.1–12.9.18. 10.1002/0471142956.cy1209s62. [DOI] [PMC free article] [PubMed] [Google Scholar]
- Vegt E.; et al. Renal uptake of different radiolabelled peptides is mediated by megalin: SPECT and biodistribution studies in megalin-deficient mice. Eur. J. Nucl. Med. Mol. Imaging 2011, 38, 623–632. 10.1007/s00259-010-1685-9. [DOI] [PMC free article] [PubMed] [Google Scholar]
- Polesel M.; et al. Spatiotemporal organisation of protein processing in the kidney. Nat. Commun. 2022, 13, 5732. 10.1038/s41467-022-33469-5. [DOI] [PMC free article] [PubMed] [Google Scholar]
- Carone F. A. Renal handling of proteins and peptides. Ann. Clin. Lab. Sci. 1978, 8, 287–294. [PubMed] [Google Scholar]
- George S. G.; Kenny J. Studies on the enzymology of purified preparations of brush border from rabbit kidney. Biochemical journal 1973, 134, 43–57. 10.1042/bj1340043. [DOI] [PMC free article] [PubMed] [Google Scholar]
- Berger S. J.; Sacktor B. Isolation and biochemical characterization of brush borders from rabbit kidney. J. Cell Biol. 1970, 47, 637–645. 10.1083/jcb.47.3.637. [DOI] [PMC free article] [PubMed] [Google Scholar]
- Wilfong R. F.; Neville D. M. Jr. The isolation of a brush border membrane fraction from rat kidney. J. Biol. Chem. 1970, 245, 6106–6112. 10.1016/S0021-9258(18)62669-9. [DOI] [PubMed] [Google Scholar]
- Hjelle J. T.; Morin J. P.; Trouet A. Analytical cell fractionation of isolated rabbit renal proximal tubules. Kidney Int. 1981, 20, 71–77. 10.1038/ki.1981.106. [DOI] [PubMed] [Google Scholar]
- Walmsley S. J.; Broeckling C.; Hess A.; Prenni J.; Curthoys N. P. Proteomic analysis of brush-border membrane vesicles isolated from purified proximal convoluted tubules. Am. J. Physiol Renal Physiol 2010, 298, F1323–1331. 10.1152/ajprenal.00711.2009. [DOI] [PMC free article] [PubMed] [Google Scholar]
- Spater H. W.; Poruchynsky M. S.; Quintana N.; Inoue M.; Novikoff A. B. Immunocytochemical localization of gamma-glutamyltransferase in rat kidney with protein A-horseradish peroxidase. Proc. Natl. Acad. Sci. U.S.A. 1982, 79, 3547–3550. 10.1073/pnas.79.11.3547. [DOI] [PMC free article] [PubMed] [Google Scholar]
- Carone F. A.; Peterson D. R.; Flouret G. Renal tubular processing of small peptide hormones. J. Lab. Clin. Med. 1982, 100, 1–14. [PubMed] [Google Scholar]
- Dorup J.; Maunsbach A. B. Three-dimensional organization and segmental ultrastructure of rat proximal tubules. Exp. Nephrol. 1997, 5, 305–317. [PubMed] [Google Scholar]
- Maunsbach A. B.; Christensen E. I. Comprehensive Physiology 1992, 41–107. 10.1002/cphy.cp080102. [DOI] [Google Scholar]
- Wagner M. C.; et al. Proximal Tubules Have the Capacity to Regulate Uptake of Albumin. J. Am. Soc. Nephrol 2016, 27, 482–494. 10.1681/ASN.2014111107. [DOI] [PMC free article] [PubMed] [Google Scholar]
- Gauthier C.; Nguyen-Simonnet H.; Vincent C.; Revillard J. P.; Pellet M. V. Renal tubular absorption of beta 2 microglobulin. Kidney Int. 1984, 26, 170–175. 10.1038/ki.1984.151. [DOI] [PubMed] [Google Scholar]
- Conner K. P.; et al. Evaluation of near infrared fluorescent labeling of monoclonal antibodies as a tool for tissue distribution. Drug metabolism and disposition: the biological fate of chemicals 2014, 42, 1906–1913. 10.1124/dmd.114.060319. [DOI] [PMC free article] [PubMed] [Google Scholar]
- You R.; et al. Visualizing Spatial and Stoichiometric Barriers to Bispecific T-Cell Engager Efficacy. Cancer Immunol Res. 2022, 10, 698–712. 10.1158/2326-6066.CIR-21-0594. [DOI] [PMC free article] [PubMed] [Google Scholar]
Associated Data
This section collects any data citations, data availability statements, or supplementary materials included in this article.


