

Abstract
Background
Minimally invasive skin sampling is used in various fields. In this study, we examined whether it was possible to obtain skin specimens using biocompatible microneedles composed of sodium hyaluronate and performed transcriptome analysis.
Materials and methods
Thirty‐three subjects with different skin conditions, such as skin aging, skin hydration, skin pigmentation, oily skin and sensitive skin, were recruited. Skin types were evaluated based on age, non‐invasive measurement devices, 10% lactic acid stinging test and visual assessment; the skin specimens were sampled from the face using microneedles. Total RNA was extracted, and microarray was performed. Correlations between various biomarkers and skin condition parameters were analysed.
Results
Several skin‐type biomarkers are correlated with age, non‐invasive device measurements, LAST score and visual assessment of acne lesions. Representatively, COL1A1 (Collagen type 1 alpha 1 chain), FN1 (Fibronectin 1) and PINK1 (PTEN‐induced putative kinase protein 1) for skin aging, FLG (Filaggrin), KLF4 (Kruppel‐like factor 4) and LOR (Loricrin) for skin hydration, GPNMB (Glycoprotein non‐metastatic melanoma protein B), MLANA (Melan‐A) and TYR (Tyrosinase) for skin pigmentation, IGF1 ( insulin‐like growth factor‐1), MPZL3 (Myelin protein zero like 3) and AQP3 (Aquaporin 3) for oily skin and PGF (placental growth factor), CYR61 (cysteine‐rich angiogenic inducer 61), RBP4 (retinol‐binding protein 4), TAC1 (Tachykinin precursor 1), CAMP (Cathelicidin antimicrobial peptide), MMP9 (Matrix metallopeptidase 9), MMP3 , MMP12 and CCR1 (C‐C motif chemokine receptor 1) for sensitive skin.
Conclusion
Microneedle skin sampling is a new and minimally invasive option for transcriptome analysis of human skin and can be applied for diagnosis and treatment efficacy evaluation, as well as skin type classification.
Keywords: biomarker, microneedle, RNA, skin sampling, skin type, transcriptomics
1. INTRODUCTION
Classifying skin types is important for people who desire to have or maintain healthy skin. In 1975, Fitzpatrick developed the Fitzpatrick scale, a phototype classification of human skin colour, 1 which describes skin types using six scales according to the response of skin to ultraviolet light. In 2004, Baumann developed the Baumann skin type, defining 16 skin types using a series of questionnaires 2 for four categories: wrinkled versus tight, oily versus dry, pigmented versus non‐pigmented and sensitive versus resistant. Choosing a response for each category could result in 16 different skin types. However, these skin typing methods are limited by their lack of objectivity, and thus non‐invasive devices are used for more objective classification. Based on biomechanical principles, these devices provide quantifiable results and are mainly used to evaluate skin conditions, 3 , 4 , 5 efficacy of natural ingredients, cosmetics and treatments. 6 , 7
For molecular analysis using DNA, RNA and proteins, skin specimens should be collected. Biopsy is an established method for studying the molecular biology of the skin in vivo, but it is invasive and has limited applicability in research because it has a low degree of compliance and requires a specialist to perform the procedure. To address this issue, we utilized a microneedle as a minimally invasive tissue collection method to replace skin biopsy. The concept of microbiopsy using microneedles has been proposed previously and is performed using various types of microneedles for molecular analysis of the skin. 8 , 9 , 10
In this study, we developed a method for obtaining a skin specimen containing RNAs using a sodium hyaluronate‐based microneedle patch. Microneedles were first designed to deliver drugs into the dermis to overcome the disadvantages of injection needles, 11 but it was revealed that skin samples can also be extracted. Using microneedles that enter the dermal layer of the skin, RNA was extracted directly from the skin and used for transcriptome analysis.
Skin types were categorized based on age (elderly vs. young), hydration (dry vs. moist), pigmentation (pigmented vs. non‐pigmented), oiliness (oily vs. non‐oily) and sensitivity (stinging‐ or rosacea‐ or acne‐type sensitive vs. control). Subjects with each condition were selected to analyse their gene expression. We also conducted a correlation analysis between candidate gene expression and skin condition indicators and identified significant biomarkers by skin type; skin aging (Collagen type 1 alpha 1 [COL1A1], Fibronectin 1 [FN1], PTEN‐induced putative kinase protein 1 [PINK1], etc.), skin hydration (Filaggrin [FLG], Kruppel‐like factor 4 [KLF4], Loricrin [LOR], etc.), skin pigmentation (Glycoprotein non‐metastatic melanoma protein B [GPNMB], Melan‐A [MLANA], Tyrosinase [TYR], etc.), oily skin (insulin‐like growth factor‐1 [IGF1], Myelin protein zero like 3 [MPZL3], Aquaporin 3 [AQP3], etc.) and sensitive skin (Placental growth factor [PGF], Cystein‐rich angiogenic inducer 61 [CYR61], Retinol‐binding protein 4 [RBP4], Tachykinin precursor 1 [TAC1], Cathelicidin antimicrobial peptide [CAMP], Matrix metallopeptidase [MMP9], MMP3, MMP12, C‐C motif chemokine receptro 1 [CCR1], etc.).
2. MATERIALS AND METHODS
2.1. Subjects
This study was reviewed and approved by the Raphas Institutional Review Board (RPHS‐20312‐001). Thirty‐three volunteers were selected based on the inclusion and exclusion criteria, and written informed consent was obtained from each subject. After facial cleaning, the subjects were acclimatized for 30 min in the examination room, which was maintained at 22 ± 2°C with a relative humidity of 40%−60% before performing the following procedures.
2.2. Clinical assessment
Visual assessment was performed to identify the acne type sensitive skin. Subjects with acne lesions such as papules, pustules, comedones and cysts were categorised as having acne‐type sensitive skin after evaluation by a dermatologist.
2.3. Non‐invasive devices
In this study, nine different non‐invasive devices were used to evaluate the skin type. Mark‐vu (PSI Plus, Gyeonggi‐do, Korea), an LED (Light emitting diode)‐sourced facial skin analyser, was used to take pictures of the face to show a specific feature of the skin. Skin wrinkles were measured as the average roughness parameter (Ra) using PRIMOSCR (Canfield Scientific, Parsippany, NJ, USA), a high‐resolution 3D‐imaging tool. The average value after measurement on both sides of the crow's feet was used. Cutometer® MPA 580 (Courage and Khazaka Electronic GmbH, Cologne, Germany) is a tool based on the suction method and was used to measure skin elasticity. Among the valuable parameters, we chose the parameter R2, which calculates gross skin elasticity based on the resistance to mechanical force versus the ability to recover. The measurement site was on both sides of the cheeks, and the average value was used.
Corneometer® CM 825 (Courage and Khazaka Electronic GmbH) was used to determine the hydration level of the skin surface at a depth of 10−20 μm in the stratum corneum. A Tewameter® TM 300 (Courage and Khazaka Electronic GmbH) was used to evaluate transepidermal water loss (TEWL), which indicates the skin barrier function. A high TEWL value indicates damage to the skin barrier function. The Skin‐pH‐Meter® PH 905 (Courage and Khazaka Electronic GmbH) was used to measure the pH of the skin surface. Measurements were conducted on both sides of the cheeks, and the average value was used.
A Mexameter® MX 18 (Courage and Khazaka Electronic GmbH) was used to evaluate melanin and erythema. This instrument emits three specific light wavelengths: 568, 660 and 880 nm. The receiver measures the light reflected by the skin. The results are in the form of the melanin index or erythema index and range from 0 to 999. The measurement site was on the upper cheeks near the eye on both sides, and the average value was used.
Spectrophotometer CM‐700d (Konica Minolta, Tokyo, Japan) was used to determine the colour of the objects by measuring the intensity of light reflected by the objects. The results are shown as CIE L*, a* and b*. The a* value, which represents the range from red to green, was used to identify erythema. A higher a* value indicates that the colour of the object is closer to red. The individual typology angle (ITA°) was calculated using the equation ITA° = (ATAN [L* ‐ 50]/b*) × 180/3.14159. 12 A higher ITA° value indicates a lighter skin colour. The measurement site was on both sides of the upper cheeks, and the average value was used.
A Sebumeter® SM 815 (Courage and Khazaka Electronic GmbH) was used to evaluate the sebum level on the skin surface based on photometry. In this procedure, an opaque tape is brought into contact with the measuring site, and its transparency increases with increased sebum. Next, the transparency of the tape is measured, and the light transmission indicates the sebum content. The measurement site was on both sides of the nostrils, and the average value was used.
2.4. Lactic acid stinging test
A lactic acid stinging test (LAST) was performed as previously described with slight modifications. 13 A cotton swab soaked with 10% lactic acid solution was rubbed on the left side of the nasolabial fold, whereas a cotton swab soaked with saline solution was rubbed on the right side of the nasolabial fold. Subjects were asked to describe the intensity of the sensation as stinging, itching or burning using a 4‐point scale (none = 0, slight = 1, moderate = 2 and severe = 3) at 0, 2.5, 5 and 8 min after application of the cotton swabs. The score was calculated using the following equation: score = (sum of lactic acid score – sum of saline solution score)/12.
2.5. Fabrication of microneedle patch
The biocompatible microneedle patches were fabricated by the droplet‐extension (DEN) method (previously known as droplet‐born air blowing) as described by Kim et al. 14 A viscous solution of sodium hyaluronate was prepared. Precisely controlled droplets were placed on a hydrocolloid sheet using a solution dispenser, and the dispensed viscous droplets on the lower sheet came into contact with the upper sheet and became elongated. The viscous‐elongated material was solidified by exposure to air for sufficient time at room temperature. Finally, a separation of the upper and the lower sheet was performed. These steps were repeated to produce multiple microneedle patches via DEN.
2.6. Total RNA extraction and transcriptome analysis
Both the microneedle patch and tape stripping methods were performed to extract facial ribonucleic acid (RNA). For the tape stripping methods, we referred to the method of Dyjack et al. 15 D‐Squame® tape strips (CuDerm, Dallas, TX, USA) were applied to the cheek, and tape strips 11−20 were used to isolate the RNA among a total of 20 consecutive collections. The samples on the surfaces of the microneedle patch and tape strips were scraped using RLT buffer from the RNeasy mini kit (QIAGEN, Hilden, Germany). The remaining steps of the procedure were performed according to the manufacturer's instructions. The total RNA concentration and A260/A280 ratio were measured spectrophotometrically using a NanoDrop™ (Thermo Fisher Scientific, Waltham, MA, USA).
For transcriptome analysis using microneedles, total RNA was extracted as described above, amplified using the GeneChip™ WT Pico Kit (Applied Biosystems, Foster City, CA, USA) and hybridized to the GeneChip® Human Gene 2.0 ST Array (Affymetrix, Santa Clara, CA, USA) according to the manufacturer's instructions. The data were summarized and normalized using the robust multi‐average method implemented in Affymetrix® Power Tools. We exported the results of gene‐level robust multi‐average analysis and performed differentially expressed gene analysis.
Statistical significance of the expression data was determined using an independent t‐test and fold‐change, in which the null hypothesis was that no difference exists among the groups. The false discovery rate was controlled by adjusting the p‐value using the Benjamini–Hochberg algorithm. For a differentially expressed gene set, hierarchical cluster analysis was performed using complete linkage and Euclidean distance as measures of similarity. All data analysis and visualization of differentially expressed genes were conducted using Rstudio version 3.6.1 (Rstudio Inc., Boston, Massachusetts).
2.7. Statistical analysis
Statistical analysis was conducted using GraphPad Prism (version 5.02; San Diego, CA, USA). Correlations were determined by calculating Pearson's correlation coefficient. Statistical significance was set at p < 0.05.
3. RESULTS
3.1. Successful extractions of skin RNA using microneedles
Sodium hyaluronate‐based microneedle patches were fabricated using the DEN method for skin sampling. One microneedle patch measured 2.5 × 5.5 cm and consisted of 160 arrays of single microneedles (Figure 1A). A single microneedle length was approximately 650 μm, which was sufficient to penetrate the upper dermis (Figure 1B). Both tape stripping and microneedles could collect samples from the skin (Figure 1C).
FIGURE 1.
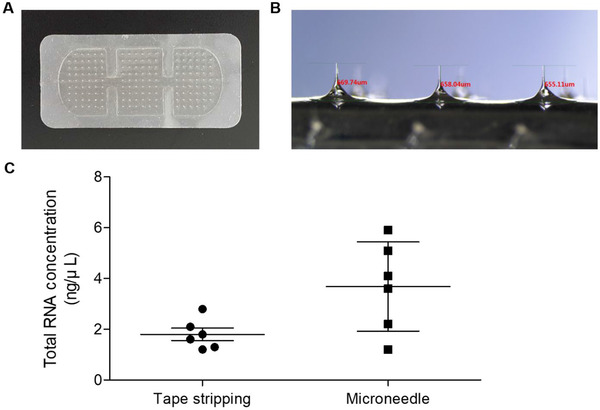
Sodium hyaluronate‐based microneedles and comparison of the method for total RNA extraction. (A) Image of sodium hyaluronate‐based microneedle patch fabricated by droplet‐extension (DEN) method. (B) Magnified image of microneedles with averaged length of 650 μm. (C) Total RNA concentration of RNA extracted by tape stripping method and microneedles
To optimize the application time of the microneedle patch, it was applied for 10, 20 and 40 min each (Figure 2A), and then total RNA was extracted. The total RNA concentration was highest at 20 min, but the average A260/A280 ratio was 2.66, suggesting the presence of impurities. At 10 min, the average A260/A280 ratio was 1.91, in the range of 1.8–2.0, which indicates good purity of RNA 16 , 17 , 18 ; therefore, 10 min was used as the application time for further experiments (Figure 2B).
FIGURE 2.
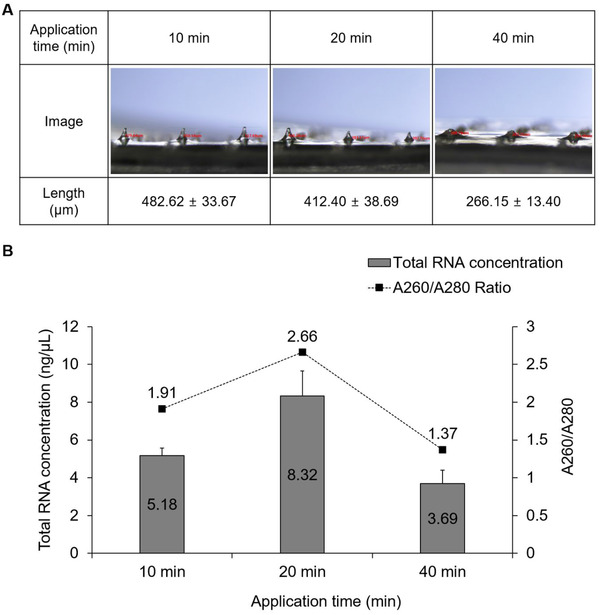
Comparisons of RNA quantity and purity by application time. (A) Changes in microneedle length and (B) quantity and purity of total RNA obtained according to application time
3.2. Biomarker analysis using skin RNA obtained from minimally invasive microneedles
A total of 33 subjects (male: 19, female: 14, average age: 36.91 ± 12.94 years) participated in this study (Figure S1A). All subjects voluntarily signed the consent form and followed the procedures described in Figure S1B. Depending on the skin type category, the subjects were categorized into the test or control group. For objective classification by skin type, the subjects were classified according to age, appropriate non‐invasive device measurement values, LAST score or visual assessment of acne lesions.
RNA microarray was performed using the isolated skin total RNA, and hierarchical clustering heat map images of differentially expressed genes were used to reveal the patterns between the test and control groups. We selected the genes according to the following statistical threshold: (1) fold change: |FC| > 1.5 and (2) p‐value: p < 0.05. Further selection parameters were chosen based on previous literature to confirm the association between the selected genes and the skin type. The candidate genes selected for heat map analysis were the ones that demonstrated statistically significant differences and/or genes that were closely related to the skin types in the literature.
3.2.1. Elderly versus young
Selected subjects’ information is listed in Figure 3A for elderly versus young analysis. The test and control groups were classified according to age and skin roughness (PRIMOS, Ra), and skin elasticity (Cutometer, R2) values were also considered. The hierarchical clustering heat map of the test and control groups is presented in Figure 3B. Next, we drew heat maps with selected skin elasticity/wrinkle‐related genes (Figure 3C) and skin hydration/barrier‐related genes (Figure 3D) because skin elasticity, skin wrinkles, skin hydration and skin barrier function are closely related to age. 19 Additionally, heat map analysis of the specimens from subjects in their 50s, 40s, 30s and 20s was also performed (Figure S2A,B).
FIGURE 3.
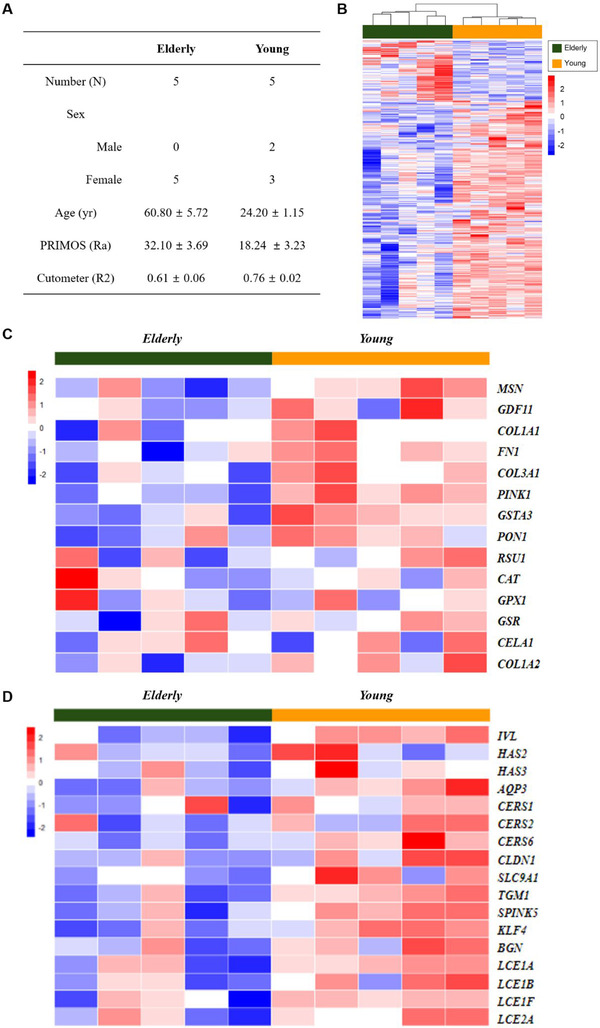
Analysis of skin aging with microarray. (A) Subjects’ information. (B) Hierarchical clustering heat map of test (elderly) and control (young) groups. (C) Heat map with selected skin elasticity/wrinkle‐related genes. (D) Heat map with selected skin hydration/barrier‐related genes
3.2.2. Dry versus moist
Selected subjects’ information is listed in Figure 4A for dry versus moist analysis. The test and control groups were classified according to the hydration content (Corneometer, A.U.), TEWL (Tewameter, g/h/m2) and skin pH (Skin‐pH‐meter, pH) values. The hierarchical clustering heat map of the test and control groups is presented in Figure 4B. Next, we drew heat maps with selected skin hydration/barrier‐related genes (Figure 4C). Additionally, heat map analysis along with the values of Corneometer, Tewameter and Skin‐pH‐meter, respectively, are presented in Figure S3A–C.
FIGURE 4.
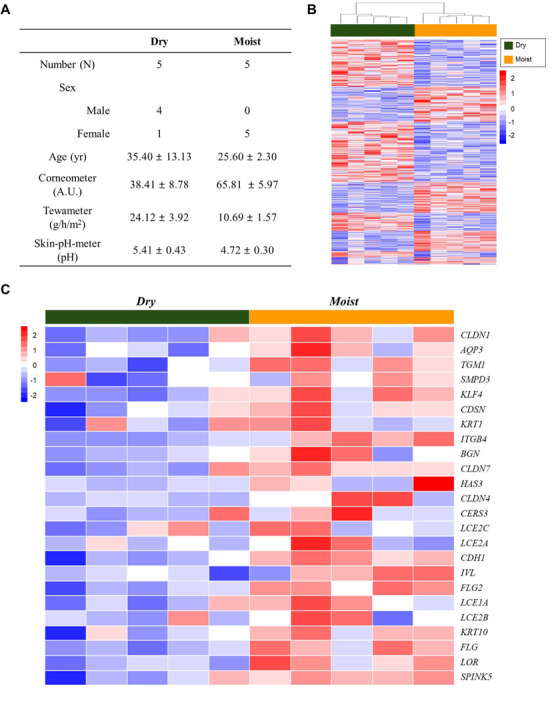
Analysis of skin hydration with microarray. (A) Subjects’ information. (B) Hierarchical clustering heat map of test (dry) and control (moist) groups. (C) Heat map with selected skin hydration/barrier‐related genes
3.2.3. Pigmented versus non‐pigmented
Selected subjects’ information is listed in Figure 5A for pigmented versus non‐pigmented analysis. The test and control groups were classified according to skin colour (Spectrophotometer, ITA°), and the melanin index (Mexameter) was considered. The hierarchical clustering heat map of the test and control groups is presented in Figure 5B. Next, we drew a heat map with selected skin pigmentation‐related genes (Figure 5C). Additional heat map analysis was performed according to skin colour typing using ITA° as follows: Light, ITA° > 41°; Intermediate, 28° < ITA° < 41°; Tanned, ITA° < 28° (Figure S4).
FIGURE 5.
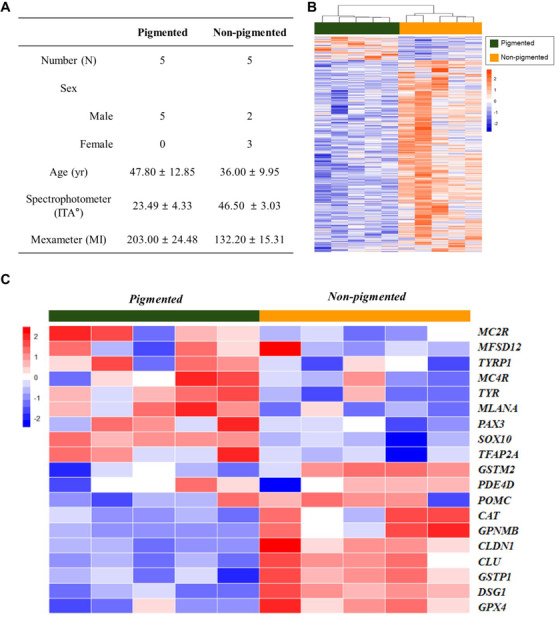
Analysis of skin pigmentation with microarray. (A) Subjects’ information. (B) Hierarchical clustering heat map of test (pigmented) and control (non‐pigmented) groups. (C) Heat map with selected skin pigmentation‐related genes
3.2.4. Oily versus non‐oily
Selected subjects’ information is listed in Figure 6A for oily versus non‐oily analysis. The test and control groups were classified according to sebum levels (Sebumeter, μg/cm2). The hierarchical clustering heat map of the test and control groups is presented in Figure 6B. Next, we drew a heat map that included selected sebum synthesis/secretion‐related genes (Figure 6C).
FIGURE 6.
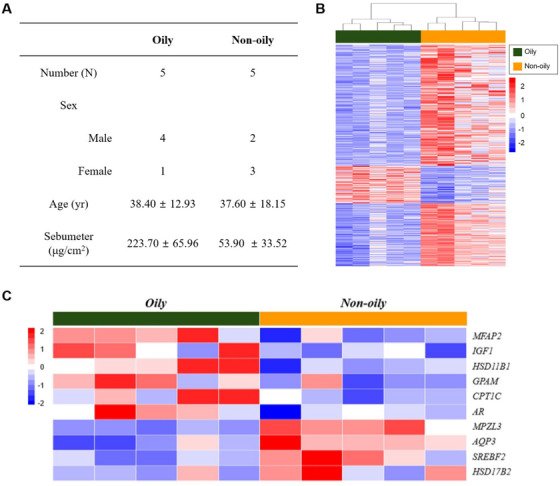
Analysis of oily skin with microarray. (A) Subjects’ information. (B) Hierarchical clustering heat map of test (oily) and control (non‐oily) groups. (C) Heat map with selected sebum synthesis/secretion‐related genes
3.2.5. Stinging versus control
Selected subjects’ information is listed in Figure S5A for stinging versus control analysis. The test and control groups were classified according to the 10% LAST score. The hierarchical clustering heat map of the test and control groups is presented in Figure S5B. We also drew a heat map with selected stinging type sensitive skin‐related genes (Figure S5C).
3.2.6. Rosacea versus control
Selected subjects’ information is listed in Figure S6A for rosacea versus control analysis. The test and control groups were classified according to the erythema index (Mexameter) and redness value (Spectrophotometer, a* value). The hierarchical clustering heat map of the test and control groups is presented in Figure S6B. Next, we drew a heat map with selected rosacea‐type sensitive skin‐related genes (Figure S6C).
3.2.7. Acne versus control
Photographs of the acne lesions and control site are presented in Figure S7A. Selected subjects’ information is listed in Figure S7B for acne versus control analysis. The test and control groups were classified based on visual assessment. The hierarchical clustering heat map of the test and control groups is presented in Figure S7C. Next, we drew a heat map with selected acne‐type sensitive skin‐related genes (Figure S7D).
3.3. Correlations between RNA biomarkers and non‐invasive devices measurements
mRNA expression levels of the biomarkers were correlated with the age, non‐invasive measurement device values, LAST scores and visual assessment results. Detailed correlation data including the p‐value are summarized in Table S1.
The biomarkers whose expression was negatively correlated to age were FN1, GSTA3, PINK1, IVL, CERS6, SPINK5 and KLF4. The biomarkers showing a negative correlation with skin roughness were COL1A1, FN1, PINK1 (Figure 7A–C), COL3A1, GSTA3, PON1, IVL, HAS2 and HAS3. Using the Cutometer measurements, PINK1, IVL, TGM1, SPINK5 and KLF4 were found to be positively correlated with skin elasticity.
FIGURE 7.
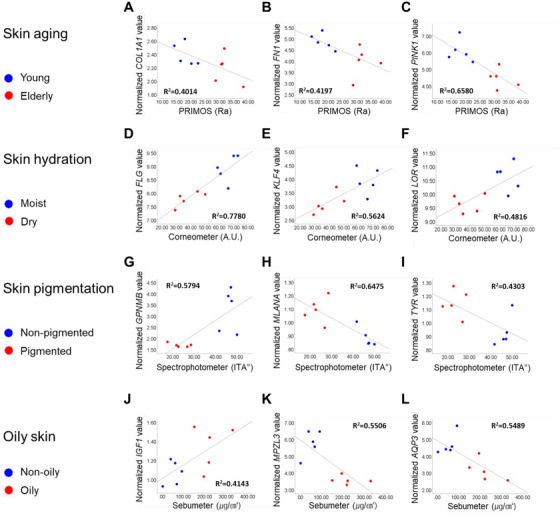
Correlations between normalized mRNA values and non‐invasive device measurements. Correlations of skin roughness (PRIMOS, Ra) with (A) COL1A1 (Collagen type 1 alpha 1 chain), (B) FN1 (Fibronectin 1) and (C) PINK1 (PTEN‐induced putative kinase protein 1). Correlations of hydration content (Corneometer, A.U.) with (D) FLG (Filaggrin), (E) KLF4 (Kruppel‐like factor 4) and (F) LOR (Loricrin). Correlations of skin colour (Spectrophotometer, ITA°) with (G) GPNMB (Glycoprotein non‐metastatic melanoma protein B), (H) MLANA (Melan‐A) and (I) TYR (Tyrosinase). Correlations of sebum levels (Sebumeter, μg/cm2) with (J) IGF1 (Insulin‐like growth factor‐1), (K) MPZL3 (Myelin protein zero like 3) and (L) AQP3 (Aquaporin 3).
In skin hydration analysis, FLG, KLF4, LOR (Figure 7D–F), CDH1, FLG2, ITGB4, SPINK5, TGM1, CLDN7 and CLDN4 were positively correlated with hydration content. KLF4, LOR, FLG, KRT10, LCE1A, CDH1, FLG2, ITGB4, SPINK5, CLDN1, BGN, TGM1 and CLDN7 were negatively correlated with the TEWL values. CDSN, KLF4, CDH1, CLDN1, AQP3 and CLDN7 were found to be negatively correlated with the skin pH values.
For skin pigmentation, GPNMB (Figure 7G), CAT, CLDN1, CLU, DSG1, GPX4, GSTM2 and GSTP1 were positively correlated, and MLANA, TYR (Figure 7H,I), SOX10, TFAP2A and TYRP1 were negatively correlated with the ITA° values. CAT, CLDN1, CLU, DSG1, GPNMB, GPX4, GSTM2 and GSTP1 were negatively correlated with the melanin index, and MLANA, PAX3 and SOX10 were positively correlated.
For oily skin, IGF1 (Figure 7J), MFAP2 and GPAM were positively correlated, and MPZL3 and AQP3 were negatively correlated with the sebum levels (Figure 7K,L).
For sensitive skin, the biomarkers showing a positive correlation between LAST score and gene expression were PGF and CYR61, whereas RBP4 was negatively correlated (Figure S8A–C). Positive correlations were observed between the erythema index and gene expression levels in TAC1, CAMP and MMP9 (Figure S8D–F). TAC1, MMP9 and ANGPT2 were positively correlated with the spectrophotometer a* values. The biomarkers MMP3, MMP12, CCR1 (Figure S8G–I), THY1 and IL6 were positively correlated with visual assessment of acne lesions.
Based on these results, we figured out the RNA biomarkers that have a correlation with age, non‐invasive device measurements, LAST score or visual assessment, and they are useful for distinguishing the skin type.
4. DISCUSSION
For molecular diagnosis and disease treatment monitoring, specimens such as blood, tissues, or body fluids are obtained from the human body. The existing biopsy method, particularly for the skin, is abrasive, painful and stressful for patients. To overcome these problems, micro‐unit skin sampling methods were devised. 20 Among these, we focused on microneedles. In many studies, skin samples, such as interstitial fluids, cells, blood and nucleic acids, have been successfully extracted using different types of microneedles. 8 , 21 , 22 , 23 , 24
We used sodium hyaluronate as a component of the microneedle because it is biocompatible 25 and safe, as no sharpened part is left behind after use. Repeated collection of skin specimens at the same site, even at the facial skin, is possible, improving compliance. Using microneedles fabricated with the DEN method, we obtained skin specimens and performed skin transcriptomic profiling to confirm the difference according to the skin conditions. Next, referring to previous studies, 4 , 26 we tried to confirm the correlation analysis between transcriptomic biomarker expression levels and other parameters.
Skin type classification through methods such as non‐invasive device measurements, LAST and visual evaluation reflects the phenotype. To determine suitable mRNA (messenger RNA) biomarker candidates for the skin type, it is imperative to not only take statistical differences into account but also consider whether there is a genuine correlation between the genotype and the phenotype. Therefore, genes that were considered important for skin type and whose normalized mRNA levels correlated with age, non‐invasive device measurements, LAST scores or visual evaluation of acne lesions were the ones considered as the candidate biomarkers.
During skin aging, progressive loss and fragmentation of dermal collagen fibrils occur, resulting in thin and structurally weakened skin. 27 COL1A1, which encodes type 1 collagen, is a well‐known biomarker of skin aging. COL1A1 expression is decreased in elderly donor fibroblasts 28 and in biopsies of males aged 30−45 years. 29 FN1, which encodes fibronectin, is also decreased by aging. Comparison of skin biopsies from patients in their 30s and 60s showed decreased and fragmented fibronectin in the latter group. 30 In addition, fibroblasts undergoing senescence express low levels of FN1. 31 PTEN‐induced putative kinase protein 1 (PINK1) encodes a mitochondrial‐targeted serine/threonine kinase. PINK1 deficiency is associated with mitochondrial dysfunction and increased oxidative cellular stress and is related to aging and aging‐related diseases. 32 Our results show that PINK1 expression is correlated with age, skin roughness and skin elasticity. Therefore, PINK1 may be related to skin aging.
Skin hydration is closely related to skin barrier function, and filaggrin is the most well‐known factor involved in skin barrier integrity. 33 In this study, we confirmed that FLG expression was positively correlated with the hydration level of the stratum corneum and negatively correlated with TEWL. KLF4 encodes Kruppel‐like factor 4, which is highly expressed in the differentiating layers of the epidermis and is an essential factor for establishing the barrier function. 34 According to our results, KLF4 mRNA expression was correlated with Corneometer, Tewameter and Skin‐pH‐meter values. LOR is a major protein of the epidermal cornified cell envelope, a structure formed beneath the cell membrane during the terminal differentiation of keratinocytes. The expression of LOR is decreased in patients with atopic dermatitis 35 and psoriasis. Lor (‐/‐) mice showed abnormal skin barrier functions. 36
Skin colour is closely related to the melanin content and distribution. 37 MLANA encodes melanoma antigen recognized by T cells (MART‐1), which is essential for structural maturation of melanosomes, particularly in the early stages. MART‐1 expression patterns and subcellular distribution are typically correlated with the melanin content. 38 GPNMB is involved in the late stage of melanosome maturation and contributes to melanocyte/keratinocyte adhesion. 39 In vitiligo lesional skin, GPNMB is absent, suggesting its role in pigmentation. 40 TYR is a tyrosinase‐encoding gene; tyrosinase plays a key role in melanin synthesis, 41 and various inhibitors targeting tyrosinase are used as skin whitening agents. 42 In this study, MLANA, GPNMB and TYR showed positive correlations with the ITA° values.
Oily skin is occasionally considered as a problem because excessive amounts of sebum can block pores and cause bacteria growth. 43 Insulin‐like growth factor‐1 (IGF‐1) regulates sebaceous gland lipogenesis in the skin. 44 The relationship between the serum levels of IGF‐1 and facial pores or sebum levels has been studied. 45 , 46 MPZL3 is a myelin protein zero‐like 3 coding gene. The relationship between seborrheic dermatitis and decreased adipose tissue has been studied in Mpzl3 (‐/‐) mice. 47 , 48 AQP3, which is involved in water transport, may also be related to sebaceous differentiation. 49 According to our results, both MPZL3 and AQP3 expression levels were negatively correlated with sebum levels obtained using the Sebumeter.
Sensitive skin refers to skin that reacts more sensitively than normal skin to stimulation such as external irritants, cosmetics containing specific ingredients or environmental changes; it consequently exhibits irritation reactions (stinging, burning, itching, tightness) or dermatitis. 50 , 51 , 52 There are four types of sensitive skin: (1) acne type (prone to developing acne lesions such as papules, pustules, comedones and cysts), (2) rosacea type (featuring a tendency toward recurrent flushing, facial redness and experiencing hot sensations), (3) stinging type (predilection to stinging or burning sensations) and (4) allergic type (more likely to exhibit erythema, pruritus and skin flaking on contact with allergens and irritants); 2 we evaluated three types of sensitive skins: stinging, rosacea and acne type.
CYR61, also known as CCN1, is an extracellular secreted protein. One study revealed an increase in CYR61 expression following treatment with 10% lactic acid in 3D‐skin, 53 indicating a correlation with stinging‐type sensitive skin. In the skin, placental growth factor (PGF) is a key molecule in adult pathological angiogenesis. PGF expression is up‐regulated during wound healing. 54 , 55 RBP4 encodes retinol‐binding protein 4, a carrier protein of vitamin A. The level of RBP4 in blood is increased in individuals with obesity. 56 However, further studies of its association with skin sensitivity are needed.
CAMP, also known as LL‐37, is a well‐studied gene that encodes cathelicidin, which is related to rosacea. 57 , 58 MMPs are enhanced in rosacea, and CAMP facilitates mast cell degranulation, which induces an increase in MMP‐9. 59 TAC1 encodes neurokinin A (substance K). The biological actions of TAC1 are mediated by G protein‐coupled receptors (TACR1, TACR2 and TACR3); among them, TACR3 polymorphism is related to rosacea. 60
MMPs are also related to acne. Kang et al. reported that activated transcription factors nuclear factor‐kappa B and activator protein‐1 in acne lesions led to increased expression of MMPs. MMP3 and MMP12 expressions were positively correlated with the visual assessment of acne‐type sensitive skin. Studies have shown that expression of both genes is increased in acne lesions compared to that in control skin. 61 , 62 In addition, using integrated bioinformatics methods, CCR1, one of the chemokine receptors, was found to be associated with acne. 63 A needle length of 650 μm can lead to an overestimation of inflammatory gene expression for inflamed skin, such as acne skin. Therefore, a careful approach to applying microneedles to specific skin types is required. This could be confirmed by comparing the biomarker expression patterns according to the length of microneedles in inflammatory and non‐inflammatory skin lesions.
We confirmed that the sodium hyaluronate‐based microneedle can be used as a skin sampling method for transcriptomic biomarker analysis. We also suggest various RNA biomarkers related to age, non‐invasive device measurements, LAST score and visual assessment of acne lesions. Therefore, using a microneedle to collect skin samples and analysing the gene expression can be applied as an alternative method for classifying skin types. We only analysed skin type‐related biomarkers in subjects who had no symptoms of skin diseases. We will further apply this method to diagnose and test treatment efficacies of various skin diseases in addition to using it to explore skin types.
5. CONCLUSIONS
We analysed various biomarkers related to skin conditions at the mRNA expression level in skin samples obtained using minimally invasive microneedles. The correlations between the biomarkers and age, the measurements derived from non‐invasive devices, LAST score or visual assessment of acne lesions were confirmed.
In addition to methods such as biopsy, tape stripping and swab, which were previously used to collect skin specimens, a new micro‐sampling method for transcriptome analysis of human skin is proposed. This method can be applied to various molecular biological analyses in the field of skin disease studies and personalized studies.
CONFLICT OF INTEREST
Kwang Hoon Lee is the CEO of Cutis Biomedical Research Center and on the advisory committee of Raphas. Do Hyeon Jeong is the CEO of Raphas, a parent company of the Cutis Biomedical Research Center. Seo Hyeong Kim, Ji Hye Kim, Sung Jae Lee, and Min Sook Jung are employees of the Cutis Biomedical Research Center and, to our knowledge, have a financial relationship with a commercial entity that has an interest in the subject of this manuscript. The interests of these authors did not influence academic fairness in conducting this study, analysing the results, or writing a paper.
Supporting information
Table S1. Summary of correlation results.
Figure S1. Subjects’ information and experimental scheme.
Figure S2. Heat maps of skin aging‐related genes by age.
Figure S3. Heat maps of skin hydration‐related genes by non‐invasive devices measurements.
Figure S4. Heat maps of skin pigmentation‐related genes by skin colour.
Figure S5. Analysis of stinging type sensitive skin with microarray.
Figure S6. Analysis of rosacea type sensitive skin with microarray.
Figure S7. Analysis of acne type sensitive skin with microarray.
Figure S8. Correlations between mRNA expression levels and sensitive skin measurement values.
Kim SH, Kim JH, Lee SJ, Jung MS, Jeong DH, Lee KH. Minimally invasive skin sampling and transcriptome analysis using microneedles for skin type biomarker research. Skin Res Technol. 2022;28:322–335. 10.1111/srt.13135
REFERENCES
- 1. Astner S, Anderson RR. Skin phototypes 2003. J Invest Dermatol. 2004;122(2):xxx–xxxi. [DOI] [PubMed] [Google Scholar]
- 2. Baumann L. Understanding and treating various skin types: the Baumann skin type indicator. Dermatol Clin. 2008;26(3):359–73, vi. [DOI] [PubMed] [Google Scholar]
- 3. Ohshima H, Kinoshita S, Oyobikawa M, Futagawa M, Takiwaki H, Ishiko A, et al. Use of Cutometer area parameters in evaluating age‐related changes in the skin elasticity of the cheek. Skin Res Technol. 2013;19(1):e238–42. [DOI] [PubMed] [Google Scholar]
- 4. Kim SH, Kim JH, Suk JM, Lee YI, Kim J, Lee JH, et al. Identification of skin aging biomarkers correlated with the biomechanical properties. Skin Res Technol. 2021;27:940–7. [DOI] [PubMed] [Google Scholar]
- 5. Clarys P, Alewaeters K, Lambrecht R, Barel AO. Skin color measurements: comparison between three instruments: the Chromameter(R), the DermaSpectrometer(R) and the Mexameter(R). Skin Res Technol. 2000;6(4):230–8. [DOI] [PubMed] [Google Scholar]
- 6. Yilmaz E, Borchert HH. Effect of lipid‐containing, positively charged nanoemulsions on skin hydration, elasticity and erythema–an in vivo study. Int J Pharm. 2006;307(2):232–8. [DOI] [PubMed] [Google Scholar]
- 7. Shin JW, Lee DH, Choi SY, Na J‐I, Park K‐C, Youn S‐W, et al. Objective and non‐invasive evaluation of photorejuvenation effect with intense pulsed light treatment in Asian skin. J Eur Acad Dermatol Venereol. 2011;25(5):516–22. [DOI] [PubMed] [Google Scholar]
- 8. Lei BUW, Yamada M, Hoang VLT, Belt PJ, Moore MH, Lin LL, et al. Absorbent microbiopsy sampling and RNA extraction for minimally invasive, simultaneous blood and skin analysis. J Vis Exp. 2019. DOI: 10.3791/58614 [DOI] [PubMed] [Google Scholar]
- 9. Yamada M, Melville E, Cowin AJ, Prow TW, Kopecki Z. Microbiopsy‐based minimally invasive skin sampling for molecular analysis is acceptable to epidermolysis bullosa simplex patients where conventional diagnostic biopsy was refused. Skin Res Technol. 2021;27(3):461–3. [DOI] [PubMed] [Google Scholar]
- 10. He R, Niu Y, Li Z, Li A, Yang H, Xu F, et al. A hydrogel microneedle patch for point‐of‐care testing based on skin interstitial fluid. Adv Healthc Mater. 2020;9(4):e1901201. [DOI] [PubMed] [Google Scholar]
- 11. Ita K. Transdermal delivery of drugs with microneedles—potential and challenges. Pharmaceutics 2015;7(3):90–105. [DOI] [PMC free article] [PubMed] [Google Scholar]
- 12. Del Bino S, Sok J, Bessac E, Bernerd F. Relationship between skin response to ultraviolet exposure and skin color type. Pigment Cell Res. 2006;19(6):606–14. [DOI] [PubMed] [Google Scholar]
- 13. Marriott M, Holmes J, Peters L, Cooper K, Rowson M, Basketter DA. The complex problem of sensitive skin. Contact Dermatitis. 2005;53(2):93–9. [DOI] [PubMed] [Google Scholar]
- 14. Kim JD, Kim M, Yang H, Lee K, Jung H. Droplet‐born air blowing: novel dissolving microneedle fabrication. J Control Release. 2013;170(3):430–6. [DOI] [PubMed] [Google Scholar]
- 15. Dyjack N, Goleva E, Rios C, Kim BE, Bin L, Taylor P, et al. Minimally invasive skin tape strip RNA sequencing identifies novel characteristics of the type 2‐high atopic dermatitis disease endotype. J Allergy Clin Immunol. 2018;141(4):1298–309. [DOI] [PMC free article] [PubMed] [Google Scholar]
- 16. Manchester KL. Value of A260/A280 ratios for measurement of purity of nucleic acids. Biotechniques 1995;19(2):208–10. [PubMed] [Google Scholar]
- 17. Glasel JA. Validity of nucleic acid purities monitored by 260nm/280nm absorbance ratios. Biotechniques 1995;18(1):62–3. [PubMed] [Google Scholar]
- 18. Kim HS, Byun SH, Lee BM. Effects of chemical carcinogens and physicochemical factors on the UV spectrophotometric determination of DNA. J Toxicol Environ Health A. 2005;68(23‐24):2081–95. [DOI] [PubMed] [Google Scholar]
- 19. Choi JW, Kwon SH, Huh CH, Park KC, Youn SW. The influences of skin visco‐elasticity, hydration level and aging on the formation of wrinkles: a comprehensive and objective approach. Skin Res Technol. 2013;19(1):e349–55. [DOI] [PubMed] [Google Scholar]
- 20. Lei BUW, Prow TW. A review of microsampling techniques and their social impact. Biomed Microdevices. 2019;21(4):81. [DOI] [PMC free article] [PubMed] [Google Scholar]
- 21. Mandal A, Boopathy AV, Lam LKW, Moynihan KD, Welch ME, Bennett NR, et al. Cell and fluid sampling microneedle patches for monitoring skin‐resident immunity. Sci Transl Med. 2018;10(467):eaar2227. [DOI] [PubMed] [Google Scholar]
- 22. Samant PP, Niedzwiecki MM, Raviele N, Tran V, Mena‐Lapaix J, Walker DI, et al. Sampling interstitial fluid from human skin using a microneedle patch. Sci Transl Med. 2020;12(571):eaaw0285. [DOI] [PMC free article] [PubMed] [Google Scholar]
- 23. Yang J, Liu X, Fu Y, Song Y. Recent advances of microneedles for biomedical applications: drug delivery and beyond. Acta Pharm Sin B. 2019;9(3):469–83. [DOI] [PMC free article] [PubMed] [Google Scholar]
- 24. Al Sulaiman D, Chang JYH, Bennett NR, Topouzi H, Higgins CA, Irvine DJ, et al. Hydrogel‐coated microneedle arrays for minimally invasive sampling and sensing of specific circulating nucleic acids from skin interstitial fluid. ACS Nano. 2019;13(8):9620–8. [DOI] [PMC free article] [PubMed] [Google Scholar]
- 25. Becker LC, Bergfeld WF, Belsito DV, Klaassen CD, Marks JG, Shank RC, et al. Final report of the safety assessment of hyaluronic acid, potassium hyaluronate, and sodium hyaluronate. Int J Toxicol. 2009;28(4 Suppl):5–67. [DOI] [PubMed] [Google Scholar]
- 26. Murray BC, Wickett RR. Correlations between Dermal Torque Meter®, Cutometer®, and Dermal Phase Meter® measurements of human skin. Skin Res Technol. 1997;3(2):101–06. [DOI] [PubMed] [Google Scholar]
- 27. Quan T, Fisher GJ. Role of age‐associated alterations of the dermal extracellular matrix microenvironment in human skin aging: a mini‐review. Gerontology 2015;61(5):427–34. [DOI] [PMC free article] [PubMed] [Google Scholar]
- 28. Lago JC, Puzzi MB. The effect of aging in primary human dermal fibroblasts. PLoS One. 2019;14(7):e0219165. [DOI] [PMC free article] [PubMed] [Google Scholar]
- 29. Haustead DJ, Stevenson A, Saxena V, Marriage F, Firth M, Silla R, et al. Transcriptome analysis of human ageing in male skin shows mid‐life period of variability and central role of NF‐κB. Sci Rep. 2016;6:26846. [DOI] [PMC free article] [PubMed] [Google Scholar]
- 30. Hwang J‐S, Kim H‐K, Son E‐D, Lee J‐Y, Kang H‐H, Chang I‐S. The fragments of fibronectin (Fn‐fr's 70, 45 kDa) increase MMP‐1 expression and MMP‐2 activity in normal human fibroblasts. J Soc Cosmet Sci Korea. 2007;33:245–249. [Google Scholar]
- 31. Varga J, Rosenbloom J, Jimenez SA. Transforming growth factor beta (TGF beta) causes a persistent increase in steady‐state amounts of type I and type III collagen and fibronectin mRNAs in normal human dermal fibroblasts. Biochem J. 1987;247(3):597–604. [DOI] [PMC free article] [PubMed] [Google Scholar]
- 32. Kitagishi Y, Nakano N, Ogino M, Ichimura M, Minami A, Matsuda S. PINK1 signaling in mitochondrial homeostasis and in aging (review). Int J Mol Med. 2017;39(1):3–8. [DOI] [PubMed] [Google Scholar]
- 33. Smith FJD, Irvine AD, Terron‐Kwiatkowski A, Sandilands A, Campbell LE, Zhao Y, et al. Loss‐of‐function mutations in the gene encoding filaggrin cause ichthyosis vulgaris. Nat Genet. 2006;38(3):337–42. [DOI] [PubMed] [Google Scholar]
- 34. Segre JA, Bauer C, Fuchs E. Klf4 is a transcription factor required for establishing the barrier function of the skin. Nat Genet. 1999;22(4):356–60. [DOI] [PubMed] [Google Scholar]
- 35. Kim BE, Leung DY, Boguniewicz M, Howell MD. Loricrin and involucrin expression is down‐regulated by Th2 cytokines through STAT‐6. Clin Immunol. 2008;126(3):332–7. [DOI] [PMC free article] [PubMed] [Google Scholar]
- 36. Koch PJ, de Viragh PA, Scharer E, Bundman D, Longley MA, Bickenbach J, et al. Lessons from loricrin‐deficient mice: compensatory mechanisms maintaining skin barrier function in the absence of a major cornified envelope protein. J Cell Biol. 2000;151(2):389–400. [DOI] [PMC free article] [PubMed] [Google Scholar]
- 37. Visscher MO. Skin color and pigmentation in ethnic skin. Facial Plast Surg Clin North Am. 2017;25(1):119–25. [DOI] [PubMed] [Google Scholar]
- 38. Hoashi T, Watabe H, Muller J, Yamaguchi Y, Vieira WD, Hearing VJ. MART‐1 is required for the function of the melanosomal matrix protein PMEL17/GP100 and the maturation of melanosomes. J Biol Chem. 2005;280(14):14006–16. [DOI] [PubMed] [Google Scholar]
- 39. Tomihari M, Hwang SH, Chung JS, Cruz PD Jr., Ariizumi K. Gpnmb is a melanosome‐associated glycoprotein that contributes to melanocyte/keratinocyte adhesion in a RGD‐dependent fashion. Exp Dermatol. 2009;18(7):586–95. [DOI] [PMC free article] [PubMed] [Google Scholar]
- 40. Biswas KB, Takahashi A, Mizutani Y, Takayama S, Ishitsuka A, Yang L, et al. GPNMB is expressed in human epidermal keratinocytes but disappears in the vitiligo lesional skin. Sci Rep. 2020;10(1):4930. [DOI] [PMC free article] [PubMed] [Google Scholar]
- 41. Fitzpatrick TB, Becker SW Jr., Lerner AB, Montgomery H. Tyrosinase in human skin: demonstration of its presence and of its role in human melanin formation. Science 1950;112(2904):223–5. [DOI] [PubMed] [Google Scholar]
- 42. Pillaiyar T, Manickam M, Namasivayam V. Skin whitening agents: medicinal chemistry perspective of tyrosinase inhibitors. J Enzyme Inhib Med Chem. 2017;32(1):403–25. [DOI] [PMC free article] [PubMed] [Google Scholar]
- 43. Sakuma TH, Maibach HI. Oily skin: an overview. Skin Pharmacol Physiol. 2012;25(5):227–35. [DOI] [PubMed] [Google Scholar]
- 44. Smith TM, Gilliland K, Clawson GA, Thiboutot D. IGF‐1 induces SREBP‐1 expression and lipogenesis in SEB‐1 sebocytes via activation of the phosphoinositide 3‐kinase/Akt pathway. J Invest Dermatol. 2008;128(5):1286–93. [DOI] [PMC free article] [PubMed] [Google Scholar]
- 45. Vora S, Ovhal A, Jerajani H, Nair N, Chakrabortty A. Correlation of facial sebum to serum insulin‐like growth factor‐1 in patients with acne. Br J Dermatol. 2008;159(4):990–1. [DOI] [PubMed] [Google Scholar]
- 46. Sugiyama‐Nakagiri Y, Naoe A, Ohuchi A, Kitahara T. Serum levels of IGF‐1 are related to human skin characteristics including the conspicuousness of facial pores. Int J Cosmet Sci. 2011;33(2):144–9. [DOI] [PubMed] [Google Scholar]
- 47. Leiva AG, Chen AL, Devarajan P, Chen Z, Damanpour S, Hall JA, et al. Loss of Mpzl3 function causes various skin abnormalities and greatly reduced adipose depots. J Invest Dermatol. 2014;134(7):1817–27. [DOI] [PMC free article] [PubMed] [Google Scholar]
- 48. Wikramanayake TC, Borda LJ, Wang Y, Duffort S, Reyes‐Capo A, Barsam A, et al. Loss of MPZL3 function causes seborrhoeic dermatitis‐like phenotype in mice. Exp Dermatol. 2017;26(8):736–8. [DOI] [PMC free article] [PubMed] [Google Scholar]
- 49. Barrault C, Garnier J, Pedretti N, Cordier‐Dirikoc S, Ratineau E, Deguercy A, et al. Androgens induce sebaceous differentiation in sebocyte cells expressing a stable functional androgen receptor. J Steroid Biochem Mol Biol. 2015;152:34–44. [DOI] [PubMed] [Google Scholar]
- 50. Berardesca E, Farage M, Maibach H. Sensitive skin: an overview. Int J Cosmet Sci. 2013;35(1):2–8. [DOI] [PubMed] [Google Scholar]
- 51. Do LHD, Azizi N, Maibach H. Sensitive skin syndrome: an update. Am J Clin Dermatol. 2020;21(3):401–9. [DOI] [PubMed] [Google Scholar]
- 52. Misery L, Boussetta S, Nocera T, Perez‐Cullell N, Taieb C. Sensitive skin in Europe. J Eur Acad Dermatol Venereol. 2009;23(4):376–81. [DOI] [PubMed] [Google Scholar]
- 53. Hasan MZ, Kitamura M, Kawai M, Ohira M, Mori K, Shoju S, et al. Transcriptional profiling of lactic acid treated reconstructed human epidermis reveals pathways underlying stinging and itch. Toxicol In Vitro. 2019;57:164–73. [DOI] [PubMed] [Google Scholar]
- 54. Failla CM, Odorisio T, Cianfarani F, Schietroma C, Puddu P, Zambruno G. Placenta growth factor is induced in human keratinocytes during wound healing. J Invest Dermatol. 2000;115(3):388–95. [DOI] [PubMed] [Google Scholar]
- 55. Odorisio T, Cianfarani F, Failla CM, Zambruno G. The placenta growth factor in skin angiogenesis. J Dermatol Sci. 2006;41(1):11–9. [DOI] [PubMed] [Google Scholar]
- 56. Klöting N, Graham TE, Berndt J, Kralisch S, Kovacs P, Wason CJ, et al. Serum retinol‐binding protein is more highly expressed in visceral than in subcutaneous adipose tissue and is a marker of intra‐abdominal fat mass. Cell Metab. 2007;6(1):79–87. [DOI] [PubMed] [Google Scholar]
- 57. Reinholz M, Ruzicka T, Steinhoff M, Schaller M, Gieler U, Schöfer H, et al. Pathogenesis and clinical presentation of rosacea as a key for a symptom‐oriented therapy. J Dtsch Dermatol Ges. 2016;14(Suppl 6):4–15. [DOI] [PubMed] [Google Scholar]
- 58. Yamasaki K, Di Nardo A, Bardan A, Murakami M, Ohtake T, Coda A, et al. Increased serine protease activity and cathelicidin promotes skin inflammation in rosacea. Nat Med. 2007;13(8):975–80. [DOI] [PubMed] [Google Scholar]
- 59. Woo YR, Lim JH, Cho DH, Park HJ. Rosacea: molecular mechanisms and management of a chronic cutaneous inflammatory condition. Int J Mol Sci. 2016;17(9):1562. [DOI] [PMC free article] [PubMed] [Google Scholar]
- 60. Karpouzis A, Avgeridis P, Tripsianis G, Gatzidou E, Kourmouli N, Veletza S. Assessment of tachykinin receptor 3' gene polymorphism rs3733631 in rosacea. Int Sch Res Notices. 2015;2015:469402. [DOI] [PMC free article] [PubMed] [Google Scholar]
- 61. Kang S, Cho S, Chung JH, Hammerberg C, Fisher GJ, Voorhees JJ. Inflammation and extracellular matrix degradation mediated by activated transcription factors nuclear factor‐kappaB and activator protein‐1 in inflammatory acne lesions in vivo. Am J Pathol. 2005;166(6):1691–9. [DOI] [PMC free article] [PubMed] [Google Scholar]
- 62. Kelhälä HL, Palatsi R, Fyhrquist N, Lehtimäki S, Väyrynen JP, Kallioinen M, et al. IL‐17/Th17 pathway is activated in acne lesions. PLoS One. 2014;9(8):e105238. [DOI] [PMC free article] [PubMed] [Google Scholar]
- 63. Li X, Jia Y, Wang S, Meng T, Zhu M. Identification of genes and pathways associated with acne using integrated bioinformatics methods. Dermatology 2019;235(6):445–55. [DOI] [PubMed] [Google Scholar]
Associated Data
This section collects any data citations, data availability statements, or supplementary materials included in this article.
Supplementary Materials
Table S1. Summary of correlation results.
Figure S1. Subjects’ information and experimental scheme.
Figure S2. Heat maps of skin aging‐related genes by age.
Figure S3. Heat maps of skin hydration‐related genes by non‐invasive devices measurements.
Figure S4. Heat maps of skin pigmentation‐related genes by skin colour.
Figure S5. Analysis of stinging type sensitive skin with microarray.
Figure S6. Analysis of rosacea type sensitive skin with microarray.
Figure S7. Analysis of acne type sensitive skin with microarray.
Figure S8. Correlations between mRNA expression levels and sensitive skin measurement values.