Abstract
Raman spectroscopic imaging is a label‐free spectral technology to investigate the distribution of transdermal targets in skin. However, it is difficult to analyze low content of analytes in skin by direct imaging analysis. Combining Raman mapping technology with multiple linear regression algorithms, concentration contribution factor of targets in ex vivo human skin tissue at every point has been calculated. The distribution profiles are visualized as heat maps demonstrating the targets levels in different skin layers. This method has been successfully employed to investigate the vibrational imaging of distribution of hyaluronic acid and lidocaine in skin. Moreover, three dimensional (3D) images of the penetration profiles of hyaluronic acid with different molecular weight have been obtained. The results from 3D images were in good agreement with these from two‐dimensional images, indicating that this method was a reliable way for monitoring the distribution of targets in skin.
Keywords: abundance fraction estimation, image, Raman mapping, skin
1. INTRODUCTION
For the development of novel skin therapeutics or cosmetics, there is a high demand for monitoring the distribution of marketed and newly developed formulations on the skin structure. Without the need for destroying the tissue, the penetration of substances can be monitored rather than being limited to the measurement of permeation like in Franz diffusion cell experiments. Visualization of their distributions in different skin layers can be very effective and intuitive to study the dynamic process of targets in the skin, which provides a new method for the continuous improvement and optimization of their formulations. This will be of great value to investigate both the pharmacokinetic and pharmacodynamic of topical and transdermal medicines. The traditional skin pharmacokinetics methods, such as tape stripping 1 , 2 and skin microdialysis, 3 only gave a total quantitative data. It was difficult to observe the spatial concentration distribution and penetration depth of targets in each layer of the skin. Therefore, it is a complement to the existing method to develop a rapid and intuitive imaging method to investigate the concentration level and stereotactic distribution of targets at each spatial site in the skin in transdermal field.
Raman scattering is a noninvasive and high spatial resolution spectral technique, which can provide fingerprint information of material structure. 4 , 5 , 6 Several studies have reported that confocal Raman is an effective methodology to evaluate the delivery of targets (drugs or cosmetics) in skin by analyzing their concentration distribution. 7 , 8 , 9 , 10 , 11 , 12 , 13 , 14 However, the background signal from the skin is too high to recognize the Raman characteristic signal of the target. Therefore, there is a high need for developing an effective technology to unmix and extract the spectral signals of targets for imaging.
Multivariable linear regression is a commonly used model for analysis of different components in complex system. Least squares (LS) analysis is commonly employed to resolve the problem. 15 , 16 , 17 , 18 As the concentration of each substance in the mixing system is positive, there will be negative numbers when solving the multivariate linear regression with LS. Therefore, LS with a nonnegative constraint was used to solve the problem for concentration analysis. This nonnegative constraint method outperformed the LS approach by not generating any negative fraction estimates; thus, this method was found to be promising for estimation of the abundance fraction of chemical agents existing in the skin. 19 , 20 , 21
In this work, the penetration of lidocaine and hyaluronic acid (HA) were studied. Lidocaine is a transdermal and local anesthetic agent used in pharmacological pain control. The action site for lidocaine is the dermis, which are full of pain nerve for perception of pain. Obviously, lidocaine needs to penetrate into the dermis to take effect. Therefore, investigation of its penetration profile in skin is important for optimization of the formulation. HA is an acidic mucopolysaccharide with different molecular weight, which is widely found in drugs and cosmetics. It can make skin tender, smooth, wrinkle‐free, increasing of elasticity, antiaging, and promote wound healing. 22 The permeability of HA with different molecular weight in skin is different. Two‐dimensional (2D) and three‐dimensional (3D) imaging studies have been applied for studying the permeability of HA with molecular weight of 10, 30, and 80 kDa in skin. And the results were in good agreement with each other.
2. EXPERIMENTAL SECTION
2.1. Materials
Porcine skin is a representative membrane for percutaneous absorption because it has permeation characteristics similar to those of human skin. The skin morphology is similar in human and porcine tissues. Porcine skin used in this work was from the ear of a pig, which was obtained from a supermarket in Shanghai. Most of the subcutaneous fat was removed. The skin was dermatomed to a thickness of 500 ±50 μm. Only intact skin discs with a diameter of 2.5 cm were kept and sealed in plastic bags at −20 °C until use.
Excised porcine skin was used in all in vitro experiments. Three kinds of HA, derived from microbial fermentation, with different molecular weights of 10, 30, and 80 kDa were provided by Macklin (Shanghai, China). HA solutions were prepared at 2% by dissolving 0.2 g of HA in 10 mL of sterile distilled water. Lidocaine, resolved in a mixture reagent containing oleic acid, Tween 20, and propanetriol, was employed as a model drug. The skin samples exposed to 2% lidocaine for 0.5 h and 2% HA for 16 h, respectively, followed by cutting into a slice with thickness of 30 μm. Finally, multiple Raman spectra were acquired at different points on the skin slice by mapping technology.
2.2. Instruments
Raman experiments were performed using an HR Evolution LabRaman confocal microscope (Horiba, Japan) equipped with a 50× objective and a grating with 600 grooves/mm. The laser of 532‐nm diode‐pumped solid‐state laser was employed as the excitation source, with a power of 25 mW at the sample. Optical photographs were taken on an LMPlan (Olympus, Japan) optical microscope coupled with the Raman spectrometer. All spectral images of the skin slices displayed with the stratum corneum oriented to the top in this work. The size of the laser spot was estimated to be below 2 μm under the acquisition condition. The step sizes were 3 μm in the X and Y directions. An acquisition time of 5 s per spectrum was used, over the 400–2000 cm−1 spectral range.
2.3. Data handling
In this paper, spectral unmixing methods are proposed for classification and abundance fraction (concentration) estimation of chemical and biological agents that exist in the mixture. Due to the heterogeneous diffusion of lidocaine, acquisition of 2D images representing both depth penetration and possible lateral variability was preferred. The unmixing spectral information was done as the following method.
The Raman spectrum signal of porcine skin with lidocaine can be regarded as a linear combination of Raman signals of various substances, expressed as the following form 23 , 24 :
| (1) |
Vector y is the Raman signal of the mixture. x i is the Raman spectra for the i substance and is the contribution of the i substance to the mixed spectral y .
Formula (1) can be rewritten as follows:
| (2) |
In formula (2), is the pure spectrum matrix for each substance. is the contribution coefficient vector for each substance. Using ordinary LS to solve the problem, the result is . However, β obtained by ordinary LS may contain negative coefficients, which is not consistent with the fact that the minimum Raman spectrum contribution of a substance is 0, not a negative number. Therefore, nonnegative constraints of regression coefficients were performed by using LS analysis (LSA), which can deliver abundance fraction (concentration) of chemical and biological agents that exist in the mixture. Therefore, the contribution coefficient vector of formula (2) was calculated by LSA with nonnegative constraints of regression (LSANCR).
First, an algorithm named adaptive iteratively reweighted penalized LS (airPLS) was conducted for baseline correction of Raman spectra. 25 For calculation of the contribution coefficient of target by formula (2) using LSANCR, the spectra of each components in the mixture are required, including the various substances in the pig skin and the Raman spectra of the targets. However, skin is a mixture of protein, lipid, and DNA. It is impossible to obtain the pure spectrum of every component. A feasible method to resolve this problem is to acquire a control mapping spectra of skin without target. Then, a certain number of representative Raman spectra were selected from the total spectra to represent the matrix material. For skin with target, these extracted spectra are linear combinations of pure spectra of various components in pig skin. These representative spectra from skin, together with that of target, were introduced into the matrix X of formula (2), and the contribution coefficient of target at different points on pig skin can be estimated. The coefficient is relating with the abundance fraction (concentration) of target on skin, followed by presented as heat maps to show its concentration distribution in the skin.
Ultimately, distribution maps and penetration profiles can be obtained, providing crucial information about the diffusion and distribution of target in the skin. This method supports the translation of Raman confocal imaging to medical application for development and optimization of new candidates for skin topical preparations. The processing of data maps was performed by using homemade software that operated in the Matlab environment.
3. RESULTS AND DISCUSSION
3.1. Choosing proper supporting material
Porcine slice with a thickness of 30 μm, which was loaded on a supporting material, was employed to acquire the Raman signal. As the laser of Raman spectrometer has strong penetration ability, it can penetrate through the skin slice into the supporting material. Therefore, only those materials with low background interference in the interested range from 400 to 2000 cm−1 can be used. In addition, mapping acquisitions required a flat and solid surface. Frozen section required a transparent and hydrophilic supporting material, which was benefit for transferring the slice to the substrate. According to these requirements, background signals of conventional supporting materials, such as glass and quartz, were collected. As shown in Figure 1, an obvious peak at 1091 cm−1 of glass and a peak at 796 cm−1 of quartz were observed in the range from 400 to 2000 cm−1. These signals can interfere with the signal of porcine. It can be seen that the signal is silent from 400 to 2000 cm−1 of CaF2 slice with Raman grade. Therefore, CaF2 slice was used as supporting material in the following work.
FIGURE 1.
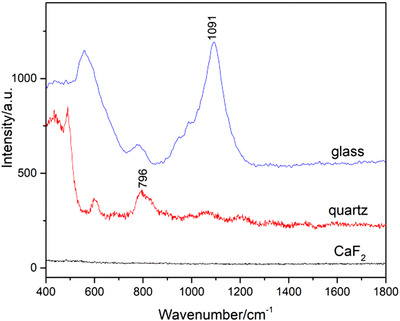
The Raman spectra of different supporting materials
3.2. Optimization of the thickness of the skin slice
The thickness of the slice will affect the sampling volume, so as to influence the signal intensity. Spectra acquired on skin slices with different thickness were presented in Figure 2. It can be seen from the picture that the signal becomes higher as the thickness of the slice increases. However, the surface of slice tended to become coarse as the thickness up to 40 μm, leading to some difficulties in focusing when acquiring the mapping spectra. Therefore, slice with 30 μm was chosen in the following experiments.
FIGURE 2.
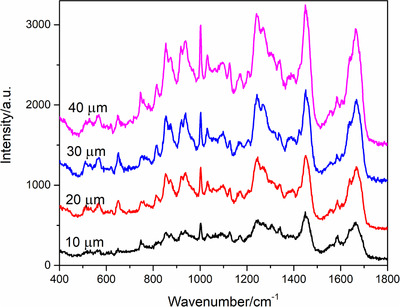
Raman spectra of skin slices with different thickness
3.3. Optimization of laser power and integration time
Due to the Raman signal of skin mainly coming from its main component of protein, DNA, and lipid, laser power and integration time has obvious influence on the signal intensity. The signals acquired following different power and integration time are presented in Figures 3(A) and (B), respectively. It can be seen from this figure that the signal increases as the power and integration time are increasing. However, the structure of skin can be damaged when the laser was higher than 50 mW during a long mapping acquisition. It is displayed in Figure 3(B) that the signal intensity of skin improves obviously as the integration time up to 5 s with power of 50 mW. However, it is time‐consuming for acquiring the mapping data when the integration time was too long. Therefore, the power of 50 mW and integration time of 5 s was employed in this work.
FIGURE 3.
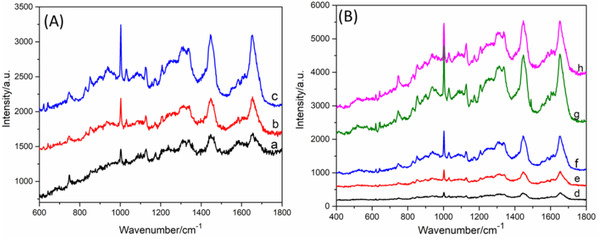
Raman spectra acquired with (A) different laser power (a) 25 mW, (b) 50 mW, (c) 100 mW, and (B) different integration time (d) 1 s, (e) 2 s, (f) 3 s, (g) 5 s, and (f) 8 s
3.4. Raman spectra of lidocaine, skin, and skin treated with lidocaine
The Raman spectra of skin treated with 10% lidocaine (a), pure skin (b), and pure lidocaine (c) are displayed in Figure 4. Strong bands at 617, 706, 1097, 1265, and 1595 cm−1 of lidocaine were observed. The spectrum of skin treated with 10% lidocaine was a mixed spectrum with the contribution from lidocaine and skin. Comparing curves a and b, weak bands at 617, 706, 1265, and 1595 cm−1 of lidocaine can be distinguished from the peaks of skin. Clearly, only a little of lidocaine can permeate into the skin.
FIGURE 4.
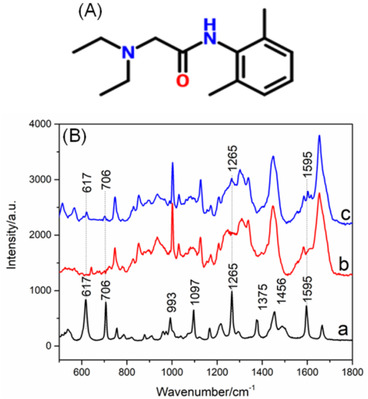
(A) Chemical structure of lidocaine. (B) A typical Raman spectrum of the reference spectrum of pure lidocaine (a), the skin (b), and the skin exposed to 10% lidocaine (c)
3.5. Depth profiling of lidocaine in skin
In order to track the penetration of lidocaine in skin, Raman mapping spectra of pure skin and skin treated with 10% lidocaine were acquired. Employing the data handling technology in Section 2.4, the abundance fraction of lidocaine at every point of mapping spectra was calculated, followed by presented as a heat map to show the concentration distribution (Figure 5A). It can be seen from Figure 4(B) that when the concentration of lidocaine was 10%, some characteristic peaks of target can be distinguished from these of skin. To verify the effectiveness of this new method, a comparison was investigated by profiling target in skin exposed to 10% lidocaine following the LSANCR method (Figure 5A) and by clamping the characteristic peak at 617 cm−1 performed by LabSpec 6 software (Figure 5B). It can be seen from the picture that lidocaine can penetrate through the corneum and reach the dermis of the skin (Figure 5A). The distribution results obtained from two methods are almost the same (Figure 5), indicating that this reconstructed heat maps following this developed method are believable.
FIGURE 5.
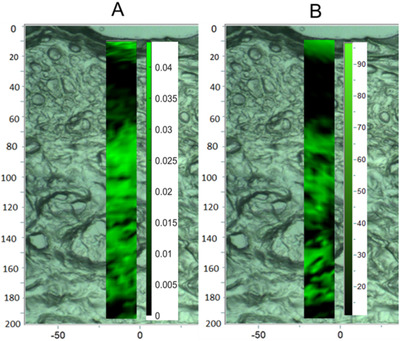
A comparison of maps of skin samples exposed to 10% lidocaine following the LSANCR method (A) and imaging with clamping peak at 617 cm−1 by LabSpec 6 software (B)
However, when the concentration of lidocaine dropped to 5% and 2%, no characteristic peaks of target can be distinguished from those of skin. Clearly, no distribution image of target can be observed by the way of clamping peaks. The distribution images of lidocaine with concentration of 0.5%, 2%, and 5% can be calculated and presented in Figures 6(A)–(C), respectively. It is shown in this picture that as the concentration of lidocaine increases, the abundance level of lidocaine in skin increases. Moreover, it is also shown that lidocaine can penetrate through the corneum and cover the dermis of the skin when its concentration is higher than 2%. As dermis is rich in neural innervation, demonstrating that lidocaine can be administered through transdermal drug to play a role in skin anesthesia. Therefore, this LSANCR method has obvious advantages over the way of clamping peak imaging for investigating the distribution of low‐abundance targets in the skin. This method is also helpful for optimizing anesthetic formulation of percutaneous administration.
FIGURE 6.
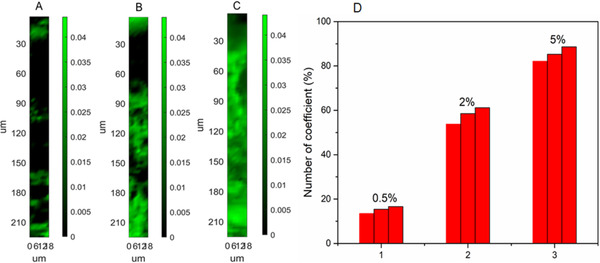
Reconstructed maps of skin samples exposed to different concentration of lidocaine (A) 0.5%, (B) 2%, and (C) 5% following the LSANCR method; the scale bar represents the abundance fraction of lidocaine at different point in preprocessed spectra. (D) Statistical chart of the number of coefficient data for lidocaine with the concentration of 0.5%, 2%, and 5% from three parallel experiments
Several works have been done for investigating the penetration profiling of lidocaine in skin. A comparison of this method with some other means has been finished and the results were summarized in Table 1. A similar Raman mapping method had been reported to image the penetration profile of lidocaine performed using Raman software package (OMNICTM 8.2) by the way of clamping peak imaging. 24 However, 5% lidocaine was employed for analysis in this work, with a lower imaging sensitivity. In addition, some other ex vivo skin penetration studies had been reported, 25 , 26 , 27 whereas only a total amount of target in skin had been obtained, without any distribution information. In addition, coefficient data of lidocaine in skin and a control skin were calculated, respectively. A total of 490 data points can be obtained for each experiment. The number of coefficient data of lidocaine in skin greater than blank value was counted and a corresponding statistical chart from three parallel experiments for each concentration was displayed in Figure 6(D). It can be observed that the number of data points larger than the blank value is around 15%, 58%, and 85% in each set of experiments. The values from three parallel experiments in each set of experiments are very close, indicating that this method is reliable. Moreover, this method is more practical in drug transdermal field.
TABLE 1.
Comparisons of previously reported method with the present method for profiling lidocaine
| Method of investigation | Method of analysis | Results | Comments | Ref. |
|---|---|---|---|---|
| In vitro skin penetration studies | Raman mapping combined with a special calculation | Distribution image | An image displaying the penetration profile intuitively; Home‐made software with high imaging. | This work |
| In vivo skin penetration studies | Acquisition of the spectra by Raman mapping | Distribution image | Obtaining the image by a soft of instrument company with low sensitivity. | 26 |
| Ex vivo skin penetration studies | UV absorption | A data of total content | An ex vivo skin studies, only total penetration amount obtained by indirect calculation, without a concentration profile in skin. | 27 |
| Ex vivo skin penetration studies | UV absorption | A data of total content | An ex vivo skin studies, only a total concentration calculated by indirect calculation | 28 |
| Ex vivo skin penetration studies | HPLC | A data of total content | A tape trapping method followed by a total concentration of target. | 29 |
3.6. Depth profiling of different weight of hyaluronic acid
To establish a controlled method for profiling different targets in skin, another target of HA with different molecular weight was investigated. The permeability depth profiles of HA with molecular weight of 10 kDa (Figure 7A1 and A2), 30 kDa (Figure 7B1 and B2), and 80 kDa (Figure 7C1 and C2) are displayed in Figure 7. Two parallel experiments for each sample were performed to investigate the repeatability. Clearly, the permeability depth and distribution profiles of target in skin between two parallel experiments, such as Figures 7(A1) and (A2), are almost the same, indicating excellent reducibility of this method. In addition, it is shown in this figure that HA with molecular weight of 10 and 30 kD can permeate into the epidermis. And most of HA with molecular weight of 80 kD accumulates in the cuticle, indicating that it is difficult for this polymer to pass through the cuticle. The above results demonstrate that HA with molecular weight over 80 kD is not fit for deep skin moisturizing as cosmetics.
FIGURE 7.
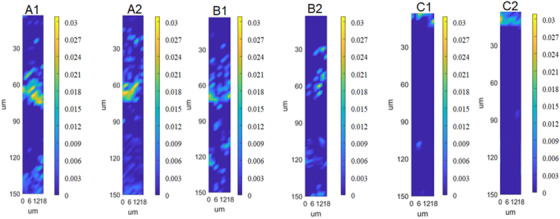
The permeability depth profiles of hyaluronic acid with molecular weight of 10 kDa (A1, A2), 30 kDa (B1, B2), and 80 kDa (C1, C2)
Moreover, 3D profiles of permeability depth of HA with molecular weight of 10 kDa (A), 30 kDa (B), and 80 kDa (C) are displayed in Figure 8. A scanning depth of 100 μm was employed in this study for each sample. It can be seen that the targets spread more and more difficultly as the molecular weight increases. And these results are in good agreement with these of 2D images, indicating that 3D technology is an alternative for investigating the permeability depth profiles of HA, except for the disadvantage of long time‐consuming for acquisition.
FIGURE 8.

The three dimensional permeability depth profiles of hyaluronic acid with molecular weight of 10 kDa (A), 30 kDa (B), and 80 kDa (C)
4. CONCLUSION
A method of investigating the permeability depth profiles of HA and lidocaine was developed based on multiple linear regression and spectral unmixing with a nonnegative constraint LS. The abundance coefficient of HA and lidocaine in skin has been extracted. Chemical maps representing the targets distribution in the skin have been constructed. The vertical distribution of target in the epidermis displayed as a heat colored map, which represents their relative concentration distribution in the skin. It was found that lidocaine penetrated into the dermis after half an hour pretreatment and HA with low molecular weight permeated into the skin more easily. This method is not only confined to tracing skin penetration of drugs and cosmetics. It has the potential to reveal in 3D penetration patterns of any topically applied formulation, be it with respect to (i) particles penetration or (ii) differing penetration behavior of a topical harmful substance or (iii) infiltration of pesticides on the surface of fruits and vegetables.
AUTHOR CONTRIBUTIONS
Yan Kang conceptualized the experiment and wrote the original draft. Zuyue Sun and Xin Zhang prepared the samples and performed the data acquiring.
CONFLICT OF INTEREST
The authors declare no financial or commercial conflict of interest.
ACKNOWLEDGMENTS
This work was sponsored by Science and Technology Commission of Shanghai Municipality (No. 19142201200).
Kang Y, Zhang F. Image of the distribution profile of targets in skin by Raman spectroscopy‐based multivariate analysis. Skin Res Technol. 2022;28:402–409. 10.1111/srt.13114
DATA AVAILABILITY STATEMENT
The data that support the findings of this study are available from the corresponding author upon reasonable request.
REFERENCES
- 1. Adlhart C, Baschong W. Surface distribution and depths profiling of particulate organic UV absorbers by Raman imaging and tape stripping. Int J Cosmetic Sci. 2011;33:527–34. [DOI] [PubMed] [Google Scholar]
- 2. Wagner H, Kostka KH, Lehr CM, Schaefer UF. Drug distribution in human skin using two different in vitro test systems: comparison with in vivo data Pharm Res. 2000;17:1475. [DOI] [PubMed] [Google Scholar]
- 3. Petersen LJ, Poulsen LK, Søndergaard J, Skov PS. The use of cutaneous microdialysis to measure substance P‐induced histamine release in intact human skin in vivo. J Allergy Clin Immun. 1994;94:773–83. [DOI] [PubMed] [Google Scholar]
- 4. Wu L, Wang L, Qia B, Zhang X, Chen F, Li Y, et al. 3D confocal Raman imaging of oil‐rich emulsion from enzyme‐assisted aqueous extraction of extruded soybean powder. Food Chem. 2018;249:16–21. [DOI] [PubMed] [Google Scholar]
- 5. Cao Y, Tian X, Gu J, Liu B, Zhang B, Song S, et al. Covalent functionalization of black phosphorus with conjugated polymer for information storage. Angew Chem Int Ed. 2018;57:4543–8. [DOI] [PubMed] [Google Scholar]
- 6. Kochan K, Chrabaszcz K, Szczur B, Maslak E, Dybas J, Marzec KM. IR and Raman imaging of murine brains from control and ApoE/LDLR(‐/‐) mice with advanced atherosclerosis. Analyst. 2016;141:5329–38. [DOI] [PubMed] [Google Scholar]
- 7. Alonso C, Carrer V, Barba C, Coderch L. Caffeine delivery in porcine skin: a confocal Raman study. Arch Dermatol Res. 2018;310:657–64. [DOI] [PubMed] [Google Scholar]
- 8. Alonso C, Martí M, Barba C, Carrer V, Rubio L, Coderch L. Skin permeation and antioxidant efficacy of topically applied resveratrol. Arch Dermatol Res. 2017;309:423–31. [DOI] [PubMed] [Google Scholar]
- 9. Tfaili S, Josse G, Angiboust JF, Manfait M, Piot O. Monitoring caffeine and resveratrol cutaneous permeation by confocal Raman microspectroscopy. J Biophotonics. 2014;7:676–81. [DOI] [PubMed] [Google Scholar]
- 10. Tfayli A, Piot O, Pitre F, Manfait M. Follow‐up of drug permeation through excised human skin with confocal Raman microspectroscopy. Eur Biophys J. 2007;36:1049–58. [DOI] [PubMed] [Google Scholar]
- 11. Tippavajhala VK, de Oliveira Mendes T, Martin AA. In vivo human skin penetration study of sunscreens by confocal Raman spectroscopy. AAPS Pharm SciTech. 2018;19:753–60. [DOI] [PubMed] [Google Scholar]
- 12. Choe C, Schleusener J, Choe S, Lademann J, Darvin ME. A modification for the calculation of water depth profiles in oil‐treated skin by in vivo confocal Raman microscopy. J Biophotonics. 2020;13:e201960106. [DOI] [PubMed] [Google Scholar]
- 13. Laing S, Bielfeldt S, Wilhelm KP, Obst J. Confocal Raman spectroscopy as a tool to measure the prevention of skin penetration by a specifically designed topical medical device. Skin Res Technol. 2019;25:578–86. [DOI] [PubMed] [Google Scholar]
- 14. Franzen L, Anderski J, Planz V, Kostka KH, Windbergs M. Combining confocal Raman microscopy and freeze‐drying for quantification of substance penetration into human skin. Exp Dermatol. 2014;23:942–4. [DOI] [PubMed] [Google Scholar]
- 15. Schleusener J, Carrer V, Patzelt A, Guo S, Bocklitz T, Coderch L, et al. Confocal Raman imaging of skin sections containing hair follicles using classical least squares regression and multivariate curve resolution – alternating least squares. Quantum Electron. 2019;49:6. [Google Scholar]
- 16. Abell JL, Garren JM, Driskell JD, Tripp RA, Zhao Y. Label‐free detection of micro‐RNA hybridization using surface‐enhanced Raman spectroscopy and least‐squares analysis. J Am Chem Soc. 2012;134:12889–92. [DOI] [PubMed] [Google Scholar]
- 17. Pacheco‐Londoño LC, Aparicio‐Bolaño JA, Galán‐Freyle NJ, Román‐Ospino AD, Ruiz‐Caballero JL, Hernández‐Rivera SP. Classical least squares‐assisted mid‐infrared (MIR) laser spectroscopy detection of high explosives on fabrics. Appl Spectrosc. 2019;73:17. [DOI] [PubMed] [Google Scholar]
- 18. Hegazy MA, Abdelwahab NS, Ali NW, Sharkawi MMZ, Abdelkawy MM, El‐Saadi MT. Comparison of two augmented classical least squares algorithms and PLS for determining nifuroxazide and its genotoxic impurities using UV spectroscopy. J Chemometr. 2019;33:e3190. [Google Scholar]
- 19. Tfayli A, Gobinet C, Vrabie V, Huez R, Manfait M, Piot O. Digital dewaxing of Raman signals: discrimination between nevi and melanoma spectra obtained from paraffin‐embedded skin biopsies. Appl Spectrosc. 2009;63:564–70. [DOI] [PubMed] [Google Scholar]
- 20. Farhane Z, Bonnier F, Maher MA, Bryant J, Casey A, Byrne HJ. Differentiating responses of lung cancer cell lines to Doxorubicin exposure: in vitro Raman micro spectroscopy, oxidative stress and bcl‐2 protein expression. J Biophotonics. 2017;10:151–65. [DOI] [PubMed] [Google Scholar]
- 21. Kwan C, Ayhan B, Chen G, Wang J, Ji B, Chang CI. A novel approach for spectral unmixing, classification, and concentration estimation of chemical and biological agents. IEEE Trans Geosci Remote Sens. 2006;44:409–19. [Google Scholar]
- 22. Zhang C, Zhang K, Zhang J, Ou H, Duan J, Zhang S, et al. Skin delivery of hyaluronic acid by the combined use of sponge spicules and flexible liposomes. Biomater Sci. 2019;7:1299–310. [DOI] [PubMed] [Google Scholar]
- 23. Liu K, Chen X, Li L, Chen H, Ruan X, Liu W. A consensus successive projections algorithm – multiple linear regression method for analyzing near infrared spectra. Anal Chim Acta. 2015;858:16–23. [DOI] [PubMed] [Google Scholar]
- 24. Korkmaz M. A study over the general formula of regression sum of squares in multiple linear regression. Numer Meth Part Differ Equat. 2021;37:406–21. [Google Scholar]
- 25. Zhang Z, Chen S, Liang Y. Baseline correction using adaptive iteratively reweighted penalized least squares. Analyst. 2010;135:1138–46. [DOI] [PubMed] [Google Scholar]
- 26. Bakonyi M, Gácsi A, Kovács A, Szucs MB, Berkó S, Csányi E. Following‐up skin penetration of lidocaine from different vehicles by Raman spectroscopic mapping. J Pharmaceut Biomed. 2018;154:1–6. [DOI] [PubMed] [Google Scholar]
- 27. Zsikó S, Cutcher K, Kovács A, Budai‐Szucs M, Gácsi A, Baki G, et al. Nanostructured lipid carrier gel for the dermal application of lidocaine: comparison of skin penetration testing methods. Pharmaceut. 2019;11:310. [DOI] [PMC free article] [PubMed] [Google Scholar]
- 28. Bakonyia M, Berkóa S, Kovácsa A, Budai‐Szűcsa M, Kisa N, Erősb G, et al. Application of quality by design principles in the development and evaluation of semisolid drug carrier systems for the transdermal delivery of lidocaine. J Drug Deliv Sci Technol. 2018;44:136–45. [Google Scholar]
- 29. Hirata K, Mohammed D, Hadgraft J, Lane ME. Influence of lidocaine hydrochloride and penetration enhancers on the barrier function of human skin. Int J Pharmaceut. 2014;477:416–20. [DOI] [PubMed] [Google Scholar]
Associated Data
This section collects any data citations, data availability statements, or supplementary materials included in this article.
Data Availability Statement
The data that support the findings of this study are available from the corresponding author upon reasonable request.


