Abstract
Background
Skin quality improvement with hyaluronic acid microinjections is increasing as a clinical treatment indication and as a scientific issue. This present study assessed changes in biomechanical viscoelastic skin properties after microinjections with the skin quality booster CPM‐HA20G (Belotero Revive).
Materials and methods
Fifteen subjects have been randomized in a 2:1 ratio to receive either three treatments (total 3 ml per side) or a single‐dose treatment (total 1.5 ml per side) with CPM‐HA20G at dermal level into the lower cheeks via microinjections. Treatments were provided 4 weeks apart. Biophysical measurements were performed describing the viscoelastic skin properties and the underlying skin structure. The measurements were performed before injection (week 0) and on follow‐up visits 4, 8, 16, 24, and 36 weeks after the last injection treatment.
Results
One (p = 0.028) as well as three (p = 0.003) consecutive treatments with CPM‐HA20G improved statistically significant skin firmness (R0). For the multiple‐treatment group improved significant differences were observed for skin fatigue (R3; p = 0.007) and skin density (p = 0.017) with stable skin thickness levels (p > 0.05), too. There were zero‐to‐weak correlations between skin thickness and biomechanical skin properties (R0, r s = 0.084; R3, r s = 0.093).
Conclusion
Overall, microinjections with CPM‐HA20G improved biomechanical viscoelastic skin properties with a stronger and more pronounced effect in the multiple‐treatment group. The observed changes may explain some of the skin quality improvements observed after treatment with CPM‐HA20G.
Keywords: cohesive polydensified matrix, revitalization, skin elasticity, skin quality, skin quality booster, viscoelastic skin properties
1. INTRODUCTION
Skin quality is related to health, attractiveness, and youth and is intensively studied. 1 A recent publication validated a scientific scale of skin quality and defined six relevant parameters for aged female facial skin: elasticity, wrinkles, skin roughness, pigmentation, erythema, and pore size. Elasticity is showing one of the highest correlation coefficients. 2 A consensus of 10 dermatologists and esthetic physicians defined 4 key emergent skin quality categories: skin firmness, skin surface evenness, skin tone evenness, and skin glow. 3
Overall skin quality improvement is important for younger generations such as Generation Y as the first visible changes of aging are those that occur in skin surface and soft tissue. 4 , 5 Thus, not surprisingly, millennials are searching for treatments that improve skin quality. Microinjection treatments with a so‐called skin quality booster (SQB) containing hyaluronic acid (HA), some of which include glycerol, have been demonstrated to significantly improve skin quality. 6 , 7 , 8 , 9 , 10 Clinically improvements can be evaluated in the skin quality parameters: skin hydration, skin elasticity, skin roughness, and skin tone. 6 , 7 , 8 , 9 , 10 Combined HA with glycerol can also improve skin radiation in hemoglobin and melanin values. 9
SQBs must be differentiated in their indication from HA filler, as the SQBs are injected over a larger area into the skin without building up much volume. A cross‐linked SQB has relatively long durability within the tissue, whereby the hygroscopic property of HA can provide a moisture depot and thus improve cell turgor, tissue tension, and the physiological processes in the extracellular matrix. As a result of the improved physiological conditions within the tissue, stimulation of the in vivo collagen synthesis is discussed in studies as a possible mode of action due to fibroblast stimulation. 11 , 12 , 13 , 14
The skin structure, with its collagen and elastin fibers, is an important factor for the viscoelastic biomechanical behavior of the skin and for the measurement of skin elasticity. 8 Therefore, this study's aim was to evaluate further the effects of CPM‐HA20G, an SQB of cohesive polydensified matrix, on the skin structure and its viscoelastic behavior. So far, no relation of viscoelastic properties and fibroblast stimulation for CPM‐HA20G has been shown.
2. MATERIALS AND METHODS
The study was approved by the local ethics committee (EC Hamburg) and performed in accordance with the ICH‐GCP and EN ISO 14155. All study subjects provided written informed consent.
Biophysical measurements were performed according to recommendations by other authors and international guidelines for in vivo measurements. 8 , 15 , 16 , 17 , 18 , 19 , 20
2.1. Study design and population
Biophysical measurements were performed within an open‐label, multicenter, uncontrolled, and post‐market clinical follow‐up study to confirm the effectiveness and safety of CPM‐HA20G in facial skin revitalization and photodamaged skin treatment. Here, we evaluate separately single‐center data from the site University of Hamburg.
Eligible subjects who are to be enrolled to two treatment arms were healthy male or female, 25–45‐year old, with early signs of facial photodamaged skin in the lower cheek area. Excluded were subjects with actinically damaged skin, dermal fillers, or other cosmetic aesthetic procedures within the treatment area affecting the measurements. Six to eight visits, depending on the treatment arm, were carried out. A baseline visit before injection (week 0) and follow‐up visits 4, 8, 16, 24, and 36 weeks after the last injection treatment were performed.
2.2. Investigational medical device and treatment arms
The medical device CPM‐HA20G (Belotero Revive, Merz Pharmaceuticals GmbH, Frankfurt, Germany) is an injectable HA gel applied in aesthetic dermatology for skin quality improvement. The HA is nonanimal derived from Streptococcus equi, and the gel is cross‐linked with 1, 4‐butanediol diglycidyl ether, containing 20 mg/ml HA and 17.5 mg/ml glycerol of nonanimal origin.
A serial micropuncture technique with a 30‐G Mesoram needle, 0.3 × 4 mm (RI.MOS. SRL, Mirandola, Italy) was applied for injection into dermal to immediate subdermal planes of the lower cheeks. The injection points, each of 0.05 ml, were evenly distributed over the treatment area (Figure 1). Subjects in treatment arm one received three bilateral injection treatments, 4 weeks apart, with a total injection volume of 3 ml per side. Each treatment consisted of up to 20 injection points per side using 1 ml CPM‐HA20G. Subjects in treatment arm two received one bilateral injection treatment with half in total injection volume, which consisted of up to 30 injection points per side using 1.5 ml CPM‐HA20G. Subjects in treatment arm two received a different dose compared to subjects in treatment group one, to assess how treatment volume and number of treatment sessions influence therapeutic outcome.
FIGURE 1.

Lower cheek treatment and measurement area: (A) treatment area and injection scheme of treatment arm two (1 bilateral injection treatment, up to 30 injection points); (B) treatment area and injection scheme of treatment arm one (3 bilateral injection treatments, up to 20 injection points); (C) measurement area for biophysical measurements
2.3. Standardization of biophysical skin measurements
The laboratory environment was controlled and standardized. The temperature was kept at 20–22°C and the humidity at 40%–60%, with a 15–30 min acclimatization phase. The subjects were instructed not to apply cleansing products or water for 6 h, or any skincare product on their faces for 12 h, prior to measurements. With anatomical orientation points, the measurement area was marked before each visit. A line was drawn from the center of the tragus to the corner of the mouth. This length was divided by three to obtain the subdivision of the measurement areas (Figure 1C). The assessments were performed with each subjects’ supine position, muscle relaxation, randomized body half, measurement area, and order kept constant for all visits. Prior to the treatment and on follow‐up visits, suction method assessments were performed before sonographic ones. The face was rotated contralaterally until the measurement probe could be placed on a planar area.
2.4. Biophysical measurements
The Cutometer dual MPA 580 (Courage+Khazaka Electronic GmbH, Cologne, Germany) operates according to the suction method, described elsewhere, 8 , 15 , 16 , 19 , 20 , 21 which was used to assess the biomechanical properties of the skin. A single measurement was performed for the left or right cheek, and a second measurement was done in the case of visible interfering factors in the curve progression, given in a time–strain mode (Figure 2).
FIGURE 2.
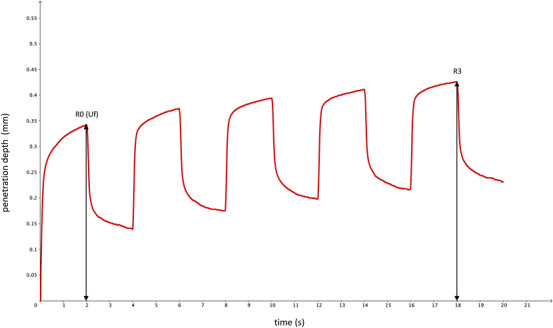
Typical time–strain curve progression with marked analyzed parameters
The device settings of the present study were consistent with those of previous studies on biomechanical properties and skin aging. 8 , 20 , 21 With a 2 mm diameter probe and a negative pressure force of 450 mbar, the skin could be moved into and out of the probe in five repetition cycles with an overall measurement time of 20 s. The skin was extended in each cycle for a 2 s suction time and could relax in a 2 s relaxation time. Parameters chosen for the determination of viscoelastic properties were the maximum extension amplitude in the first cycle (R0, Uf) and the last maximum amplitude of the last cycle (R3) (Table 1).
TABLE 1.
Overview of chosen biomechanical property parameters, their interpretation and relationship with the viscoelastic skin properties
| Units | Nomenclature by Agache et al. 15 , 19 | Cutometer parameter | Relationship between Cutometer R values and viscoelastic skin properties |
|---|---|---|---|
| mm | Uf | R0 |
Skin firmness: maximum amplitude; the lower the R0 value, the firmer the skin The R0 value shows the maximum distensibility of the skin into the measurement probe during the suction phase The lower the R0 value, the better the ability to resist suction and the firmer the skin |
| mm | R3 |
Skin fatigue: last maximum amplitude of repeated suction; the lower the R3 value, the less fatigued the skin The R3 value shows the maximum distensibility of the skin into the measurement probe during the last repeated suction phase. As the amplitude increases with each repetition due to skin fatigue, lower R3 values show less fatigued skin |
As skin elasticity is affected by skin thickness, 8 , 19 , 20 measurements of skin thickness and density were performed with DUB SkinScanner system (taberna pro medicum, Lüneburg, Germany). The basic principle of sonography is the pulse‐echo method, as described elsewhere. 22 , 23 , 24 A 22‐MHz transducer with an axial penetration depth of 4 mm and an amplification of 44 dB was used as the standardized device setting for this investigation. The scan width of 12.8 mm and step width of 33 μm were given by the transducer. A single measurement was performed, and a measurement repetition was done in the case of visible interfering factors in B‐Scan mode.
With the automatic skin analysis of the provided software, skin thickness (μm) and skin density (arbitrary units) were analyzed within the typical position of vertical and horizontal lines as visible in Figure 3. For each automatic evaluation, the automatically set measurement lines were checked by the same investigator for correctness and if necessary, adjusted manually.
FIGURE 3.
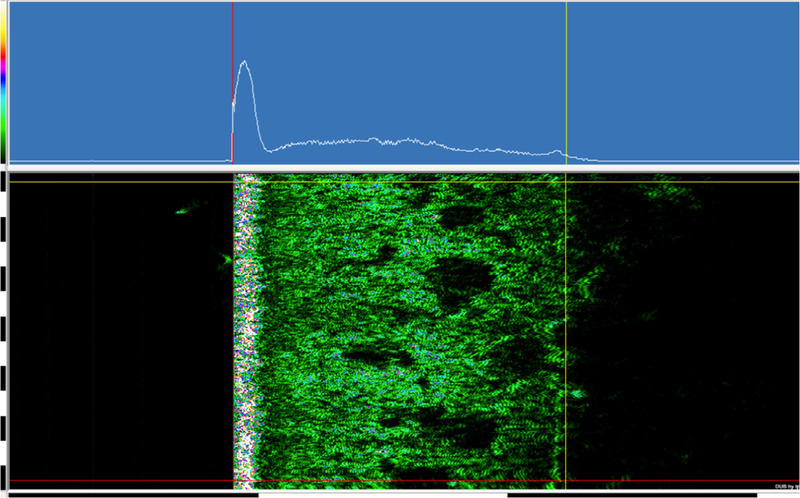
A 22‐MHz DUB SkinScanner automatic skin analysis measurement lines position, within the A‐scan in the top line (white graph, blue background) and the two‐dimensional multicolor B‐scan of the A scans below
2.5. Data analysis
Statistical analysis was performed with the SPSS package version 26 (IBM Corp., Armonk, NY, USA). As part of the descriptive data evaluation, arithmetic mean values (M) for each visit and treatment arm were calculated with their standard deviations (SD). Missing values will not be imputed, leading to case exclusion. In an exploratory dependency analysis, differences were assessed with a two‐tailed statistical test, and a significance level of 5% (p ≤ 0.05). For this purpose, statistical significance (p) values were given.
For statistical evaluation of dependent variables over time the parametric test repeated measures analysis of variance was carried out for all visits. If sphericity was not assumed, Greenhouse–Geisser corrected p values were given. The post hoc test was then carried out with Bonferroni‐corrected p values.
For the independent variables, a pairwise t‐test was performed for the two treatment arms with their delta values between two visits (baseline and week 16). If the requirements for a parametric test were not met with the Shapiro–Wilk test, the nonparametric test Mann–Whitney U was carried out.
In order to evaluate undirected relationships between variables of biomechanical properties and skin structure parameters, Spearman rank correlation was performed. For this purpose, Spearman's‐rho correlation coefficient (r s) was interpreted according to Dancey and Reidy, and their p values were given. 25
3. RESULTS
Overall, 26 subjects were enrolled at the study site, 25 women and 1 man. Because of the gender‐related significant differences in the measurement parameters, 21 only data of fertile female subjects of Fitzpatrick skin type II–V were evaluated for this investigation. Therefore, a total of 15 complete subject data sets were included in the statistical evaluation. Five subjects with a mean age of 42 (±2) years and a mean body mass index (BMI) of 24 (±4) kg/m2 received a single treatment. Multiple treatments were received by 10 subjects with a mean age of 34 (±6) years and a mean BMI of 23 (±4) kg/m2.
The average room temperature was 20.1 ± 0.4°C and the average relative humidity was 53.7% ± 3.3% for all measurements.
3.1. Correlations between skin structure and biomechanical properties
There were no significant correlations for skin thickness or skin density with the skin's biomechanical properties. The correlation coefficients are shown in Table 2. The effect size was zero to weak.
TABLE 2.
Spearman‐rho correlation coefficients of skin structure and biomechanical parameters (n = 90)
| R0 (Uf) | R3 | |
|---|---|---|
| Skin thickness | 0.084 | 0.093 |
| Skin density | −0.173 | −0.180 |
A moderate significantly negative correlation (r s: −0.520, p ≤ 0.001, n = 90) could be found between skin thickness and skin density over study time of 6 timepoints for all 15 subjects and each treatment group (single: r s = −0.483, p ≤ 0.007, n = 30, multiple: r s = −0.560, p ≤ 0.000, n = 60) over 6 timepoints (Figure 4).
FIGURE 4.
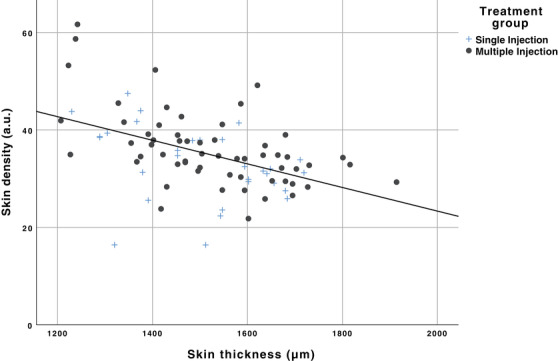
Scatterplot of skin thickness (μm) and skin density (a.u.) shows a moderate significant negative correlation (r s: −0.520, p ≤ 0.001, n = 90) over 6 timepoints for all 15 subjects and for each treatment group over 6 timepoints (single: r s = −0.483, p ≤ 0.007, n = 30, multiple: r s = −0.560, and p ≤ 0.000, n = 60)
3.2. Biomechanical properties
Skin firmness measured by the Cutometer parameter R0 (Uf) showed a statistically significant difference between the multiple‐treatment group measurements over study time (p = 0.003). This was also confirmed for the single‐treatment group (p = 0.028). Pairwise comparisons showed that skin firmness parameter was significantly lower after multiple injections (p = 0.014) in week 16 (M = 0.346 ± 0.061 mm) than in the baseline visit (M = 0.406 ± 0.089 mm), and after a single injection significantly (p = 0.020) lower in week 36 (M = 0.302 ± 0.049 mm) than in week 4 (M = 0.347 ± 0.041 mm), as shown in Figure 5A.
FIGURE 5.
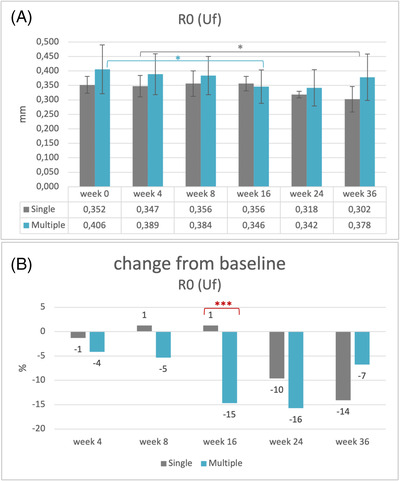
Skin firmness (R0, Uf): (A) mean values and their standard deviations, baseline visit before injection (week 0) and follow‐up visits after injection (weeks 4–36). Statistically significant: *p = 0.014: multiple‐injection values of baseline versus week 16, *p = 0.020: single‐injection values week 4 versus week 16 (n = 15). (B) Change (%) of mean values after injection in comparison with baseline (week 0). Statistically significant: ***p = 0.001: multiple‐ versus single‐injection group (n = 15)
Between the two treatment groups, a significant difference was observed (p = 0.001). Skin firmness parameter of the single‐treatment group increased 1% from baseline to week 16, whereas for the multiple‐treatment group decreased 15%, as shown in Figure 5B.
Skin fatigue parameter R3 showed a statistically significant difference among the multiple‐treatment group's measurements over the study period (p = 0.007). Pairwise comparisons showed that skin fatigue parameter was significantly lower after multiple injections (p = 0.019) in week 16 (M = 0.391 ± 0.064 mm) than in the baseline visit (M = 0.449 ± 0.095 mm), as shown in Figure 6A.
FIGURE 6.
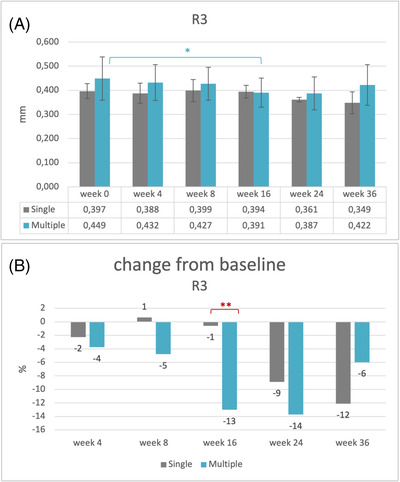
Skin fatigue (R3): (A) mean values and their standard deviations, baseline visit before injection (week 0) and follow‐up visits after injection (weeks 4–36). Statistically significant: *p = 0.019: multiple‐injection values of baseline versus week 16 (n = 15). (B) Change (%) of mean values after injection in comparison with baseline (week 0). Statistically significant: **p = 0.002: multiple‐ versus single‐injection group (n = 15)
Between the two treatment groups, a significant difference was observed (p = 0.002). Skin fatigue parameter of the single‐treatment group decreased 1% from baseline to week 16, whereas for the multiple‐treatment group it decreased 13%, as shown in Figure 6B.
3.3. Skin structure
There were no statistically significant differences determined for the skin thickness over the study period. Skin density showed increasing values for both treatment groups over the study period. A statistically significant difference for the multiple‐treatment group over the study duration (p = 0.017) was observed, whereas post hoc test could not show between which timepoints. Skin density increased 22% in week 24 (M = 39 ± 8.9) and 36 (M = 39 ± 7.8) compared to the baseline visit (M = 32 ± 5.8).
A pairwise comparison for skin density and skin thickness found no statistically significant differences between the two‐treatment groups. Varying M values and SD are presented in Figures 7 and 8.
FIGURE 7.
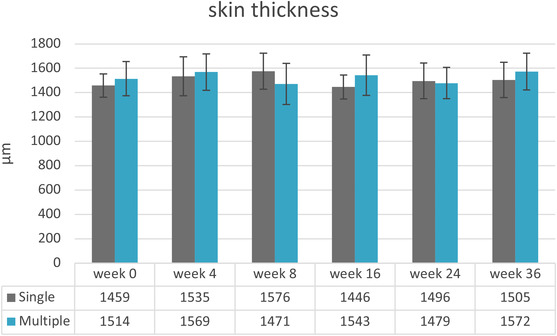
Mean values and their standard deviations for skin thickness (n = 15). Baseline visit before injection (week 0) and follow‐up visits after injection (weeks 4–36)
FIGURE 8.
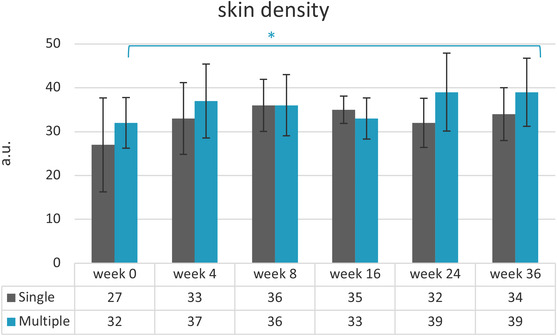
Mean values and their standard deviations for skin density. Baseline visit before injection (week 0) and follow‐up visits after injection (weeks 4–36). *p = 0.017: multiple‐injection values over study duration (n = 15)
4. DISCUSSION
As skin quality is an increasing treatment indication, new scientific data are needed. A recent publication pointed out that elasticity is showing one of the highest correlation coefficients on skin quality. 2 As the skin is not purely elastic but also has viscous properties, the biomechanical properties of the skin can best be studied by viscoelastic parameters containing both components. Therefore, viscoelastic skin properties are relevant parameters objectifying the outcome of skin quality improvement treatments, as after HA microinjections. A consensus paper on skin quality is stating that skin firmness is one of the four most important perceptual categories of skin quality. 3 Skin firmness is a parameter describing not only the elastic properties but the viscoelastic ones. Improved skin hydration and elasticity have already been discussed for microinjection treatment with CPM‐HA20G. 9 The ancillary function of glycerol in CPM‐HA20G provides an enhanced and earlier onset of skin hydrating effect as already investigated by Hertz–Kleptow et al. 9 Other cross‐linked HA SQB products do not purpose glycerol as an additional additive. 26
As skin viscoelasticity is influenced by the skin structure and its fibers, 8 this study aimed to investigate the in vivo effects of CPM‐HA20G, an SQB, on the viscoelastic biomechanical skin properties as they relate to skin structure. To gain deeper insight into skin viscoelasticity parameters, skin firmness (R0, Uf) and skin fatigue (R3) were measured together with skin thickness and skin density.
As recommended recently by the European Group on Efficacy Measurement and Evaluation of Cosmetics and other Products, laboratory, device, and subject conditions were controlled and remained constant. 15 Differences in gender, age, and BMI may influence the viscoelastic biomechanical skin properties, 15 but genders and BMI were comparable for both treatment groups in this investigation. The mean age of the single treatment group was higher (M = 42, SD = 2) than in the multiple‐treatment group (M = 34, SD = 6), this might have led to different baseline values for the two groups. 21 Therefore, delta values were used for comparing them.
In previous publications, the correlation between skin thickness and the absolute parameters of biomechanical skin properties were highlighted, and normalization to a standardized 1 mm skin thickness or to ultrasonographically evaluated skin thickness was recommended and performed. 8 , 19 , 20 , 27 , 28 Hence, as no correlation was found between those parameters this was not needed in this investigation (Table 2). Also, a recent publication hypothesized that the superficial layer thickness might be linked to the density of the extracellular matrix, with thinner layers corresponding to higher density, resulting in stiffer biomechanical behavior. 29 The authors assumed that normalization of skin thickness would overestimate the dependence in the analysis of biomechanical skin properties. 29 The hypothesis of a negative correlation between skin thickness and density could be also observed in our statistically significant moderate negative correlation for skin thickness and skin density over study time (Figure 4). Furthermore, as skin thickness remained almost constant over the study's duration, microinjection treatments with CPM‐HA20G do not build up volume but just improve skin quality by improving viscoelastic properties, skin smoothness, skin hydration, and skin radiance.
The intended effect of microinjection treatment with HA is focusing not only on hydration but also on stimulating fibroblasts’ activity. Because biomechanical behavior of the skin is not purely elastic, but viscoelastic the typical curve progression can be related to the skin fibers. As previously described in the literature, the elastin fibers are related to the linear‐elastic portion of the suction and relaxation curve, and the collagen fibers are related to the viscoelastic curve progression. 8 For better comparison, both the R‐parameter nomenclature of the device manufacturer and where applicable the U‐nomenclature proposed by Agache et al. are mentioned (Table 1). 19 As recommended by several publications, absolute parameters were measured: Total extensibility (elastic and viscoelastic strain) was investigated as skin firmness parameter R0 (Uf) in mm. 15 , 19 , 21 The last maximum amplitude (elastic and viscoelastic strain) after five cycles was measured as the skin fatigue parameter R3 in mm. 8 Both suction phase parameters R0 (Uf) and R3 showed almost continuously decreasing values that in turn is an improvement in skin firmness and skin fatigue. The results are in accordance with the previous study using the CPM‐HA20G. 9 Similarly, for an SQB with different manufacturing technology, named nonanimal Stabilized Hyaluronic Acid (NASHA), these parameters were improved over the study period. 8 Previous studies on CPM‐HA20G and NASHA also showed increasing improvements for gross elasticity. 6 , 8 , 9 It should be mentioned that these studies also investigated the lower cheek area of female subjects with a similar Cutometer measurement protocol.
The parameter of skin firmness (R0, Uf) and skin fatigue (R3) showed that after multiple microinjections with CPM‐HA20G, the skin had a greater ability to resist the suction and was less tired after repeated suctions (Figures 5 and 6). The treatment goal of improved skin quality in viscoelastic properties was confirmed.
Of special importance for clinical recommendations and use is the fact that three consecutive treatments—4 weeks apart—resulted in a stronger and more pronounced treatment response as compared to a single treatment. Clinically speaking, a single treatment can be recommended for patients with a mild loss of skin elasticity and firmness, whereas patients with a more pronounced decrease in viscoelastic properties should be treated with three consecutive treatment sessions to gradually improve skin fatigue and firmness.
Several hypotheses can explain the results described. An important factor for the improved skin firmness parameter R0 (Uf) and skin fatigue parameter R3 could be the hygroscopic characteristic of HA and the hydrophilic characteristic of glycerol, providing a moisture depot and thus improve the cell turgor, tissue tension, and physiological processes in the extracellular matrix. 8 , 9 Considering that the CPM‐HA20G is a viscoelastic fluid in its rheological characteristics, where the viscous properties (G″) exceed the elastic properties (G′), 26 it could be assumed that these predominantly viscous properties were measured within the tissue by the suction method and therefore may influence the measured biophysical viscoelastic parameters.
The skin density data contradict this assumption. The stronger the reflection of the ultrasound, the higher the echogenicity of the skin layer. The structures of the epidermis and dermis have high echogenicity, whereas adipose tissue and injected HA have low echogenicity and low skin density. 22 , 23 , 24 An isoechoic signal after HA injections could indicate good tissue integration. 30 The CPM‐HA20G microinjection treatment showed no isoechoic signal and did not decrease the skin density as might be expected. In contrast, increasing skin density values of 22% were observed for the multiple‐treatment group in long‐term effect (Figure 8). As commonly known, in the extracellular matrix collagen fibers have a faster turnover than elastin fibers; thus it can be assumed that collagen causes this change in skin density. Increased collagen could therefore explain the significantly improved skin firmness parameter R0 (Uf) and skin fatigue parameter (R3).
Stimulation of the in vivo collagen synthesis after HA injections has been previously reported and matches the present study's results. 11 , 12 , 13 , 14
5. CONCLUSION
It is recommended that the statistical correlation between biophysical viscoelastic parameters and skin depth be verified before their normalization. If this correlation is not present for the study data, normalization is not suggested. In this investigation, normalization was not needed for the evaluation of the viscoelastic skin properties.
CPM‐HA20G microinjection treatment can improve skin quality by altering viscoelastic skin properties and skin density. The multiple‐injection treatments showed a stronger, significant improvement in skin firmness (R0, Uf), and skin fatigue (R3) than the single‐treatment group.
In summary, for clinical use, a single injection treatment is recommended for skin with a good skin quality condition and only a slight need for optimization, with another treatment after 24–36 weeks. For skin with a more pronounced need for skin quality improvement, a multiple‐microinjection treatment is recommended, with a touch‐up treatment after 64 weeks.
Further ex vivo studies with biomarkers of the extracellular matrix are needed to better understand the causal physiological processes of these outcomes. The main limitation of the study is the single‐center data with a limited number of subjects suitable for statistical analysis. To substantially support the results, further in vivo studies with a multicenter data analysis and a larger study population are mandatory. Furthermore, comparisons between cross‐linked and non‐cross‐linked HA products with similar injection protocols and measurement conditions would be of scientific interest.
CONFLICT OF INTEREST
Matthias Hofmann is an employee of Merz Pharmaceuticals GmbH.
Kleine‐Börger L, Hofmann M, Kerscher M. Microinjections with hyaluronic acid in combination with glycerol: How do they influence biophysical viscoelastic skin properties? Skin Res Technol. 2022;28:633–642. 10.1111/srt.13167
Contributor Information
Linda Kleine‐Börger, Email: linda.kleine-boerger@uni-hamburg.de.
Martina Kerscher, Email: martina.kerscher@uni-hamburg.de.
DATA AVAILABILITY STATEMENT
The data that support the findings of this study are available from the corresponding author upon reasonable request.
REFERENCES
- 1. Fink B, Prager M. The effect of incobotulinumtoxin A and dermal filler treatment on perception of age, health, and attractiveness of female faces. J Clin Aesthet Dermatol. 2014;7(1):36‐40. [PMC free article] [PubMed] [Google Scholar]
- 2. Eiben‐Nielson C, Kerscher M. Development and validation of a global photonumeric scale for evaluating skin quality of aged female facial skin. J Cosmet Dermatol. 2021;20:4032‐4039. [DOI] [PubMed] [Google Scholar]
- 3. Goldie K, Kerscher M, Fabi SG, et al. Skin quality – a holistic 360° view: consensus results. Clin Cosmet Investig Dermatol. 2021;14:643‐654. [DOI] [PMC free article] [PubMed] [Google Scholar]
- 4. Castelo‐Branco C, Pons F, Gratacós E, Fortuny A, Vanrell JA, González‐Merlo J. Relationship between skin collagen and bone changes during aging. Maturitas. 1994;18(3):199‐206. [DOI] [PubMed] [Google Scholar]
- 5. Cotofana S, Fratila AAM, Schenck TL, Redka‐Swoboda W, Zilinsky I, Pavicic T. The anatomy of the aging face: a review. Facial Plast Surg. 2016;32(3):253‐260. [DOI] [PubMed] [Google Scholar]
- 6. Kerscher M, Bayrhammer J, Reuther T. Rejuvenating influence of a stabilized hyaluronic acid‐based gel of nonanimal origin on facial skin aging. Dermatol Surg. 2008;34(5):720‐726. [DOI] [PubMed] [Google Scholar]
- 7. Distante F, Pagani V, Bonfigli A. Stabilized hyaluronic acid of non‐animal origin for rejuvenating the skin of the upper arm. Dermatol Surg. 2009;35(1):389‐394. [DOI] [PubMed] [Google Scholar]
- 8. Reuther T, Bayrhammer J, Kerscher M. Effects of a three‐session skin rejuvenation treatment using stabilized hyaluronic acid‐based gel of non‐animal origin on skin elasticity: a pilot study. Arch Dermatol Res. 2010;302(1):37‐45. [DOI] [PubMed] [Google Scholar]
- 9. Hertz‐Kleptow D, Hanschmann A, Hofmann M, Reuther T, Kerscher M. Facial skin revitalization with CPM®‐HA20G: an effective and safe early intervention treatment. Clin Cosmet Investig Dermatol. 2019;12:563‐572. [DOI] [PMC free article] [PubMed] [Google Scholar]
- 10. Niforos F, Ogilvie P, Cavallini M, et al. VYC‐12 injectable gel is safe and effective for improvement of facial skin topography: a prospective study. Clin Cosmet Investig Dermatol. 2019;12:791‐798. [DOI] [PMC free article] [PubMed] [Google Scholar]
- 11. Tran C, Carraux P, Micheels P, Kaya G, Salomon D. In vivo bio‐integration of three hyaluronic acid fillers in human skin: a histological study. Dermatology (Basel Switzerland). 2014;228(1):47‐54. [DOI] [PubMed] [Google Scholar]
- 12. Quan T, Wang F, Shao Y, et al. Enhancing structural support of the dermal microenvironment activates fibroblasts, endothelial cells and keratinocytes in aged human skin in vivo. J Invest Dermatol. 2013;133(3):658‐667. [DOI] [PMC free article] [PubMed] [Google Scholar]
- 13. Turlier V, Delalleau A, Casas C, et al. Association between collagen production and mechanical stretching in dermal extracellular matrix: In vivo effect of cross‐linked hyaluronic acid filler. A randomised, placebo‐controlled study. J Dermatol Sci. 2013;69(3):187‐194. [DOI] [PubMed] [Google Scholar]
- 14. Wang F, Garza LA, Kang S, et al. In vivo stimulation of de novo collagen production caused by cross‐linked hyaluronic acid dermal filler injections in photodamaged human skin. Arch Dermatol. 2007;143(2):155‐163. [DOI] [PubMed] [Google Scholar]
- 15. Monteiro Rodrigues L, Fluhr JW; the EEMCO Group . EEMCO Guidance for the in vivo assessment of biomechanical properties of the human skin and its annexes: revisiting instrumentation and test modes. Skin Pharmacol Physiol. 2020;33(1):44‐60. [DOI] [PubMed] [Google Scholar]
- 16. Rodrigues L; European Group for Efficacy Measurements on Cosmetics and Other Topical Products (EEMCO) . EEMCO guidance to the in vivo assessment of tensile functional properties of the skin. Part 2: instrumentation and test modes. Skin Pharmacol Appl Skin Physiol. 2001;14:52‐67. [DOI] [PubMed] [Google Scholar]
- 17. Du Plessis J, Stefaniak A, Eloff F, et al. International guidelines for the in vivo assessment of skin properties in non‐clinical settings: Part 2. Transepidermal water loss and skin hydration. Skin Res Technol. 2013;19(3):265‐278. [DOI] [PMC free article] [PubMed] [Google Scholar]
- 18. Berardesca E; European Group for Efficacy Measurements on Cosmetics and Other Topical Products (EEMCO) . EEMCO guidance for the assessment of stratum corneum hydration: electrical methods. Skin Res Technol. 1997;3(2):126‐132. [DOI] [PubMed] [Google Scholar]
- 19. Agache PG, Monneur C, Leveque JL, De Rigal J. Mechanical properties and Young's modulus of human skin in vivo. Arch Dermatol Res. 1980;269(3):221‐232. [DOI] [PubMed] [Google Scholar]
- 20. Krueger N, Luebberding S, Oltmer M, Streker M, Kerscher M. Age‐related changes in skin mechanical properties: a quantitative evaluation of 120 female subjects. Skin Res Technol. 2011;17(2):141‐148. [DOI] [PubMed] [Google Scholar]
- 21. Luebberding S, Krueger N, Kerscher M. Mechanical properties of human skin in vivo: a comparative evaluation in 300 men and women. Skin Res Technol. 2014;20(2):127‐135. [DOI] [PubMed] [Google Scholar]
- 22. Serup J, Jemec GBE, Grove GL, eds. High‐frequency ultrasound examination of skin: introduction and guide. In: Handbook of Non‐Invasive Methods and the Skin. 2nd ed. CRC Press; 2006:473‐491. [Google Scholar]
- 23. Dill‐Müller D, Maschke J. Ultrasonography in dermatology. J Dtsch Dermatol Ges. 2007;5(8):689–707. [DOI] [PubMed] [Google Scholar]
- 24. Ulrich J, Voit MS, Jenderka KV, Voit C. Sonographic diagnostics in dermatology. J Dtsch Dermatol Ges. 2014;12(12):1083‐1099. [DOI] [PubMed] [Google Scholar]
- 25. Akoglu H. User's guide to correlation coefficients. Turk J Emerg Med. 2018;18(3):91‐93. [DOI] [PMC free article] [PubMed] [Google Scholar]
- 26. Kleine‐Börger L, Kalies A, Meyer RM, Kerscher M. Physicochemical properties of injectable hyaluronic acid: skin quality boosters. Macromol Mater Eng. 2021;306:2100134. [DOI] [PubMed] [Google Scholar]
- 27. Escoffier C, de Rigal J, Rochefort A, Vasselet R, Lévêque JL, Agache PG. Age‐related mechanical properties of human skin: an in vivo study. J Invest Dermatol. 1989;93(3):353‐357. [PubMed] [Google Scholar]
- 28. Barel AO, Lambrecht R, Clarys P. Mechanical function of the skin: state of the art. Curr Probl Dermatol. 1998;26:69‐83. [DOI] [PubMed] [Google Scholar]
- 29. Pensalfini M, Weickenmeier J, Rominger M, Santoprete R, Distler O, Mazza E. Location‐specific mechanical response and morphology of facial soft tissues. J Mech Behav Biomed Mater. 2018;78:108‐115. [DOI] [PubMed] [Google Scholar]
- 30. Micheels P, Besse S, Flynn TC, Sarazin D, Elbaz Y. Superficial dermal injection of hyaluronic acid soft tissue fillers: comparative ultrasound study. Dermatol Surg. 2012;38:1162‐1169. [DOI] [PubMed] [Google Scholar]
Associated Data
This section collects any data citations, data availability statements, or supplementary materials included in this article.
Data Availability Statement
The data that support the findings of this study are available from the corresponding author upon reasonable request.


