Abstract
The aim of this study was to build a prognostic model for endometrial cancer (EC) patients based on RNA-binding proteins (RBPs). RNA sequencing and clinical data for uterine corpus EC (UCEC) were obtained from The Cancer Genome Atlas (TCGA). Univariate and multivariate Cox regression analysis were used to obtain the following risk formula: score = sum (corresponding coefficient × expression of each gene). A nomogram was developed to accurately predict patient survival based on risk score, age, stage, and grade. Immunohistochemistry (IHC) was used to verify the expression of RBPs in EC. The mRNA expression of RBPs was measured by qRT-PCR. The effects of RBPs on the malignant biologic behavior of EC were detected using CCK-8, colony formation, and transwell invasion assays. A novel prognostic signature was constructed, comprising three RBPs (CD3EAP, SBDS, and TDRKH). The risk score was: Risk score = (0.860 × CD3EAP expression) + (0.622 × 6SBDS expression) + (0.427 × 4TDRKH expression). The area under the receiver operating characteristic curves (AUCs) of risk score for 1-, 3-, and 5-year overall survival (OS) was 0.75, 0.68, and 0.65, respectively. The AUCs of the nomogram for 1-, 3-, and 5-year OS were 0.811, 0.793, and 0.814, respectively. In our independent cohort, the IHC results revealed that CD3EAP (P < 0.001) and TDRKH (P < 0.001) were upregulated and SBDS (P < 0.001) was downregulated in EC. Immunostaining showed the expression levels of CD3EAP, SBDS and TDRKH for each patient and these were multiplied by their respective coefficients of 0.860, 0.622 and 0.427 to obtain the risk scores. The AUCs of risk score for 1-, 3-, and 5-year OS were 0.888, 0.793, and 0.780 respectively. The AUCs of the nomogram for 1-, 3-, and 5-year OS were 0.790, 0.826, and 0.906, respectively. Cell functional experiments also confirmed the influence of the key RBPs on the malignant biologic behavior of EC. In summary, a characteristic model based on our three RBPs accurately predicted the prognosis of EC. Our in-depth analysis of these RBPs may inform the development of novel strategies for the diagnosis and treatment of EC.
Keywords: Endometrial carcinoma (EC), RNA-binding proteins (RBPs), prognostic model
Introduction
Endometrial cancer (EC) is the most common gynecologic cancer in the United States, Europe, and other developed countries [1,2]. Currently, surgical treatment is used in the early stages; in the late stages, surgical treatment is combined with other adjuvant treatments [3]. However, EC cells in the late stages are highly invasive and can easily migrate [4]. If EC is best diagnosed and treated in the early stage, since the five-year survival rate for advanced EC drops from 95% in its early stages [5,6]. Therefore, it is important to identify novel diagnostic, therapeutic, and prognostic molecular biomarkers for EC.
RNA-binding proteins (RBPs) are proteins that modulate post-transcriptional regulation by combining with various types of RNA. There are 1542 human RBPs [6]. Previous studies have demonstrated that RBPs affect cellular physiological and pathological processes by regulating RNA stability, selective splicing, localization, translation, and modification [7,8]. In addition, some studies have shown that RBPs can regulate gene transcription by binding to chromatin [9]. Moreover, the dysregulation of RBPs causes changes in many cellular functions, affecting the expression of proto-oncogenes and anti-oncogenes and thus promoting the development of tumors [10]. However, the biological and clinical characteristics of RBPs in ECs have not been systematically explored. Therefore, a comprehensive analysis of RBPs in ECs is needed to improve the treatment.
In this study, the RNA sequencing dataset and clinical information from patients with uterine corpus EC (UCEC) were downloaded from The Cancer Genome Atlas (TCGA) database. We then performed differential analysis of the 1542 RBPs. Possible prognostic RBPs were identified by adopting univariate Cox regression analysis. A multivariate Cox proportional hazards regression model was created to predict patient prognosis. In addition, single-factor and multiple-factor independent prognostic analyses were used to verify the accuracy of the model in the test group. Finally, a nomogram was plotted to quantitatively predict patient outcomes in clinical practice, and we further explored the functions of individual genes in the prognostic model. A three-protein signature was validated by immunohistochemistry (IHC) in an independent cohort. Cell functional experiments also confirmed the influence of key RBPs on EC malignant biologic behavior. Our findings promote a deeper understanding of EC progression and may inform the development of more precise immunotherapy.
Materials and methods
Human tissue specimens
We obtained 34 normal endometrial tissues and 71 EC tissues from Shengjing Hospital of China Medical University, China, from 2019 to 2021. All patients signed informed consent. The pathologic type of all cases of EC was endometrial adenocarcinoma. Two skilled pathologists made the pathological diagnosis of EC (FIGO 2009). No patients received hormones, radiotherapy, chemotherapy, or treatment before surgery. The 71 patients with EC were followed up to October 20, 2021.
IHC
Endometrial tissues were processed into five-micrometer-thick sections. Streptavidin-peroxidase (SP) method was used to detect the expression of CD3EAP, SBDS and TDRKH. We performed the experiments according to the instructions for using the IHC kit (Maixin, Fujian, China). Slides were incubated with the primary antibody CD3EAP (Abcepta, o15446, 1:100), SBDS (Proteintech, #17618-1-AP, 1:100) and TDRKH (Proteintech, #13528-1-AP, 1:100) at 4° overnight, respectively. Then slides were rinsed with PBS, secondary antibody and DAB (Maixin, Fujian, China) were used for the next experiment. Based on staining intensity (negative = 0, weak = 1, moderate = 2, strong = 3) and the proportion of immunoreactive tumor cells (< 5% = 0, 5-25% = 1, 25-50% = 2, 50-75% = 3, > 75% = 4), CD3EAP, SBDS, and TDRKH immunoreactivity was graded. The final immunohistochemistry score was calculated by multiplying the two scores. It was divided into four categories: 0 (-), 1-4 (+), 5-8 (+++), and 9-12 (+++). Samples scoring under 4 were deemed to have low expression, and samples scoring over 4 were deemed to have high expression.
Immunofluorescence (IF)
For IF assay, Ishikawa cells were treated with antibody against CD3EAP (Abcepta, o15446, 1:100), SBDS (Proteintech, #17618-1-AP, 1:100) and TDRKH (Proteintech, #13528-1-AP, 1:100) for 2 h then labeled with Alexa 488-conjugated secondary antibody (1:400) for 1 h. Ishikawa cells’ nucleus were then labeled with 4’,6-diamidino-2-phenylindole (DAPI, Beyotime, China).
Transfection of cells
SiRNA sequences targeting CD3EAP, SBDS and TDRKH, and their respective negative control (NC) counterparts were purchased from GenePharma (Shanghai, China). Sequences of siRNA are listed in Table S1. Lipofectamine 3000 (Invitrogen) was used to transfect cells with siRNA for the following experiments.
qRT-PCR
Total RNA were extracted with TRIzol reagent (Vazyme, Nanjing, China). Prime Script RT-polymerase (Transgen, Beijing, China) were used to synthesize cDNAs. SYBR Green Premix (Transgen) with specific PCR primers (Sangon, Shanghai, China) used to detect corresponding gene RNA. Sequences of primers are shown in Table S2. Fold-change was calculated by 2-ΔΔCT method.
Cell culture
Ishikawa cells were cultured with RPMI 1640 (Gibco, Carlsbad, CA, USA). 1% penicillin-streptomycin and 10% fetal bovine serum (FBS) (Gibco) were added to the medium of the cells. At 37 degrees Celsius and 5% CO2, all cells were grown in a humidified incubator.
Colony formation assay
Cells (1000/well) were added to each well and cultured for two weeks to examine the effects of CD3EAP, SBDS, and TDRKH expression on cell proliferation. 0.1% crystal violet was used to stain the cells. Light microscopy was then used to count the colonies.
CCK-8 assay
Ishikawa cells were seeded in 96-well plates. CCK-8 reagent (10 µL) (Dojindo, Japan) was added to each well. The microplate reader was used to measure OD450 values of each well at 0 h, 24 h, 48 h, and 72 h after treatment.
Cell invasion assay
Cell invasion was discovered using Transwell chambers (Corning, NY, USA) with 8-micrometer hole sizes. 200 μl of serum-free media with cells were added to the upper chamber, and the chambers were then precoated with Matrigel solution (BD, Franklin Lakes, NJ, USA). 10% FBS medium was present in the bottom chamber. Infected cells on the bottom membrane surface were fixed with 4% paraformaldehyde and stained with 0.1% crystal violet after a 24-hour incubation period.
Data acquisition and screening of differentially expressed RBPs
Clinical information and RNA sequencing datasets (FPKM) of patients with UCEC were downloaded from the TCGA database. We obtained RNA sequencing dataset of 552 UCEC tissues and 23 normal tissues, and the clinical information of 539 patients. We used “limma” in R software to identify differentially expressed (DE) RBPs in 1542 RBPs. The inspection criteria are false discovery rate < 0.05, |log2 fold change (FC)| ≥ 1. Heat maps and volcano maps were developed using the “pheatmap” package.
Construction of a prognostic model
In our study, the “Survival” package in R was applied for performing univariate Cox regression analysis and KM test overall survival (OS) related DERBPs. We used R software to construct a prognostic prediction model. The score = sum of (corresponding coefficient × each gene’s expression). Gene set Enrichment analysis (GSEA) was used to analyze the function of the model.
Kaplan Meier (KM)-Plotter
Kaplan Meier-Plotter is a bioinformatic website designed to analyze prognostic value [11]. Currently, the prognostic effect of prognostic related RBPs in UCEC is to be investigated. The web can generate disease-free survival (DFS) and OS curves for these RBPs. The analyses were extracted from dataset TCGA.
Statistical analysis
For statistical analysis, GraphPad Prism 8 (GraphPad, CA, United States) and the R package (version 4.1.1) were used. By using the median risk score as the cutoff value, the patients with UCEC were classified into high- and low-risk categories. Three independent reruns of each experiment were conducted. The mean and standard deviation were used to present data (SD). For two-way comparisons between groups, the t-test was employed, and for comparisons across several groups, the one-way ANOVA was utilized. At P<0.05, differences were deemed significant.
Results
Screening for different RBPs in UCEC patients
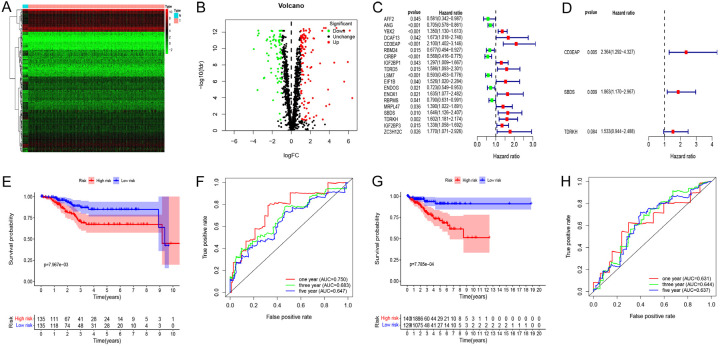
The workflow of this study is illustrated in Figure 1. A total of 575 samples, including 23 normal subjects, 552 patients, and 1542 RBPs, were included in this study. We identified 189 DERBPs, of which 115 were upregulated and 74 were downregulated (Figure 2A, 2B). We then performed further analysis of 189 differential RBPs.
Figure 1.
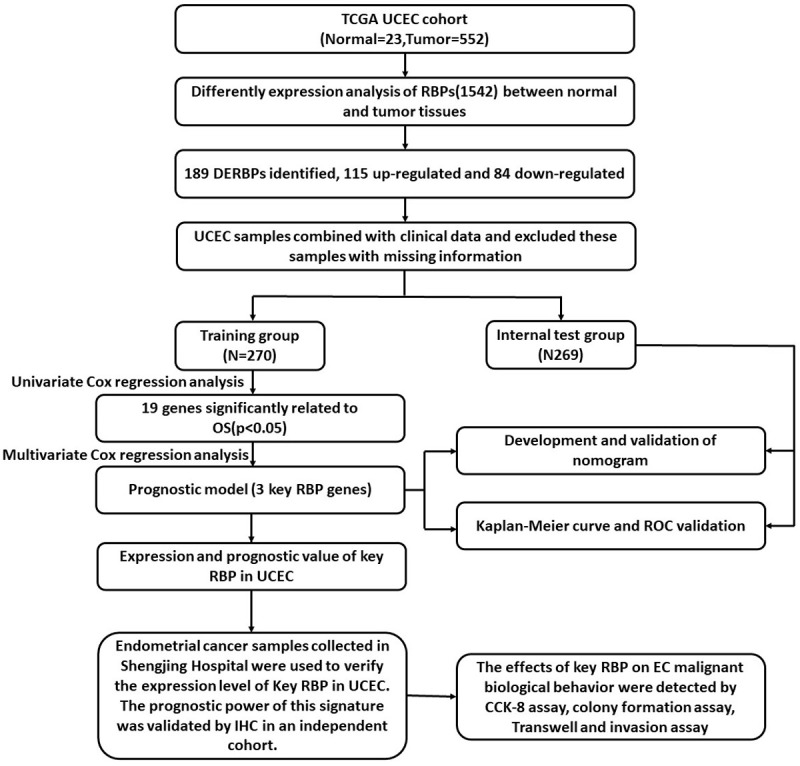
Comprehensive prognostic value analysis framework of RNA-binding proteins (RBPs) in uterine corpus endometrial carcinoma (UCEC) patients based on The Cancer Genome Atlas (TCGA) database.
Figure 2.
Screening of prognosis RBPs and construction of prognosis model. A. Heat map of differentially expressed (DE) RBPs between tumor and normal tissues. B. Volcano plot of DERBPs: upregulated DERBPs are indicated by red dots, and downregulated DERBPs are indicated by green dots. C. Univariate Cox regression analysis to identify the candidate prognosis-related RBPs in UCEC. D. Multivariate Cox regression analysis to identify prognosis-related RBPs in UCEC. E. Survival curves of high and low risk groups in the training group. F. 1-, 3-, and 5-year Time receiver operating characteristic (ROC) curves of overall survival (OS) for validation in the test group. G. Survival curves of high and low risk groups in the test group. H. 1-, 3-, and 5-year Time-ROC curves of overall survival for validation in the test group.
Identification of prognosis-associated RBPs in the training group
A total of 539 UCEC patients were randomly divided into the training and test groups. Univariate Cox regression analysis was performed, and 19 candidate prognostic RBPs were identified in the training group (Figure 2C). Multivariate Cox regression analysis of these 19 prognostic RBPs was then performed to determine their impact on OS in the training group. The results revealed that CD3EAP, SBDS, and TDRKH were independent predictors of UCEC in the training group (Figure 2D).
Prognostic model construction and validation based on RBPs
The UCEC patient risk score was calculated as follows:
Risk score = (0.86047 × Exp [CD3EAP]) + (0.62231 × Exp [SBDS]) + (0.42725 × Exp [TDRKH]).
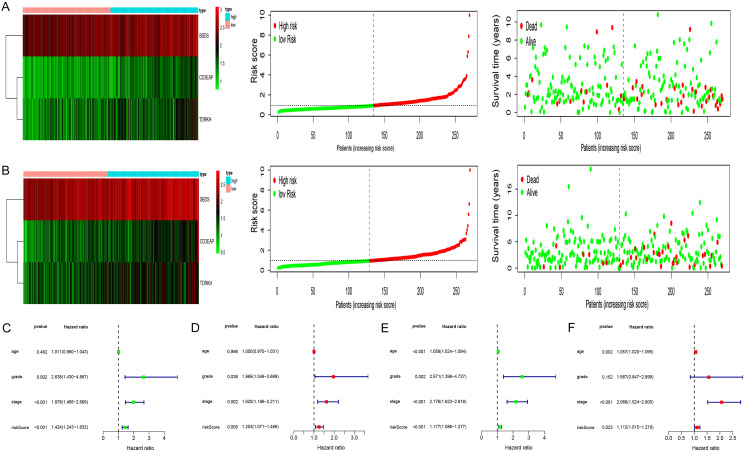
KM analysis revealed differences in OS between the two groups (Figure 2E). To determine the predictive capabilities of the three RBPs, a receiver operating characteristic (ROC) curve was plotted. The areas under the ROC curves (AUCs) for 1-, 3-, and 5-year OS were 0.75, 0.68, and 0.65, respectively (Figure 2F); thus the predictive ability of the model was verified. The same formula was used to verify the predicted values of the model in the test group and to evaluate the predictive power of the model. The model also demonstrated good predictive ability in the test group (Figure 2G, 2H). Heat maps of key RBP expression levels, patient survival status, and risk score distribution in the training group (Figure 3A) and test group (Figure 3B) were constructed.
Figure 3.
Test of risk prediction model for UCEC patients. A. Risk score distribution (upper), survival status (middle) and expression heatmap (bottom) in training group. B. Risk score distribution (upper), survival status (middle) and expression heatmap (bottom) in test group. C. Univariate analysis was performed to assess the clinicopathological prognostic value of the prediction model in the training group. D. Multivariate analysis was performed to assess the clinicopathological prognostic value of the prediction model in the training group. E. Univariate analysis was performed to assess the clinicopathological prognostic value of the prediction model in the test group. F. Multivariate analysis was performed to assess the clinicopathological prognostic value of the prediction model in the test group.
Establishment of the nomogram
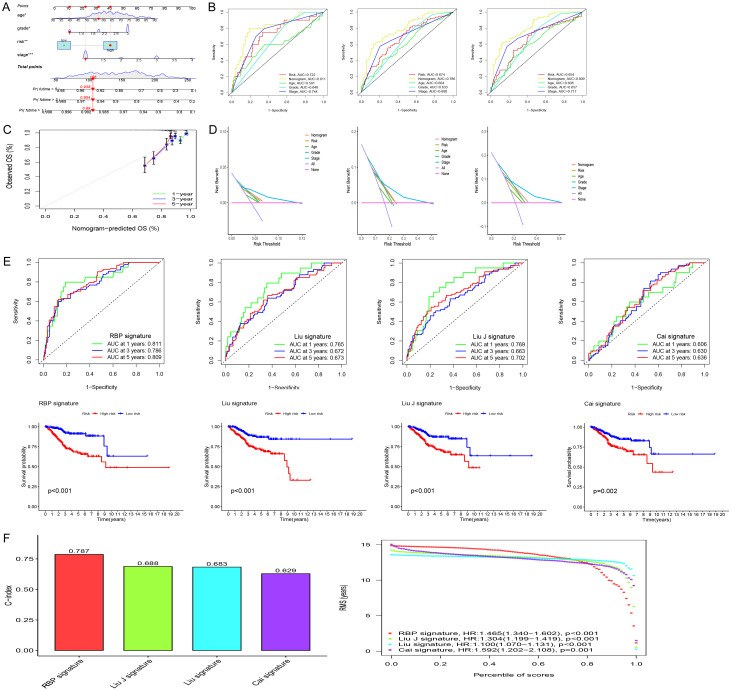
The risk score was identified as an independent prognostic factor (Figure 3C-F). We then built a nomogram based on the risk score and clinical data (age, stage, and grade) to quantitatively predict the prognosis of EC patients (Figure 4A). The AUCs for 1-, 3-, and 5-year OS were 0.811, 0.793, and 0.814, respectively (Figure 4B). The calibration curves demonstrated accuracy and validity (Figure 4C). Decision Curve Analysis (DCA) showed that nomogram had good predictive performance (Figure 4D). To verify the effectiveness of the model, we also compared it with existing models. Figure 4E shows the models constructed by Cai, Liu, Liu J and the present authors [12-14]. C-index results also showed that the model constructed on the basis of RBPs was superior to the other three models (Figure 4F). The results of GSEA are shown in Figure 5A, 5B.
Figure 4.
The comparison between model for RBPs and the existing model for signatures. A. Nomogram for predicting the 1-, 3-, and 5-year OS of UCEC patients. B. ROC curves curves for predicting the 1-, 3-, and 5-year OS of UCEC patients. C. Calibration curves for the prediction of 1-, 3- or 5-year overall survival of UCEC patients. D. Decision Curve Analysis (DCA) curves for predicting the 1-, 3-, and 5-year OS of UCEC patients. E. Survival curves and ROC curves of high and low risk groups in the model constructed by Cai, Liu, Liu J and us. F. C-index comparison of inflammatory models with other models.
Figure 5.
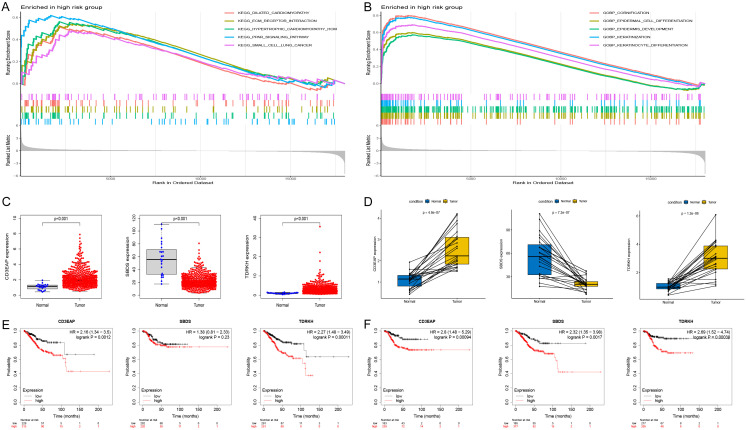
Gene set enrichment analysis (GSEA) of Biological functions and the expression of three key RBPs in normal and UCEC. A, B. GSEA showed function enriched in the high-risk group. C. Box plots showed the expression of CD3EAP, SBDS and TDRKH in normal and UCEC tissues. D. The transcription levels of CD3EAP, SBDS and TDRKH in UCEC compared with the paired normal endometrial tissue was showed based on TCGA datasets. The data are expressed as mean ± SEM. *P < 0.05, **P < 0.01, and ***P < 0.001. E. The OS curve for three key RBPs in UCEC. F. The RFS curve for three key RBPs in UCEC.
Expression of the three key DERBP genes in UCEC
According to TCGA data, the expression levels of CD3EAP and TDRKH were upregulated, whereas those of SBDS were downregulated, in the UCEC tissues (Figure 5C). The same results were observed when UCEC tissues were compared to paired normal endometrial tissues in TCGA database (Figure 5D). The prognostic value of CD3EAP, SBDS, and TDRKH in UCEC was subsequently explored. All three key DERBPs were found to be involved in the prognosis of UCEC (Figure 5E, 5F).
IHC validation of CD3EAP, SBDS, and TDRKH expression in EC
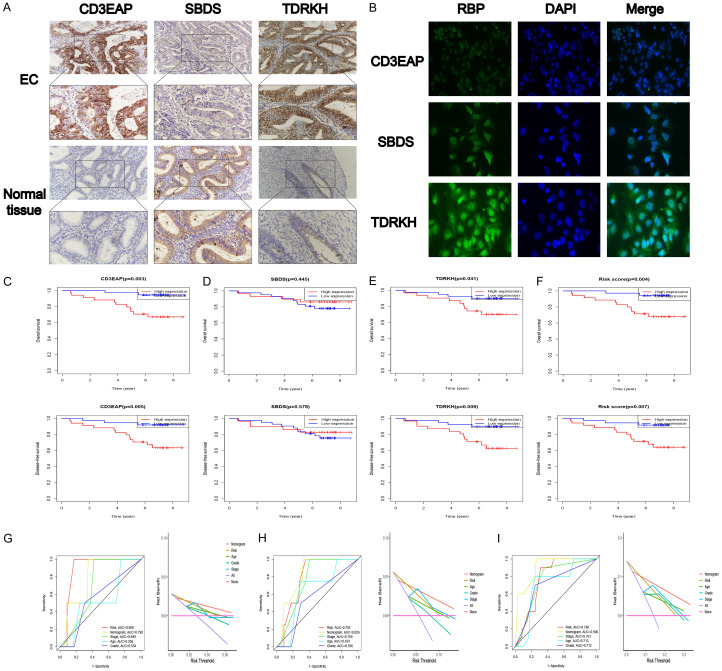
To further determine the roles of CD3EAP, SBDS, and TDRKH in EC, we used IHC to analyze the expression of the three genes in 71 EC tissues and 34 normal endometrial tissues (Figure 6A). The 71 EC patients and 34 healthy subjects were divided into a high expression of CD3EAP, SBDS and TDRKH group (++/+++) and a low expression group (-/+). According to the IHC results, compared to normal endometrial tissues, EC tissues exhibited high levels of CD3EAP (P < 0.001) and TDRKH (P < 0.001) expression and low levels of SBDS expression (P < 0.001) (Tables 1, 2 and 3). Patients at FIGO stages III-IV had significantly higher levels of TDRKH expression than patients at FIGO stages I-II (P = 0.049). Immunofluorescence analysis of Ishikawa cells showed that CD3EAP and SBDS were mainly located in the nucleus, whereas TDRKH was mainly located in the cytoplasm (Figure 6B).
Figure 6.
The prognostic power of this signature was validated by Immunohistochemistry (IHC) in an independent cohort. (A) Expression of CD3EAP, SBDS and CD3EAP in EC and normal endometrial tissues. (B) Localization of CD3EAP, SBDS and CD3EAP in Ishikawa cell determined using Immunofluorescence (IF). The prognostic value of (C) CD3EAP, (D) SBDS, (E) TDRKH, and (F) risk score for EC patients. ROC and DCA curves for predicting the (G) 1-, (H) 3-, and (I) 5-year OS in our independent cohort.
Table 1.
Relationships between CD3EAP expression in EC and clinicopathological parameters
| Characteristics | n | Low | High | High positive rate (%) | p-value | ||
|---|---|---|---|---|---|---|---|
|
|
|
||||||
| CD3EAP | (-) | (+) | (++) | (+++) | |||
| Normal VS tumor | < 0.001 | ||||||
| Normal tissue | 34 | 26 | 8 | 0 | 0 | 0 | |
| EC | 71 | 5 | 20 | 12 | 34 | 64.79 | |
| FIGO stage | 0.124 | ||||||
| I-II | 44 | 2 | 17 | 10 | 15 | 56.81 | |
| III-IV | 27 | 3 | 3 | 2 | 19 | 77.78 | |
| Age | 0.977 | ||||||
| < 65 | 64 | 5 | 18 | 11 | 30 | 63.08 | |
| ≥ 65 | 7 | 0 | 2 | 1 | 4 | 71.43 | |
| Diferentiation | 0.6306 | ||||||
| Well-moderate | 59 | 4 | 18 | 11 | 26 | 62.71 | |
| Poor | 12 | 1 | 2 | 1 | 8 | 75.00 | |
| LN metastasis | 0.238 | ||||||
| No | 55 | 3 | 19 | 10 | 23 | 60.00 | |
| Yes | 16 | 2 | 1 | 2 | 11 | 81.25 | |
Table 2.
Relationships between SBDS expression in EC and clinicopathologic data
| Characteristics | n | Low | High | High positive rate (%) | p-value | ||
|---|---|---|---|---|---|---|---|
|
|
|
||||||
| SBDS | (-) | (+) | (++) | (+++) | |||
| Normal VS tumor | < 0.001 | ||||||
| Normal tissue | 34 | 4 | 7 | 11 | 12 | 67.65 | |
| EC | 71 | 42 | 27 | 2 | 0 | 2.81 | |
| FIGO stage | 0.700 | ||||||
| I-II | 44 | 27 | 16 | 1 | 0 | 2.27 | |
| III-IV | 27 | 15 | 11 | 1 | 0 | 3.70 | |
| Age | 0.466 | ||||||
| < 65 | 64 | 38 | 24 | 2 | 0 | 3.08 | |
| ≥ 65 | 7 | 4 | 3 | 0 | 0 | 0.00 | |
| Differentiation | 0.757 | ||||||
| Well-moderate | 59 | 35 | 23 | 1 | 0 | 1.69 | |
| Poor | 12 | 7 | 4 | 1 | 0 | 8.33 | |
| LN metastasis | 0.933 | ||||||
| No | 55 | 33 | 20 | 2 | 0 | 3.64 | |
| Yes | 16 | 9 | 7 | 0 | 0 | 0 | |
Table 3.
Relationships between TDRKH expression in EC and clinicopathologic data
| Characteristics | n | Low | High | High positive rate (%) | p-value | ||
|---|---|---|---|---|---|---|---|
|
|
|
||||||
| TDRKH | (-) | (+) | (++) | (+++) | |||
| Normal VS tumor | < 0.001 | ||||||
| Normal tissue | 34 | 16 | 18 | 0 | 0 | 0 | |
| EC | 71 | 3 | 11 | 20 | 37 | 80.28 | |
| FIGO stage | 0.049 | ||||||
| I-II | 44 | 2 | 10 | 16 | 16 | 72.73 | |
| III-IV | 27 | 1 | 0 | 5 | 21 | 96.30 | |
| Age | 0.889 | ||||||
| < 65 | 64 | 3 | 10 | 18 | 33 | 78.46 | |
| ≥ 65 | 7 | 0 | 1 | 2 | 4 | 85.71 | |
| Differentiationdd | 0.915 | ||||||
| Well-moderate | 59 | 3 | 8 | 19 | 29 | 81.36 | |
| Poor | 12 | 0 | 3 | 1 | 8 | 75.00 | |
| LN metastasis | 0.640 | ||||||
| No | 55 | 2 | 10 | 23 | 20 | 78.18 | |
| Yes | 16 | 1 | 1 | 2 | 12 | 87.5 | |
To further verify the association between the three key RBPs and the prognosis of patients with EC, we performed KM survival analysis. We also integrated the organizational score calculated using the model to obtain the risk score. EC patients with high CD3EAP expression, high TDRKH expression, and a high risk score possessed shorter OS and DFS times than EC patients with low CD3EAP expression, low TDRKH expression, and a low risk score (Figure 6C). The AUCs of nomogram for 1-, 3-, and 5-year OS were 0.790, 0.826, and 0.906 in our independent cohort, respectively (Figure 6G-I). DCA showed that nomogram had better predictive ability than stage grade and other clinicopathologic values in our independent cohort (Figure 6G-I).
Experimental validation of the three key DERBPs
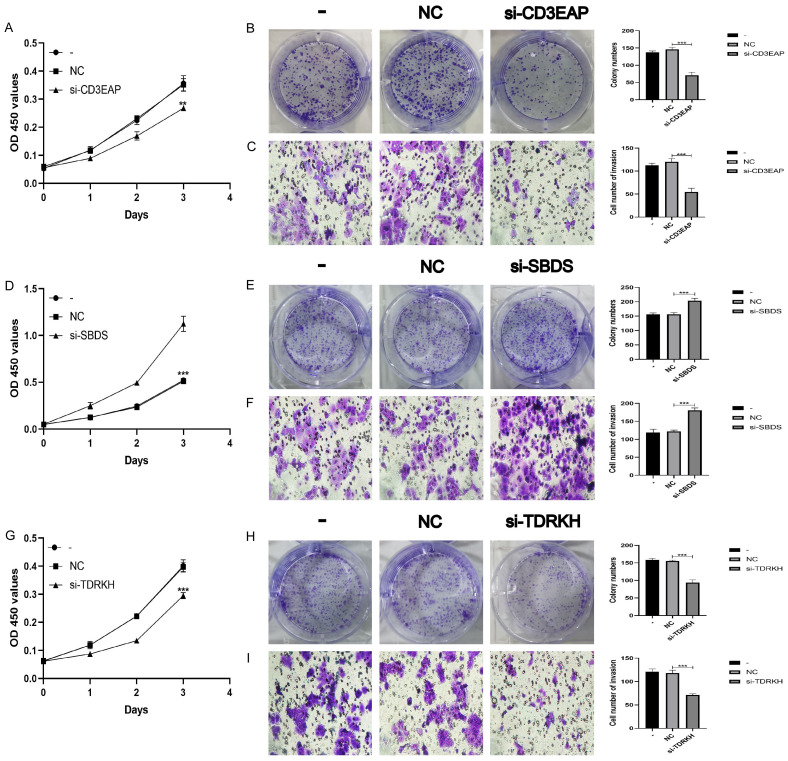
To further verify the role of the three key DERBPs in EC, we knocked down the expressions of CD3EAP, SBDS, and TDRKH in Ishikawa cells, and verified the knockdown effects of CD3EAP, SBDS, and TDRKH by PCR (Figure S1). Silencing CD3EAP inhibited the proliferation (Figure 7A, 7B) and invasion (Figure 7C) of ECs. Silencing SBDS promoted the proliferation (Figure 7D, 7E) and invasion (Figure 7F) of ECs. Silencing TDRKH inhibited the proliferation (Figure 7G, 7H) and invasion (Figure 7I) of ECs. These results suggest that in EC, CD3EAP and TDRKH may function as oncogenes, and SBDS may function as an anti-oncogene in EC.
Figure 7.
Three key RBPs regulates the biological behavior of Ishikawa cell lines. A, B. CCK-8 and colony formation assay were used to evaluate the proliferation effect of CD3EAP. C. Effect of CD3EAP on invasion assessed using the Transwell assay. D, E. CCK-8 and colony formation assay were used to evaluate the proliferation effect of SBDS. F. Effect of SBDS on invasion assessed using the Transwell assay. G, H. CCK-8 and colony formation assay were used to evaluate the proliferation effect of TDRKH. I. Effect of TDRKH on invasion assessed using the Transwell assay.
Discussion
Endometrial carcinoma, EC has become the most common type of gynecologic tumor, and its incidence and mortality have increased in recent years. Although existing studies have improved the diagnosis and treatment of EC, early diagnosis and treatment remain challenging. Dysregulation of RBPs has been shown to play a role in tumorigenesis [15]. Therefore, we aimed to build a prognostic model for EC patients based on RBPs.
In this study, we identified 189 DERBPS, of which 115 were upregulated and 74 were downregulated, based on TCGA-UCEC data. Univariate Cox regression analysis revealed 19 prognostic RBPs, and multivariate Cox regression analysis was used to construct a novel based on three RBPs. The risk score was an accurate independent and accurate prognostic factors. Finally, we built a nomogram based on these three key RBPs and clinical data to quantitatively predict patient outcomes. Comparison with existing models also showed that our model is superior. Our findings may contribute to the development of new EC diagnostic and prognostic biomarkers.
We identified three key DERBP genes (CD3EAP, SBDS, and TDRKH) with prognostic value in EC. CD3EAP is involved in the development of lung cancer [16]. SBDS is involved in blood system diseases [17]. Few studies of RBPs in EC have been conducted; the scope for prospective research is broad.
Because the EC data from other databases were not accompanied by clinical information, we randomly divided the TCGA-UCEC data in the TCGA data into training and test groups. The ROC curve showed that the model demonstrated good diagnostic capability. Subsequently, we constructed a nomogram to predict the survival time of patients with UCEC. Calibration curves for predicting 1-, 3-, and 5-year OS also demonstrated the accuracy and validity of the nomogram. Our results suggest that our model can guide the clinical prognostic management and treatment of patients with EC.
The mechanisms of action of the three key RBPs in EC require clarification. Therefore, we explored the expression of TDRKH, SBDS, and TDRKH in EC. KM-Plotter prognostic analysis also showed that CD3EAP, SBDS, and TDRKH were prognostic markers of UCEC.
Finally, we validated the signature in our independent cohort, using IHC. An IF assay confirmed the cell localization of RBPs, CCK-8, colony formation and Transwell invasion assays verified that CD3EAP, SBDS and TDRKH could regulate the malignant biological behavior of EC.
This study had some limitations. Due to the lack of EC data in common dataset, we were only able to validate our findings in our own independent data set. Nonetheless, our prognostic models based on three key DERBPs showed great potential for predicting the prognosis of patients with UCEC. Our exploration of the expression and cellular function of CD3EAP, SBDS and TDRKH also provides a reference for future studies of RBPs in UCEC.
Conclusion
Based on bioinformatics analysis of UCEC data from the TCGA, we constructed a prognostic model comprising three key RBPs, CD3EAP, SBDS and TDRKH, that were found to be independent predictors of prognosis in EC. These three key RBPs may be involved in the development of EC. To this end, we further explored their role in EC. CD3EAP, SBDS, and TDRKH were identified as prognostic biomarkers for EC. Therefore, the model based on CD3EAP, SBDS and TDRKH may be prognostic in UCEC.
Acknowledgements
This study was approved by the Institutional Review Committee (Ethical No. 2018PS251K, 2018PS136K) of the Shengjing Hospital affiliated to China Medical University, and experimentation was conducted based on the approved guidelines. Our study was supported by the National Natural Science Foundation of China (No. 81872123), Liaoning Provincial Higher Education Innovation Team, Distinguished Professor of Liaoning Province, China Medical University’s 2018 Discipline Construction “Major Special Construction Plan” (No. 3110118029), and Outstanding Scientific Fund of Shengjing Hospital (No. 201601).
Disclosure of conflict of interest
None.
Supporting Information
References
- 1.Siegel RL, Miller KD, Jemal A. Cancer statistics, 2017. CA Cancer J Clin. 2017;67:7–30. doi: 10.3322/caac.21387. [DOI] [PubMed] [Google Scholar]
- 2.Siegel RL, Miller KD, Jemal A. Cancer statistics, 2020. CA Cancer J Clin. 2020;70:7–30. doi: 10.3322/caac.21590. [DOI] [PubMed] [Google Scholar]
- 3.Kitson SJ, Evans DG, Crosbie EJ. Identifying high-risk women for endometrial cancer prevention strategies: proposal of an endometrial cancer risk prediction model. Cancer Prev Res (Phila) 2017;10:1–13. doi: 10.1158/1940-6207.CAPR-16-0224. [DOI] [PubMed] [Google Scholar]
- 4.Njoku K, Abiola J, Russell J, Crosbie EJ. Endometrial cancer prevention in high-risk women. Best Pract Res Clin Obstet Gynaecol. 2020;65:66–78. doi: 10.1016/j.bpobgyn.2019.12.005. [DOI] [PubMed] [Google Scholar]
- 5.Bray F, Ferlay J, Soerjomataram I, Siegel RL, Torre LA, Jemal A. Global cancer statistics 2018: GLOBOCAN estimates of incidence and mortality worldwide for 36 cancers in 185 countries. CA Cancer J Clin. 2018;68:394–424. doi: 10.3322/caac.21492. [DOI] [PubMed] [Google Scholar]
- 6.Weiderpass E, Antoine J, Bray FI, Oh JK, Arbyn M. Trends in corpus uteri cancer mortality in member states of the European Union. Eur J Cancer. 2014;50:1675–1684. doi: 10.1016/j.ejca.2014.02.020. [DOI] [PubMed] [Google Scholar]
- 7.Perron G, Jandaghi P, Solanki S, Safisamghabadi M, Storoz C, Karimzadeh M, Papadakis AI, Arseneault M, Scelo G, Banks RE, Tost J, Lathrop M, Tanguay S, Brazma A, Huang S, Brimo F, Najafabadi HS, Riazalhosseini Y. A general framework for interrogation of mRNA stability programs identifies RNA-binding proteins that govern cancer transcriptomes. Cell Rep. 2018;23:1639–1650. doi: 10.1016/j.celrep.2018.04.031. [DOI] [PubMed] [Google Scholar]
- 8.Mitchell SF, Parker R. Principles and properties of eukaryotic mRNPs. Mol Cell. 2014;54:547–558. doi: 10.1016/j.molcel.2014.04.033. [DOI] [PubMed] [Google Scholar]
- 9.Xiao R, Chen JY, Liang Z, Luo D, Chen G, Lu ZJ, Chen Y, Zhou B, Li H, Du X, Yang Y, San M, Wei X, Liu W, Lécuyer E, Graveley BR, Yeo GW, Burge CB, Zhang MQ, Zhou Y, Fu XD. Pervasive chromatin-RNA binding protein interactions enable RNA-based regulation of transcription. Cell. 2019;178:107–121. e18. doi: 10.1016/j.cell.2019.06.001. [DOI] [PMC free article] [PubMed] [Google Scholar]
- 10.Pereira B, Billaud M, Almeida R. RNA-binding proteins in cancer: old players and new actors. Trends Cancer. 2017;3:506–528. doi: 10.1016/j.trecan.2017.05.003. [DOI] [PubMed] [Google Scholar]
- 11.Nagy Á, Munkácsy G, Győrffy B. Pancancer survival analysis of cancer hallmark genes. Sci Rep. 2021;11:6047. doi: 10.1038/s41598-021-84787-5. [DOI] [PMC free article] [PubMed] [Google Scholar]
- 12.Cai L, Hu C, Yu S, Liu L, Zhao J, Zhao Y, Lin F, Du X, Yu Q, Xiao Q. Identification of EMT-related gene signatures to predict the prognosis of patients with endometrial cancer. Front Genet. 2020;11:582274. doi: 10.3389/fgene.2020.582274. [DOI] [PMC free article] [PubMed] [Google Scholar]
- 13.Liu J, Li S, Feng G, Meng H, Nie S, Sun R, Yang J, Cheng W. Nine glycolysis-related gene signature predicting the survival of patients with endometrial adenocarcinoma. Cancer Cell Int. 2020;20:183. doi: 10.1186/s12935-020-01264-1. [DOI] [PMC free article] [PubMed] [Google Scholar]
- 14.Liu J, Mei J, Li S, Wu Z, Zhang Y. Establishment of a novel cell cycle-related prognostic signature predicting prognosis in patients with endometrial cancer. Cancer Cell Int. 2020;20:329. doi: 10.1186/s12935-020-01428-z. [DOI] [PMC free article] [PubMed] [Google Scholar]
- 15.Mohibi S, Chen X, Zhang J. Cancer the‘RBP’eutics-RNA-binding proteins as therapeutic targets for cancer. Pharmacol Ther. 2019;203:107390. doi: 10.1016/j.pharmthera.2019.07.001. [DOI] [PMC free article] [PubMed] [Google Scholar]
- 16.Yin JY, Ma YG, Vogel U, Liu DH, Sun ZX. GLTSCR1, ATM, PPP1R13L and CD3EAP genetic variants and lung cancer risk in a Chinese population. Curr Med Sci. 2018;38:734–740. doi: 10.1007/s11596-018-1938-6. [DOI] [PubMed] [Google Scholar]
- 17.Dun MD, Mannan A, Rigby CJ, Butler S, Toop HD, Beck D, Connerty P, Sillar J, Kahl RGS, Duchatel RJ, Germon Z, Faulkner S, Chi M, Skerrett-Byrne D, Murray HC, Flanagan H, Almazi JG, Hondermarck H, Nixon B, De Iuliis G, Chamberlain J, Alvaro F, de Bock CE, Morris JC, Enjeti AK, Verrills NM. Shwachman-Bodian-Diamond syndrome (SBDS) protein is a direct inhibitor of protein phosphatase 2A (PP2A) activity and overexpressed in acute myeloid leukaemia. Leukemia. 2020;34:3393–3397. doi: 10.1038/s41375-020-0814-0. [DOI] [PMC free article] [PubMed] [Google Scholar]
Associated Data
This section collects any data citations, data availability statements, or supplementary materials included in this article.


