

Abstract
To monitor SARS-CoV-2 diffusion, we measured anti-Spike S1/S2 IgGs in the serum of nearly 4000 workers employed in several healthcare facilities for one year. We found that the antibody response persists at least over 8 months in symptomatic subjects, particularly in individuals with anosmia/dysgeusia. Moreover, analyzing a smaller cohort (124 healthcare employees of which 57 had a previous history of SARS-CoV-2 exposure) vaccinated with two doses of Comirnaty vaccine, we observed that in symptomatic subjects previously exposed to SARS-CoV-2 one dose vaccine was sufficient to stimulate very high levels of antibodies, suggesting that these subjects should take only one dose of vaccine.
Introduction
Lombardy has been the Italian region most affected by COVID-19 during the first phase of the pandemic (March–April 2020). At that time, only symptomatic individuals that had been tested by RT-PCR to detect SARS-CoV-2 were identified. Also, the viral detection was missed in patients with negative RT-PCR test but with COVID-19 disease confirmed by chest computed tomography (CT) [1, 2]. Moreover, the quality of RT-PCR testing might have been compromised by a number of preanalytical and analytical factors [3, 4]. To assess the SARS-CoV-2 viral spread, several studies had investigated the antibody responses to SARS-CoV-2 [5], in particular the IgG development, that is considered a more reliable marker for seroconversion compared to IgM [5, 6]. Importantly, it has been shown that the antibody response to SARS-CoV-2 last at least 6 months in symptomatic COVID-19 patients [7], but decline in asymptomatic individuals [8]. The first FDA-approved COVID-19 vaccine has been known as the Pfizer-BioNTech COVID-19 Vaccine (BNT162b2, now marketed as Comirnaty) was administered since December 2020. It is an mRNA-based vaccine encoding the SARS-CoV-2 full-length spike protein with a very safe profile and capable of inducing a strong neutralizing antibody response already after two vaccine doses [9]. However, it was unclear whether previously SARS-CoV-2 infected people should be vaccinated or how many doses they should receive. To better understand the association between the antibody response to SARS-CoV-2 upon infection or after vaccination and some features (i.e., symptoms), we have monitored anti-SARS-CoV-2 IgGs in employees of healthcare facilities over time: at the beginning of the pandemic (March–May 2020, phase 1), in July–August 2020 (phase 2), in November–December 2020 (phase 3) and after Comirnaty vaccine.
Results
To identify the spreading of the virus, not only in symptomatic individuals (tested by RT-PCR), but also in asymptomatic population, we carried out an observational study to analyze the presence of serum anti-SARS-CoV-2 IgG antibodies in nearly 4000 employees across seven healthcare facilities located in areas of Lombardy with different exposure to SARS-CoV-2 virus between April and May 2020 (phase 1) [10]. Recruitment was on a voluntary basis and more than 65% of employees (n = 3985) participated. The individuals were healthcare workers (including physicians (26.5%), physiotherapists (1.8%), and nurses (25.4%)), and other staff employed in hospital (i.e., technicians (4.4%), students (0.7%), researchers/academics (3.1%), administrative staff (7.9%), and biologists (1.3%)). All the subjects filled a questionnaire reporting demographic data (age, sex), whether they have been diagnosed with COVID-19 and what symptoms they experienced, their body mass index (BMI), comorbidities, smoking habit, vaccinations, regular or remote working, and whether they have been exposed to SARS-CoV-2-infected individuals. A quantitative antibody test specific for anti-S1 and anti-S2 SARS-CoV-2 IgG antibodies allowed us to evaluate not only the frequency of positivity, but also the magnitude of the anti-spike antibody response. We showed that the number of participants exposed to SARS-CoV-2 correlated with the incidence of COVID-19 in Lombardy, ranging from 3 to 3.8% (Humanitas Medical Care and Humanitas Mater Domini, Varese, respectively) to 35–43% (Humanitas Gavazzeni and Humanitas Castelli, Bergamo, respectively) (Fig. 1).
Fig. 1.

Distribution of IgG positivity across different geographical areas and healthcare facilities in Lombardy, Italy. Employees from seven different healthcare facilities were analyzed for their anti-SARS-CoV-2 IgG positivity. Pie charts show the percentage of negative subjects (IgG < 12 AU/mL) (orange) and that of positive subjects (IgG ≥ 12 AU/mL) (blue) in each healthcare facility: Istituto Clinico Humanitas (ICH), Rozzano (MI); Humanitas Gavazzeni, Bergamo; Humanitas Castelli, Bergamo; Humanitas Mater Domini (HMD), Castellanza (VA); Humanitas Medical Center (HMC), Varese (VA); Humanitas University (HU), Pieve Emanuele (MI); Humanitas San Pio X, Milan, (MI). Percentage of positive subjects are indicated
We observed that SARS-CoV-2 IgG positivity was higher in young people (≤ 60 yo) than in elderly and in females (14%) than males (11.4%). These differences were confirmed in the multilevel logistic regression (summary of OR and CI in Table 1). However, this age-dependent IgG positivity was due to the female population (Fig. 2). Indeed, we found a lower frequency of IgG positive individuals in females older than 60 years old compared to age-matched males (Fig. 2). However, analyzing the quantity of antibodies in the serum, we identified a similar level between females and males (not shown), suggesting a comparable magnitude of the anti-spike antibody response. Interestingly, roles and BMI were unrelated to IgG positivity (not shown).
Table 1.
Summary of odds ratios and CI of multilevel logistic regression
| OR | 95% CI | p value | ||
|---|---|---|---|---|
| Lower | Upper | |||
| Age (> 60 vs ≤ 60) | 0.35 | 0.15 | 0.83 | 0.0166 |
| Sex (male vs female) | 0.73 | 0.57 | 0.94 | 0.0158 |
| Smoking habit (yes vs no) | 0.45 | 0.34 | 0.60 | < 0.0001 |
Fig. 2.
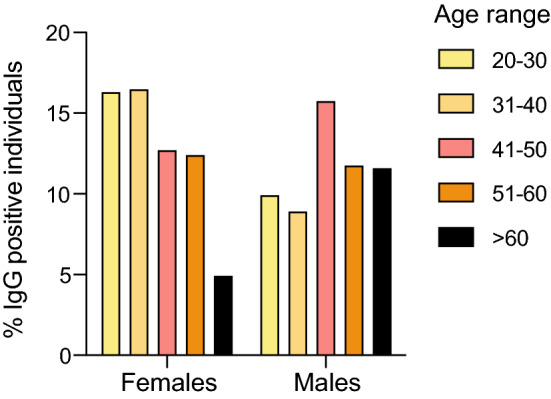
Frequency of IgG positivity (IgG ≥ 12 AU/mL) by sex and age. Histograms show the percentage of positive individuals (IgG ≥ 12 AU/mL) divided by age range and sex on the whole population regardless of healthcare facility (20–30: M, n = 22; F = 88; 31–40: M, n = 31; F, n = 114; 41–50: M, n = 53; F, n = 108; 51–60: M, n = 26; F, n = 56; > 60: M, n = 19; F, n = 6); p values were determined using Cuzick’s test for trend. p = 0.0374 (total); p = 0.0008 (female); p = 0.1498 (male); p = 0.0024 (interaction)
Moreover, we found that smokers showed a lower SARS-CoV-2 IgG positivity (7.4% vs 13.5%), compared to non-smokers (OR and CI in Table 1), although without differences in SARS-CoV-2 IgG plasma levels (p = 0.0704, Kruskal–Wallis test; not shown).
We observed that SARS-CoV-2 infection occurs in family more than in the healthcare facilities. Indeed, we identified a higher frequency of SARS-CoV-2 IgG positive individuals among subjects who had been in contact with COVID-19 affected family members compared to subjects who had interacted with COVID-19 positive colleagues or patients. In particular, compared with group referring no interactions with COVID-19 affected people, the odds ratio for IgG positivity ranged from 1.59 for interaction with colleagues, 1.83 for interaction with patients, to 4.73 for interactions with family members COVID-19 positive (summary of OR and CI in Table 2). Interestingly, we were able to identify also asymptomatic (11.9% of SARS-CoV-2 IgG positive) and paucisymptomatic individuals with one or two symptoms (23.1%), allowing us to retrospectively evaluate viral diffusion. The analysis of symptoms related to COVID-19, revealed that among the IgG positive population, 81.2% of SARS-CoV-2 infected subjects presented both loss of smell (anosmia) and taste (dysgeusia) and fever, suggesting that these symptoms are heavily associated to COVID-19 disease (Table 3).
Table 2.
Summary of odds ratios and CI of multilevel logistic regression
| Contagion modality | OR | 95% CI | |
|---|---|---|---|
| Lower | Upper | ||
| Colleague | 1.59 | 1.11 | 2.27 |
| Patient | 1.83 | 1.29 | 2.60 |
| Family member | 4.73 | 2.93 | 7.65 |
Table 3.
Association of symptoms with IgG positivity
| Total | Negative (< 12AU/mL) | Positive (≥ 12 AU/mL) | |||||||
|---|---|---|---|---|---|---|---|---|---|
| N | % of total | N | % of level | % of total | N | % of level | % of total | ||
| Number of symptoms | |||||||||
| 0 symptoms | 1380 | 34.6 | 1318 | 95.5 | 38.1 | 62 | 4.5 | 11.9 | |
| 1 symptoms | 814 | 20.4 | 758 | 93.1 | 21.9 | 56 | 6.9 | 10.7 | |
| 2 symptoms | 582 | 14.6 | 517 | 88.8 | 14.9 | 65 | 11.2 | 12.4 | |
| 3 symptoms | 411 | 10.3 | 350 | 85.2 | 10.1 | 61 | 14.8 | 11.7 | |
| 4 symptoms | 256 | 6.4 | 201 | 78.5 | 5.8 | 55 | 21.5 | 10.5 | |
| 5 or more symptoms | 542 | 13.6 | 318 | 58.7 | 9.2 | 224 | 41.3 | 42.8 | |
| Fever and anosmia/dysgeusia | |||||||||
| No | 3285 | 82.4 | 3096 | 94.2 | 89.4 | 189 | 5.8 | 36.1 | |
| Anosmia/dysgeusia | 203 | 5.1 | 83 | 40.9 | 2.4 | 120 | 59.1 | 22.9 | |
| Fever | 332 | 8.3 | 252 | 75.9 | 7.3 | 80 | 24.1 | 15.3 | |
| Fever and anosmia/dysgeusia | 165 | 4.1 | 31 | 18.8 | 0.9 | 134 | 81.2 | 25.6 | |
| Total | 3985 | 100.0 | 3462 | 86.9 | 100.0 | 523 | 13.1 | 100.0 | |
Based on these results, we evaluated the antibody response in the nearly 4000 employees of Humanitas healthcare facilities longitudinally at two different time points (phase 2—July–August 2020 and phase 3—November–December 2020) before the rollout of COVID-19 vaccination [11]. In particular, we measured the persistence of the antibody response in that employees that results positive for anti-Spike S2/S2 IgG (n = 4534). We excluded the subjects that have been infected and those that did not develop IgGs (IgG ≤ 3.8) between phase 1 and phase 2. Then, we analyzed the rate of antibody response defined as:
that determine the increase or the decrease of antibody response between phase 1 and phase 2.
Through a machine learning approach we correlated this rate with 93 features analyzed including, age, sex, location, professional role, time between sample collections, COVID-19 symptoms, home exits and remote working, comorbidities.
In-line with our previous results, we observed that the SARS-CoV-2 IgG levels increased in Humanitas Castelli and Gavazzeni (p = 0.0032 and p = 0.0005, respectively), located in Bergamo, the city the most affected by COVID-19. Moreover, we found out an increased rate only in symptomatic subjects (p < 0.000001) and in particular in individuals with anosmia/dysgeusia (OR 2.75, 95% CI 1.743–4.301) in a multivariate logistic regression analysis between phase 1 and phase 2. Finally, we observed that both symptomatic and paucisymptomatic subjects maintained high levels of SARS-CoV-2 IgG over at least 8 months (phase 3) compared to asymptomatic individuals that did not increase their antibodies in the same period of time (Fig. 3).
Fig. 3.
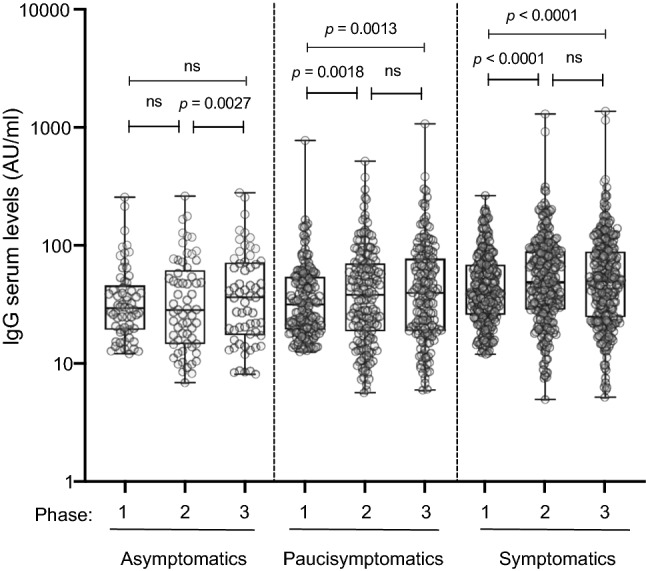
Anti-Spike S1/S2 IgG serum levels over phases 1, 2 and 3. Anti-Spike S1/S2 IgG serum levels were measured in asymptomatics (n = 61), paucisymptomatics (n = 163), and symptomatics (n = 275) at three different time points (phase 1–3). The box plots show the interquartile range, the horizontal lines show the median values, and the whiskers indicate the minimum-to-maximum range. Log scale on y-axis. P values were measured using a one-tailed Wilcoxon matched-pairs signed rank test
However, the levels of IgG developed after SARS-CoV-2 infection is lower than after full SARS-CoV-2 mRNA vaccination (Comirnaty), as we reported in another study performed on 124 healthcare employees of which 57 had a previous history of SARS-CoV-2 exposure (SARS-CoV-2-Exp), with or without symptoms, vaccinated with two doses of Comirnaty vaccine [12]. As expected, individuals previously exposed to SARS-CoV-2 presented higher levels of IgGs before vaccination compared to naïve subjects but, surprisingly, their IgG levels increased exponentially after the first dose of vaccine until they reached a plateau after the second dose (Fig. 4). By contrast, the antibody response in naïve subjects was lower after the first dose of vaccine compared to SARS-CoV-2 exposed individuals and steadily increased at around 11 days after the second dose without reaching a plateau (Fig. 4). Furthermore, we evaluated whether the antibody response after vaccination correlated with symptoms. As shown in Fig. 5, A and B, symptomatic individuals displayed a higher antibody response compared to asymptomatic/paucisymptomatic subjects after the first (p = 0.049) and the second dose of vaccine (p = 0.043). Additionally, symptomatic individuals with SARS-CoV-2 IgG levels above 1000 AU/mL were able to maintain a high antibody response developed after the first dose of vaccine and measured 34.3 ± 5.5 days from the first dose, even if they did not receive the second dose (not shown). The symptoms that positively associated with increased SARS-CoV-2 IgG after both vaccine doses were gastrointestinal symptoms, fever and muscle pain (p = 0.002, p = 0.0012, p = 0.0339, respectively), whereas anosmia/dysgeusia correlated with increased SARS-CoV-2 IgG only after the second dose (p = 0.01) (data not shown).
Fig. 4.
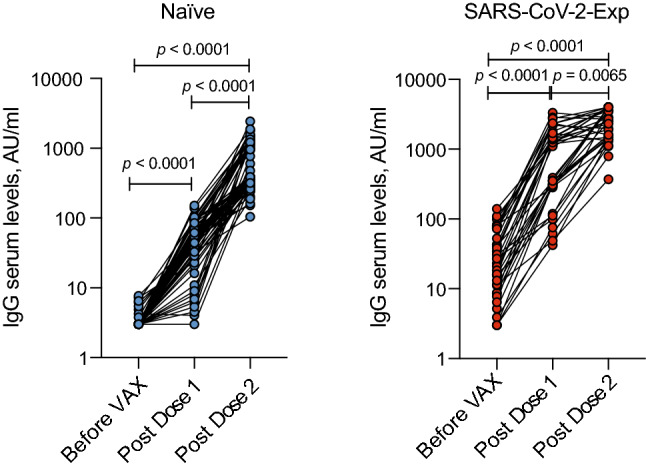
Exponential increase of anti-Spike 1/2 IgGs after the first dose of Comirnaty vaccine in SARS-Cov-2 exposed individuals. Anti-Spike 1/2 IgG serum levels in naïve (not previously exposed to SARS-CoV-2) (n = 64) and SARS-CoV-2 exposed individuals (n = 36) measured before vaccination (Before VAX), at around 17 days from the first dose of vaccine (Post Dose 1) and 11 days after the second dose (Post Dose 2). Spaghetti plot showing the trends for each individual subject by linked dots. Log scale on y-axis. P values were determined using Friedman test with Dunnett's multiple comparisons test
Fig. 5.
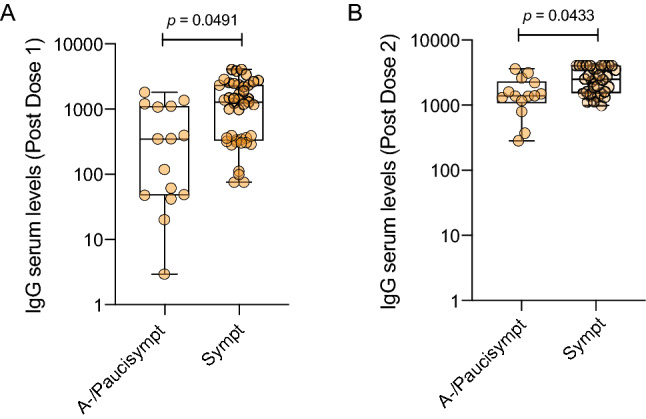
Symptomatic subjects show higher increase of anti-Spike 1/2 IgG levels after both doses of vaccine compared to asymptomatic/paucisymptomatic individuals. Anti-Spike 1/2 IgG serum levels in asymptomatics/paucisymptomatics (A-/Paucisympt) (n = 15) or symptomatics (Sympt) (n = 42) at around 17 days after the first (a) or 11 days after the second dose of vaccine (A-/Paucisympt n = 14, Sympt n = 33) (b). Each dot corresponds to an individual subject. Log scale on y-axis. The box plots show the interquartile range, the horizontal lines show the median values and the whiskers indicate the minimum-to-maximum range. P values were determined using two-tailed unpaired Kolmogorov–Smirnov test
Discussion
Thanks to a quantitative serological test to detect anti-Spike S1/S2 IgGs we were able to evaluate and to monitor retrospectively SARS-CoV-2 diffusion not only in symptomatic, but also in asymptomatic and paucisymptomatic individuals in a cohort of nearly 4000 employees belonging to several healthcare facilities located in Lombardy (Italy) for one year. Among symptoms, anosmia/dysgeusia and fever were strongly associated to COVID-19 disease. We identified a higher percentage of SARS-CoV-2 IgG positive individuals in areas with a higher incidence of COVID-19 and among subjects who had been in contact with COVID-19 affected family members. We found a higher prevalence of females than males positive for SARS-CoV-2 IgG, suggesting that females may be more susceptible to infection, have a higher ability to mount an immune response or have been more exposed to the virus, in particular when young. Interestingly, we observed a lower incidence of SARS-CoV-2 infection in smokers as reported in other studies [13–15]. However, a recent systematic review performed on 39 studies, indicates that smoking increases the risk of mortality and disease severity/progression among COVID-19 patients [16]. We noticed that the antibody response persists at least over 8 months in symptomatic subjects. Intriguingly, our results demonstrate that SARS-CoV-2 immune memory increases in the first months particularly in individuals with anosmia/dysgeusia symptoms. This may be due to the persistence of SARS-CoV-2 in the olfactory bulb, where the virus infecting olfactory epithelium and immune cells might induce local inflammation [17] maintaining and boosting the antibody response.
Furthermore, we found that in symptomatic subjects with COVID-19 history one dose of Comirnaty vaccine is sufficient to promote a strong and sustained antibody response suggesting that these subjects should take at least one vaccine shot to contrast subsequent infections particularly when facing new variants of concern.
A limitation of our study is that it does not represent the overall population, but only hospital healthcare workers, researchers/academics and administrative staff (most of the people analyzed are women and there is an underrepresentation of the elderly). Moreover, we did not assess any other antibody subtype nor their neutralizing activity.
Methods
Clinical studies. This observational study (clinicaltrial.gov NCT04387929) has been approved by the international review board of Istituto Clinico Humanitas for all participating healthcare facilities: Istituto Clinico Humanitas (ICH), Rozzano (MI); Humanitas Gavazzeni, Bergamo; Humanitas Castelli, Bergamo; Humanitas Mater Domini (HMD), Castellanza (VA); Humanitas Medical Center (HMC), Varese (VA); Humanitas University (HU), Pieve Emanuele (MI); Humanitas San Pio X, Milan, (MI). Accrual was on a voluntary basis and all participants signed an informed consent and filled a questionnaire before blood collection. None of them were enrolled at the time of symptoms (they were asymptomatics or the symptoms had disappeared at the time of serological test). We considered “asymptomatics” subjects without any symptoms; “paucisymptomatics” individuals that developed 1 or 2 symptoms; “symptomatics” individuals with more than three symptoms. The study was conducted at Istituto Clinico Humanitas, where employees were followed for serology and for any occurring COVID-19–associated symptoms every 3 months (phase 1: April–May 2020; phase 2: July–August 2020 and phase 3: November–December 2020) or after Comirnaty vaccination at around 17 days from the first vaccine dose (Post Dose 1) and 11 days after the second dose (Post Dose 2).
IgG measurement. Liaison SARS-CoV-2 S1/S2 IgG assay (DiaSorin, Saluggia (VC), Italy) was used to measure anti-SARS-CoV-2 IgG. The method is an indirect chemiluminescence immunoassay for the determination of anti-S1 and anti-S2 specific antibodies. According to kit manufacturer, the test discriminates among negative (< 15 AU/mL; with 3.8 as the limit of IgG detection) and positive (≥ 15 AU/mL) subjects. We considered positive subjects with IgG plasma levels ≥ 12 AU/mL based on our results showing that this group behaved very similarly to the group with IgG ≥ 15 AU/mL [10]. Intra- and inter-assay coefficient of variation are < 1.9% and < 3.7%, respectively. The sensitivity of the test as reported by the manufacturer is 90.4% (79.4–95.8%) while the specificity is 98.5% (97.5–99.2%).
Statistics. Data were analyzed for normal distribution (Shapiro–Wilk test) before any statistical analyses. Individual values are presented as spaghetti plots or as box plots showing the interquartile range, median, and minimum-to-maximum whiskers. Statistical significance between two groups was determined using two-tailed unpaired Mann–Whitney U test or one-tailed Wilcoxon matched-pairs signed rank test or two-tailed unpaired Kolmogorov–Smirnov test, whereas the comparison of multiple groups was carried out using Kruskal–Wallis test and nonparametric tests for trend (Cuzick’s and Mantel–Haenszel test, when appropriate) or Friedman test followed by Dunnett's multiple comparisons test. A probability value of P < 0.05 was considered significant. All statistics are reported in the figure legends.
We assessed the association between SARS-CoV-2 IgG positivity and role, sex, BMI and smoking habit through a multilevel logistic regression (see ref. [10]). Our data have clustered structure as subjects worked at different hospitals. The role of subjects was within the hospital level, while age, sex, BMI and smoking habit were individual features. We estimated a random intercept model for hospital profiling and treat the hospital effects as random effects only. The results were reported as odds ratios (OR) and 95% Confidence Interval (CI). SAS Glimmix procedure (SAS 9.4 release) was used to perform this analysis.
Data analyses were carried out using GraphPad Prism version 8 and Python version 3.8 with the following libraries: Pandas (version 1.1.4, data wrangling), Scipy (version 1.3.2, statistical analysis), Statsmodel (version 0.12.1, LR statistical model) and Scikit-Learn (version 0.24.1, LR statistical model).
Acknowledgements
These studies were supported by a philantropic donation by Dolce & Gabbana, by the Italian Ministry of Health (Ricerca corrente) and by Fondazione Humanitas per la Ricerca. We would like to thank all the employees that volunteered to participate to these studies, all the nurses and personnel that collected the samples, and the laboratory technicians that run the serological tests.
Data availability
This manuscript has associated data in a data repository [Authors’ comment: The datasets analyzed during the current study are available from the corresponding author on reasonable request.]
Declarations
Conflict of interest
The authors declare that they have no conflicts of interest.
Footnotes
Focus Point on Progress in Medical Physics in Times of CoViD-19 and Related Inflammatory Diseases. Guest editors: E. Cisbani, S. Majewski, A. Gori, F. Garibaldi.
References
- 1.Ai T, Yang Z, Hou H, Zhan C, Chen C, Lv W, Tao Q, Sun Z, Xia L. Correlation of chest CT and RT-PCR testing for coronavirus disease 2019 (COVID-19) in China: a report of 1014 cases. Radiology. 2020;296:E32–e40. doi: 10.1148/radiol.2020200642. [DOI] [PMC free article] [PubMed] [Google Scholar]
- 2.Wang W, Xu Y, Gao R, Lu R, Han K, Wu G, Tan W. Detection of SARS-CoV-2 in different types of clinical specimens. JAMA. 2020;323:1843–1844. doi: 10.1001/jama.2020.3786. [DOI] [PMC free article] [PubMed] [Google Scholar]
- 3.Li Y, Yao L, Li J, Chen L, Song Y, Cai Z, Yang C. Stability issues of RT-PCR testing of SARS-CoV-2 for hospitalized patients clinically diagnosed with COVID-19. J. Med. Virol. 2020;92:903–908. doi: 10.1002/jmv.25786. [DOI] [PMC free article] [PubMed] [Google Scholar]
- 4.Lippi G, Simundic AM, Plebani M. Potential preanalytical and analytical vulnerabilities in the laboratory diagnosis of coronavirus disease 2019 (COVID-19) Clin. Chem. Lab. Med. 2020;58:1070–1076. doi: 10.1515/cclm-2020-0285. [DOI] [PubMed] [Google Scholar]
- 5.Long QX, Liu BZ, Deng HJ, Wu GC, Deng K, Chen YK, Liao P, Qiu JF, Lin Y, Cai XF, et al. Antibody responses to SARS-CoV-2 in patients with COVID-19. Nat. Med. 2020;26:845–848. doi: 10.1038/s41591-020-0897-1. [DOI] [PubMed] [Google Scholar]
- 6.Zhao J, Yuan Q, Wang H, Liu W, Liao X, Su Y, Wang X, Yuan J, Li T, Li J, et al. Antibody responses to SARS-CoV-2 in patients with novel coronavirus disease 2019. Clin. Infect. Dis. 2020;71:2027–2034. doi: 10.1093/cid/ciaa344. [DOI] [PMC free article] [PubMed] [Google Scholar]
- 7.Dan JM, Mateus J, Kato Y, Hastie KM, Yu ED, Faliti CE, Grifoni A, Ramirez SI, Haupt S, Frazier A, et al. Immunological memory to SARS-CoV-2 assessed for up to 8 months after infection. Science. 2021;2021:371. doi: 10.1126/science.abf4063. [DOI] [PMC free article] [PubMed] [Google Scholar]
- 8.Ward H, Cooke GS, Atchison C, Whitaker M, Elliott J, Moshe M, Brown JC, Flower B, Daunt A, Ainslie K, et al. Prevalence of antibody positivity to SARS-CoV-2 following the first peak of infection in England: serial cross-sectional studies of 365,000 adults. Lancet Reg. Health Eur. 2021;4:100098. doi: 10.1016/j.lanepe.2021.100098. [DOI] [PMC free article] [PubMed] [Google Scholar]
- 9.Walsh EE, Frenck RW, Jr, Falsey AR, Kitchin N, Absalon J, Gurtman A, Lockhart S, Neuzil K, Mulligan MJ, Bailey R, et al. Safety and immunogenicity of Two RNA-Based Covid-19 vaccine candidates. N. Engl. J. Med. 2020;383:2439–2450. doi: 10.1056/NEJMoa2027906. [DOI] [PMC free article] [PubMed] [Google Scholar]
- 10.Sandri MT, Azzolini E, Torri V, Carloni S, Pozzi C, Salvatici M, Tedeschi M, Castoldi M, Mantovani A, Rescigno M. SARS-CoV-2 serology in 4000 health care and administrative staff across seven sites in Lombardy, Italy. Sci. Rep. 2021;11:12312. doi: 10.1038/s41598-021-91773-4. [DOI] [PMC free article] [PubMed] [Google Scholar]
- 11.Levi R, Ubaldi L, Pozzi C, Angelotti G, Sandri MT, Azzolini E, Salvatici M, Savevski V, Mantovani A, Rescigno M. The antibody response to SARS-CoV-2 infection persists over at least 8 months in symptomatic patients. Commun. Med. (Lond.) 2021;1:32. doi: 10.1038/s43856-021-00032-0. [DOI] [PMC free article] [PubMed] [Google Scholar]
- 12.Levi R, Azzolini E, Pozzi C, Ubaldi L, Lagioia M, Mantovani A, Rescigno M. One dose of SARS-CoV-2 vaccine exponentially increases antibodies in individuals who have recovered from symptomatic COVID-19. J. Clin. Invest. 2021 doi: 10.1172/jci149154. [DOI] [PMC free article] [PubMed] [Google Scholar]
- 13.Farsalinos K, Barbouni A, Niaura R. Systematic review of the prevalence of current smoking among hospitalized COVID-19 patients in China: could nicotine be a therapeutic option? Reply. Int. Emerg. Med. 2021;16:235–236. doi: 10.1007/s11739-020-02457-2. [DOI] [PMC free article] [PubMed] [Google Scholar]
- 14.A. Israel, E. Feldhamer, A. Lahad, D. Levin-Zamir, G. Lavie, Smoking and the risk of COVID-19 in a large observational population study. medRxiv 2020, 2020.2006.2001.20118877. 10.1101/2020.06.01.20118877
- 15.M.J. Norden, D.H. Avery, J.G. Norden, D.R. Haynor, National Smoking Rates Correlate Inversely with COVID-19 Mortality. medRxiv 2020, 2020.2006.2012.20129825, 10.1101/2020.06.12.20129825
- 16.Baker J, Krishnan N, Abroms LC, Berg CJ. The impact of tobacco use on COVID-19 outcomes: a systematic review. J Smok Cessat. 2022;2022:5474397. doi: 10.1155/2022/5474397. [DOI] [PMC free article] [PubMed] [Google Scholar]
- 17.de Melo GD, Lazarini F, Levallois S, Hautefort C, Michel V, Larrous F, Verillaud B, Aparicio C, Wagner S, Gheusi G, et al. COVID-19-related anosmia is associated with viral persistence and inflammation in human olfactory epithelium and brain infection in hamsters. Sci. Transl. Med. 2021 doi: 10.1126/scitranslmed.abf8396. [DOI] [PMC free article] [PubMed] [Google Scholar]
Associated Data
This section collects any data citations, data availability statements, or supplementary materials included in this article.
Data Availability Statement
This manuscript has associated data in a data repository [Authors’ comment: The datasets analyzed during the current study are available from the corresponding author on reasonable request.]