

Abstract
Purpose
To investigate the relationship between the ratio of index to ring finger lengths (2D:4D ratio), reflecting androgen exposure in utero, and reproductive function among men.
Methods
Male patients (N = 180) who consulted for fertility issues participated in the study. The palms of both hands were scanned, and the 2D:4D ratio was calculated. Data on semen volume, sperm concentration and total motility, total and motile sperm counts, and serum hormone concentrations were obtained. Spearman correlation coefficients between the 2D:4D ratio and hormone and semen quality parameters were calculated.
Results
The total sperm count was significantly negatively correlated with the 2D:4D ratio of the left hand (r = −0.154, p = 0.039) but not with that of the right hand (r = −0.045, p = 0.548). Testosterone showed weak negative correlations with the 2D:4D ratio in the left (r = −0.142, p = 0.058) and right (r = − 0.149, p = 0.046) hands. Follicle‐stimulating hormone levels were negatively correlated with the 2D:4D ratios of the left (r = −0.173, p = 0.020) and right (r = −0.164, p = 0.027) hands. Other semen quality parameters or luteinizing hormone levels showed no significant correlation with the 2D:4D ratios.
Conclusions
No clear associations were observed between the 2D:4D ratios and reproductive function.
Keywords: androgens, digit ratio, hormone, male infertility, semen quality
We investigated the relationship between the 2D:4D ratio and reproductive function among 180 men who consulted for fertility issues. Correlations between the 2D:4D ratios and male reproductive function were mostly weak or insignificant.

1. INTRODUCTION
Reproductive dysfunction during adulthood may be linked to androgen exposure during fetal life. Skakkebæk et al. 1 proposed the testicular dysgenesis syndrome (TDS) hypothesis that testicular cancer, hypospadias, cryptorchidism, and low sperm count may all be caused by disturbances in embryonal programming and the development of gonads in utero. Lifestyle and environmental factors are expected to affect fetal gonad development in early pregnancy and cause TDS. 1
Indirect evidence suggests that the index to ring finger length (2D:4D) ratio reflects androgen exposure in utero during the fetal period. A lower 2D:4D ratio is associated with higher prenatal androgen exposure, and the 2D:4D ratio is lower among boys than girls by at least 2 years of age. 2 , 3 , 4 A study directly examining fetal testosterone and fetal estradiol in amniotic fluid found that the right‐hand 2D:4D ratio at 2 years of age showed a negative association with fetal testosterone‐to‐estradiol ratio, but not with fetal testosterone. 5 Finger length and gonadal organs share common genes that are involved in their development. According to Kondo et al. 6 the urogenital system and finger formation require two homeobox genes, HOXA and HOXD, for finger growth and germ bud differentiation. Manning et al. 3 also stated that the regulation of finger development and gonad differentiation might both be associated with prenatal and adult testicular activity. The early origins of sexual dimorphism in the 2D:4D ratio have been reported by Malas et al. 7 and they showed that the 2D:4D ratio was lower in male than in female fetuses aborted at gestational weeks 9–40.
Several studies targeting healthy men reported both positive 8 and negative 3 , 9 associations between the 2D:4D ratio and total sperm count; whereas, Firman et al. 10 reported no association. Among men, testosterone, luteinizing hormone (LH) and follicle‐stimulating hormone (FSH), which play an important role in reproductive function, are also associated with the 2D:4D ratio, 3 , 8 , 11 , 12 while a meta‐analytic review reported null associations between adult hormone levels and 2D:4D ratios. 13
Few studies have investigated the association between the 2D:4D ratio and reproductive function in infertile men. 14 , 15 , 16 In a Chinese study, the 2D:4D ratio was negatively associated with sperm motility in infertile men, but no such association was found in healthy men. 14 Among azoospermic patients, both LH and FSH levels were positively associated with 2D:4D ratios. 15 The Chinese study 14 suggest that the association between the 2D:4D ratio and reproductive function may differ depending on the level of reproductive function.
The objective of the present study was to investigate the relationship between the 2D:4D ratio and reproductive function in infertile men.
2. MATERIALS AND METHODS
The Interdisciplinary Investigation of Technology, the Environment, and Fertility (IITEF) project (P.I. : S.K.) intends to understand how technology, the environment, and their interaction affect fertility trends in humans. 17 As part of the IITEF project, this study aimed to assess the potential effects of in utero exposure to androgens on male reproductive function. This study was conducted in accordance with the guidelines of the Declaration of Helsinki and approved by the Institutional Research Ethics Committees of the Graduate School of Medicine and Faculty of Medicine, University of Tokyo (2020057NI‐(2)), Tsukuba Gakuen Hospital (20–07), and the International University of Health and Welfare (20‐S‐8).
2.1. Study population
Participants were recruited from patients at Sanno Hospital in Tokyo or at the urology department of Tsukuba Gakuen Hospital in Tsukuba City, Ibaraki Prefecture. All the participants from both hospitals consulted the doctor at the hospital for fertility treatment (for themselves or their partners) and wanted to have a baby. The purpose and procedure of the study were explained to each potential participant, and written informed consent was obtained upon agreement to participate. The survey was conducted from September 2020 to January 2021 at Tsukuba Gakuen Hospital and from September 2020 to March 2021 at Sanno Hospital. Eligible men were aged 20–55 years, had never undergone vasectomy, and were able to provide semen and urine specimens on the same day. At each hospital, 99 men participated, resulting in the total sample size of N = 198.
2.2. Study procedure at each hospital
Participants answered online questionnaires on age, height, and weight using a tablet on the day participants agreed to participate. On the same day the palms of both hands were scanned at both hospitals using a scanner (EP‐882AW, SEIKO EPSON Co., Ltd., Japan) at 300 dots per inch (dpi) and saved as jpg files. Semen specimens were collected by masturbation at each hospital as part of the clinical procedure. Measurement of testis size and evaluation of varicocele were conducted by M.U. and K.Y. at Tsukuba Gakuen Hospital and by K.Y. and T.I. at Sanno Hospital. Testis size was measured using an orchidometer (TAKEI MEDICAL & OPTICAL Co., Ltd, Japan). Blood samples were collected between 8:30 and 15:00 and sent to the company (SRL Co., Ltd., Japan) for hormone measurement. Testis size measurement, evaluation of varicocele status, and venous blood collection were conducted either on the day of or prior to recruitment.
2.3. 2D:4D measurement
Scanned images of participants' palms were sent to the University of Tokyo. Using MATLAB Image Viewer, one investigator (F.K.) measured the lengths of the index and ring fingers for each hand in pixels up to two decimal places (Figure 1). The 2D:4D ratio for each hand was calculated by dividing the index finger length by the ring finger length. Prior to this study, the authors conducted a preliminary analysis to examine the variability of the 2D:4D ratio measurement between two researchers. The intraclass correlation coefficient (ICC) was 0.9732 when two researchers independently scanned the palms of the same seven people.
FIGURE 1.

An image of an author's palms with blue lines indicating the length of the index and ring finger in pixels. The lines were drawn with MATLAB Image Viewer.
2.4. Laboratory analyses
Semen analyses were performed in accordance with the Semen Analyses Standardization Guidelines. 18 The semen volume was measured using a graduated cylinder with a conical base. Sperm concentration and total motility were quantified using the Sperm Motility and Morphology Analysis System with a computer‐assisted semen analyzer (SMAS, DITECT. Co. Ltd Japan), LH and FSH were measured by chemiluminescent immunoassay (CLIA), and testosterone was measured by electrochemiluminescence immunoassay (ECLIA) by SRL Co., Ltd., Japan. The authors obtained these data and information on varicocele status from clinical records with the participants' consent.
2.5. Statistical analyses
The analytic sample comprised 180 participants who provided a complete set of data. Eighteen men with missing testosterone values were excluded from the analyses. The mean of right and left testis sizes for each participant were calculated and used for statistical analyses. Considering the possibility that associations between 2D:4D ratios and reproductive function differ between fertile and infertile men, participants were divided into a higher (N = 72) and a lower semen quality group (N = 108). Those in the lower semen quality group showed a value lower than the WHO reference values, that is, sperm count <39 million, sperm concentration < 16 million/ml, or total motility <42%. 19 , 20 All other participants were categorized into the higher semen quality group. The mean and standard deviation (SD) of variables were calculated as a summary statistic for the whole sample, as well as for the lower and higher semen quality groups. For each variable, comparisons were made between the lower and higher semen groups using the Wilcoxon rank‐sum test for continuous variables or by Fisher's exact test for categorical variables. Spearman's correlation coefficients were calculated between the 2D:4D ratio (right or left) and weight, height, BMI, testis size, varicocele, LH, FSH, testosterone, semen volume, sperm concentration, total sperm count, motile sperm, and motile sperm count. Spearman correlation coefficients were calculated for the whole sample, as well as separately for the lower and higher semen quality groups. All statistical analyses were conducted using R ver.4.1.1. Statistical significance was set at p < 0.05.
3. RESULTS
The basic characteristics of the participants are summarized in Table 1. The mean (SD) age of the participants (N = 180) was 37.3 (6.0) years. The mean (SD) sperm count and semen volume was 159.1 (142.8) million/ml and 3.3 (1.5) ml, respectively. The mean (SD) total motility was 43.1 (20.3) %. The mean (SD) 2D:4D ratio was 0.937 (0.031) for the left hand and 0.950 (0.032) for the right hand. There were no significant differences in the 2D:4D ratios between the participants with lower and higher semen qualities (Table 1). Four participants had a left‐hand 2D:4D ratio ≥1, and 15 participants had a right‐hand 2D:4D ratio ≥1.
TABLE 1.
Basic characteristics of participants by semen quality category. Mean (SD), median [min, max], or N (%)
| Semen quality a | Overall (N = 180) | |||
|---|---|---|---|---|
| Higher (N = 72) | Lower (N = 108) | p‐value b | ||
| 2D:4D (left hand) | 0.935 (0.029) | 0.939 (0.032) | 0.937 (0.031) | |
| 0.935 [0.859, 1.012] | 0.940 [0.868, 1.040] | 0.937 [0.859, 1.040] | ||
| 2D:4D (right hand) | 0.949 (0.030) | 0.950 (0.033) | 0.950 (0.032) | |
| 0.949 [0.870, 1.024] | 0.946 [0.879, 1.026] | 0.946 [0.870, 1.026] | ||
| Age (year) | 36.8 (6.0) | 37.6 (6.0) | 37.3 (6.0) | |
| Height (cm) | 172 (5) | 173 (6) | 173 (5) | |
| Weight (kg) | 70 (11) | 70 (11) | 70 (11) | |
| BMI (kg/m2) | 23.5 (3.1) | 23.5 (3.5) | 23.5 (3.4) | |
| Testis volume (ml) | 20.9 (4.1) | 19.6 (4.9) | 20.1 (4.7) | |
| FSH (mIU/ml) | 4.5 (1.9) | 5.6 (4.3) | 5.2 (3.6) | |
| LH (mIU/ml) | 4.0 (2.0) | 4.3 (2.3) | 4.2 (2.2) | |
| Testosterone (ng/dL) | 501.1 (230.2) | 494.9 (230.3) | 497.4 (229.6) | |
| Semen volume (ml) | 3.2 (1.5) | 3.4 (1.5) | 3.3 (1.5) | |
| Sperm concentration (x10^6/ml) | 81.1 (53.6) | 34.6 (32.4) | <0.001 | 53.2 (47.9) |
| Total sperm motility (%) | 60.5 (11.9) | 31.6 (16.2) | <0.001 | 43.1 (20.3) |
| Sperm count (×10^6) | 226.4 (153.1) | 114.3 (116.1) | <0.001 | 159.1 (142.8) |
| Motile sperm count (×10^6) | 140.7 (111.1) | 34.9 (39.6) | <0.001 | 77.2 (92.4) |
| Varicocele | ||||
| Left and right | 6 (8%) | 18 (17%) | 24 (13%) | |
| Left only | 16 (22%) | 24 (22%) | 40 (22%) | |
| Right only | 1 (1%) | 1 (1%) | 2 (1%) | |
| Treated | 18 (25%) | 33 (31%) | 51 (28%) | |
| None | 31 (43%) | 32 (30%) | 63 (35%) | |
| Study site | ||||
| Tokyo | 39 (54%) | 48 (44%) | 87 (48%) | |
| Tsukuba | 33 (46%) | 60 (56%) | 93 (52%) | |
Semen quality is lower if below WHO reference values (sperm count < 39 million, sperm concentration < 16 million/ml, or total motility <42%). Otherwise, semen quality is higher.
By Wilcoxon rank sum test or Fisher's exact test. Only p‐values < 0.05 is shown.
Abbreviations: FSH, follicle‐stimulating hormone; LH, luteinizing hormone.
The 2D:4D ratios of both hands were positively correlated (r = 0.590, p < 0.001) (Table 2). The left‐hand 2D:4D ratio was positively correlated with weight (r = 0.147, p = 0.049) and negatively correlated with FSH (r = −0.173, p = 0.020) and sperm count (r = −0.154, p = 0.039). The right 2D:4D ratio was negatively correlated with FSH (r = −0.164, p = 0.027) and testosterone (r = −0.149, p = 0.046) (Table 2). Negative correlations between 2D:4D ratios of both hands and FSH were observed in the whole sample as well as in the subgroup with lower semen quality (Table 3), but not in the higher semen quality group (Table 4). Scatter plots of the 2D:4D ratios, logged sperm counts, and FSH levels are shown in Figure 2. Supplementary Figures S1, S2, S3, S4 and S5 show scatter plots of 2D:4D ratios and sperm concentration, total motility, LH, testosterone, age, height, weight, BMI, testis volume, and semen volume.
TABLE 2.
Spearman correlation coefficients between variables of all participants (N = 180)
| Variables | 2 | 3 | 4 | 5 | 6 | 7 | 8 | 9 | 10 | 11 | 12 | 13 | 14 | 15 |
|---|---|---|---|---|---|---|---|---|---|---|---|---|---|---|
| 1. Age | −0.009 | 0.183* | 0.214** | 0.156* | 0.183* | 0.130 | −0.239** | −0.353*** | −0.034 | −0.241** | −0.202** | −0.236** | 0.105 | 0.002 |
| 2. Height | 0.420*** | 0.033 | 0.149* | −0.072 | −0.027 | −0.115 | −0.003 | −0.126 | 0.026 | −0.140 | −0.098 | 0.067 | 0.041 | |
| 3. Weight | 0.904*** | 0.150* | 0.019 | −0.019 | −0.441*** | −0.222** | −0.090 | −0.077 | −0.188* | −0.159* | 0.147* | 0.082 | ||
| 4. BMI | 0.099 | 0.070 | 0.005 | −0.416*** | −0.241** | −0.044 | −0.123 | −0.141 | −0.143 | 0.120 | 0.072 | |||
| 5. Testis size | −0.220** | −0.014 | −0.120 | −0.127 | 0.298*** | 0.135 | 0.214** | 0.230** | 0.008 | −0.001 | ||||
| 6. FSH | 0.568*** | 0.045 | −0.176* | −0.238** | −0.106 | −0.336*** | −0.299*** | −0.173* | −0.164* | |||||
| 7. LH | 0.043 | −0.152* | −0.172* | −0.087 | −0.266*** | −0.257*** | −0.055 | −0.039 | ||||||
| 8. Testosterone | 0.255*** | 0.044 | 0.027 | 0.180* | 0.139 | −0.142 | −0.149* | |||||||
| 9. Semen volume | −0.178* | −0.063 | 0.290*** | 0.200** | −0.018 | −0.042 | ||||||||
| 10. Sperm concentration | 0.386*** | 0.856*** | 0.834*** | −0.134 | −0.048 | |||||||||
| 11. Total sperm motility | 0.300*** | 0.628*** | 0.032 | 0.027 | ||||||||||
| 12. Sperm count | 0.910*** | −0.154* | −0.045 | |||||||||||
| 13. Motile sperm count | −0.124 | −0.035 | ||||||||||||
| 14. 2D:4D (left hand) | 0.590*** | |||||||||||||
| 15. 2D:4D (right hand) |
Abbreviations: FSH, follicle‐stimulating hormone; LH, luteinizing hormone.
p < 0.05.
p < 0.01.
p < 0.001.
TABLE 3.
Spearman correlation coefficients between variables of men with lower semen quality a (N = 108)
| Variables | 2 | 3 | 4 | 5 | 6 | 7 | 8 | 9 | 10 | 11 | 12 | 13 | 14 | 15 |
|---|---|---|---|---|---|---|---|---|---|---|---|---|---|---|
| 1. Age | −0.133 | 0.145 | 0.225* | 0.099 | 0.160 | 0.080 | −0.255** | −0.313*** | −0.030 | −0.335*** | −0.178 | −0.277** | 0.069 | −0.016 |
| 2. Height | 0.383*** | 0.005 | 0.071 | −0.115 | 0.045 | −0.078 | 0.140 | −0.200* | 0.048 | −0.125 | −0.090 | 0.144 | 0.121 | |
| 3. Weight | 0.905*** | 0.050 | 0.083 | 0.020 | −0.421*** | −0.253** | −0.127 | −0.126 | −0.234* |
−0.245* |
0.253** | 0.126 | ||
| 4. BMI | 0.038 | 0.136 | 0.018 | −0.404*** | −0.315*** | −0.039 | −0.193* | −0.178 | −0.225* | 0.208* | 0.101 | |||
| 5. Testis size | −0.238* | −0.034 | −0.038 | −0.041 | 0.310** | 0.050 | 0.264** | 0.268** | −0.098 | −0.086 | ||||
| 6. FSH | 0.600*** | 0.036 | −0.145 | −0.330*** | −0.157 | −0.366*** | −0.386*** | −0.240* | −0.210* | |||||
| 7. LH | 0.060 | −0.069 | −0.312** | −0.099 | −0.325*** | −0.345*** | −0.140 | −0.046 | ||||||
| 8. Testosterone | 0.247** | 0.110 | 0.036 | 0.231* | 0.227* | −0.182 | −0.198* | |||||||
| 9. Semen volume | −0.033 | 0.058 | 0.356*** | 0.358*** | −0.038 | −0.025 | ||||||||
| 10. Sperm concentration | −0.065 | 0.902*** | 0.783*** | −0.166 | −0.024 | |||||||||
| 11. Total sperm motility | −0.032 | 0.350*** | 0.180 | 0.139 | ||||||||||
| 12. Sperm count | 0.890*** | −0.189 | −0.026 | |||||||||||
| 13. Motile sperm count | −0.107 | 0.015 | ||||||||||||
| 14. 2D:4D (left hand) | 0.629*** | |||||||||||||
| 15. 2D:4D (right hand) |
Note: Semen quality was below WHO reference values (sperm count <39 million, sperm concentration < 16 million/ml, or total motility < 42%).
Abbreviations: FSH, follicle‐stimulating hormone; LH, luteinizing hormone.
p < 0.05.
p < 0.01.
p < 0.001.
TABLE 4.
Spearman correlation coefficients between variables of men with higher semen quality a (N = 72)
| Variables | 2 | 3 | 4 | 5 | 6 | 7 | 8 | 9 | 10 | 11 | 12 | 13 | 14 | 15 |
|---|---|---|---|---|---|---|---|---|---|---|---|---|---|---|
| 1. Age | 0.167 | 0.257* | 0.210 | 0.283* | 0.224 | 0.192 | −0.199 | −0.429*** | 0.138 | −0.119 | −0.160 | −0.155 | 0.124 | 0.012 |
| 2. Height | 0.477*** | 0.081 | 0.273* | 0.006 | −0.174 | −0.149 | −0.217 | 0.018 | 0.158 | −0.183 | −0.130 | −0.073 | −0.099 | |
| 3. Weight | 0.897*** | 0.315** | −0.060 | −0.077 | −0.449*** | −0.198 | −0.062 | 0.042 | −0.168 | −0.134 | −0.023 | −0.017 | ||
| 4. BMI | 0.208 | −0.054 | −0.028 | −0.429*** | −0.148 | −0.074 | −0.062 | −0.107 | −0.103 | −0.006 | 0.019 | |||
| 5. Testis size | −0.172 | 0.053 | −0.265* | −0.221 | 0.221 | 0.118 | 0.084 | 0.128 | 0.225 | 0.147 | ||||
| 6. FSH | 0.498*** | 0.059 | −0.246* | −0.093 | −0.127 | −0.325** | −0.310** | −0.052 | −0.067 | |||||
| 7. LH | 0.003 | −0.263* | 0.096 | −0.084 | −0.133 | −0.137 | 0.099 | −0.009 | ||||||
| 8. Testosterone | 0.282* | −0.093 | −0.058 | 0.116 | 0.090 | −0.064 | −0.053 | |||||||
| 9. Semen volume | −0.375** | −0.153 | 0.426*** | 0.342** | 0.012 | −0.034 | ||||||||
| 10. Sperm concentration | 0.358** | 0.629*** | 0.678*** | −0.039 | −0.120 | |||||||||
| 11. Total sperm motility | 0.153 | 0.395*** | −0.086 | −0.128 | ||||||||||
| 12. Sperm count | 0.961*** | −0.051 | −0.118 | |||||||||||
| 13. Motile sperm count | −0.055 | −0.136 | ||||||||||||
| 14. 2D:4D (left hand) | 0.520*** | |||||||||||||
| 15. 2D:4D (right hand) |
Note: Semen quality was above WHO reference values (sperm count ≧39 million, sperm concentration ≧16 million/ml, and total motility ≧ 42%).
Abbreviations: FSH, follicle‐stimulating hormone; LH, luteinizing hormone.
p < 0.05.
p < 0.01.
p < 0.001.
FIGURE 2.
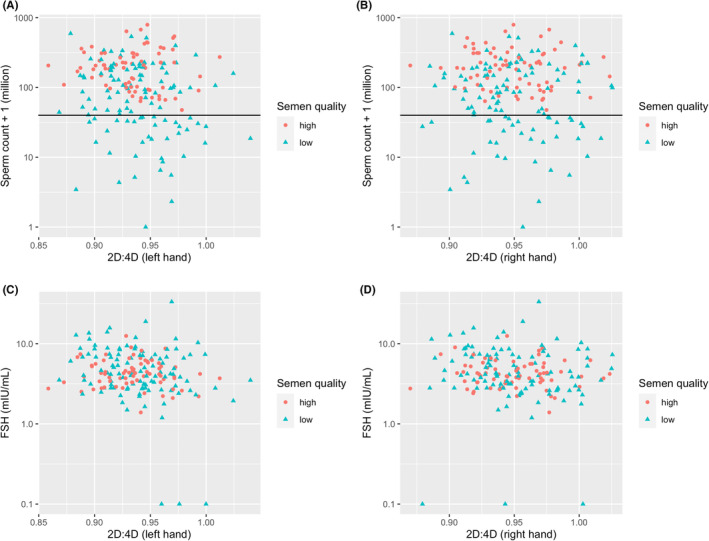
Scatter plot of sperm count and 2D:4D ratios (a: left hand, b: right hand) and FSH and 2D:4D ratios (c: left hand, d: right hand) by semen quality category (N = 180). The horizontal lines correspond to the WHO reference value of 39 million. Men with sperm count < 39 million, sperm concentration < 16 million/mL, or total motility < 42% were categorized into the lower semen group. All other participants were categorized as the higher semen quality group.
4. DISCUSSION
This study targeted 180 men seeking infertility treatment and examined the associations between the 2D:4D ratio, a measure of androgen exposure in utero, and reproductive function. The relatively large sample size (n = 180) was a strength of this study. Correlation analyses were conducted for the whole sample as well as for subgroups with lower and higher semen quality. In the whole sample, FSH and testosterone showed a tendency toward negative correlations with 2D:4D ratios; sperm count was negatively correlated with left, but not right, hand 2D:4D ratio. Among men with lower semen quality, the 2D:4D ratios of either hand were not correlated with semen quality parameters, but were negatively correlated with FSH, and there were weak negative correlations between the 2D:4D ratios and serum testosterone concentrations. In contrast, among those with higher semen quality, no correlations were observed between 2D:4D ratios and hormone or semen quality parameters.
4.1. Various methods to quantify 2D:4D ratio
The 2D:4D ratios may differ depending on how they are measured and the hand (right or left) and side (ventral or dorsal) of the hand. Previous studies have used various methods to measure the 2D:4D ratio, including physical measurement of fingers by caliper, photocopied or scanned images of palms, and outline of the hand traced on a piece of paper. 21 , 22 , 23 Most studies measured digit lengths on the ventral side (e.g., 22 , 23 , 24 ), while others (e.g., 9 , 25 ) measured them on the dorsal side. Regardless of the method employed, it is important to minimize inter‐ and intra‐observer errors. Allaway et al. 23 compared four different methods and concluded that computer‐assisted image analysis of scanned palms provided the most accurate and consistent results between observers. This study also employed scanning‐ and computer‐assisted image analysis to measure the 2D:4D ratio. In a pilot study conducted prior to the current study, we confirmed that the ICC was 0.9732, suggesting high reproducibility of the measurements. The use of a scanner and a single researcher to measure the 2D:4D ratio is a strength of this study.
4.2. 2D:4D ratio as a biomarker of in utero androgen exposure
The present study examined the association between the 2D:4D ratio and reproductive function during adulthood, assuming that the 2D:4D ratio reflects in utero androgen exposure. The 2D:4D ratios tend to be lower in men than in women. 3 , 24 Some studies, 2 , 24 , 26 , 27 but not other, 28 targeting patients with specific clinical conditions confirmed the notion that a higher androgen exposure in utero results in a lower 2D:4D ratio after birth. It is assumed that individuals with congenital adrenal hyperplasia due to 21‐hydroxylase enzyme deficiency (21‐OHD CAH) are exposed to excess androgens in utero. Female patients with 21‐OHD CAH showed 2D:4D ratios lower than those of healthy females and similar to those of healthy males. Male patients with 21‐OHD CAH showed lower 2D:4D ratios only in the right hand compared to male and female controls. 24 The 2D:4D ratios of the right hand of female patients with 21‐OHD CAH were significantly lower than those of healthy females, and the digit ratios of the left hand of male patients with 21‐OHD CAH were lower than those of healthy males. 26 Similarly, the 2D:4D ratio of men with Klinefelter's syndrome was higher than that of their fathers and healthy males and similar to that of females. 27 In contrast, Buck et al. 28 reported no difference between females with and without 21‐OHD CAH in the 2D:4D ratio of the left hand as determined by radiography. Individuals with a 46,XY karyotype and complete androgen insensitivity syndrome showed 2D:4D ratios similar to those of typical women and higher than those of typical men. 2 Lutchmaya et al. 5 measured testosterone and estradiol concentrations in amniotic fluid and examined their association with a child's 2D:4D ratio at 2 years of age. While there were no significant associations between the 2D:4D ratio of either hand and testosterone or estradiol, there was a significant negative association between the testosterone‐to‐estradiol ratio and the 2D:4D ratio of the right hand, but not the left hand. 5 The findings of Lutchmaya et al. 5 were not replicated in a recent study. 29 Considering the findings from these studies, we conclude that the 2D:4D ratio is not perfect but a potential biomarker of androgen exposure in utero.
4.3. Left‐ and right‐hand 2D:4D ratio and reproductive function of men without a known history of infertility
In the whole sample, we found a negative correlation between the left‐hand 2D:4D ratio and total sperm count, which is in contrast with the two studies 3 , 9 reporting negative associations between the 2D:4D ratio of the right hand and total sperm count. There was no association between the 2D:4D ratio of the left hand and the total sperm count in one study, 3 and the 2D:4D ratio of the left hand was not measured in another study. 9 In contrast to these studies, Bang et al. 8 reported a positive association between the right‐hand 2D:4D ratio and total sperm count only when the samples were limited to those with 2D:4D ratios lower than 1. Lu et al. 14 found no significant correlations between the 2D:4D ratio of either hand and sperm motility among healthy controls. We do not know why there are such discrepancies between the left‐ and right‐hand 2D:4D ratios in relation to the sperm count.
We found negative associations between FSH and 2D:4D ratios of both hands in the whole sample, as well as in the lower semen quality groups. This is in contrast to the non‐significant associations reported in previous studies. 3 , 13 In the present study, only the lower semen quality group and the whole sample right‐hand 2D:4D ratios showed a significant negative correlation with testosterone concentration, which contrasts with the findings of Honekopp et al. 13 and Bang et al. 8 It should be noted that Bang et al. 8 reported a positive association only in the subgroup of men whose 2D:4D ratio of the right hand was higher than 1 but not among those with a 2D:4D ratio lower than 1. Only 15 of the present participants showed right‐hand 2D:4D ratio higher than 1, thus we did not perform analyses stratifying by this specific cut‐off value. Of note, venous blood collection was not performed at a specific time of the day for all participants, although serum testosterone levels in men aged 30–40 years tend to be 20%–25% lower at 1600 h compared to the levels at 0800 h. 30 If the samples were collected only in the morning, the associations between testosterone and other variables could have been more clearly evaluated. In the present study, as well as in Bang et al. 8 LH was not significantly correlated with the 2D:4D ratio. A positive association between LH and 2D:4D in the right hand but not in the left hand was reported by Manning et al. after adjusting for covariates. 3 Among azoospermic patients, both LH and FSH levels were positively associated with the 2D:4D ratios of both hands. 16 Negative associations between the 2D:4D ratio of the right hand and testosterone have been reported by Manning et al., 3 which reported no significant association between the 2D:4D ratio of the left hand and testosterone concentration.
4.4. Left‐ and right‐hand 2D:4D ratio and reproductive function of infertile men
No differences in 2D:4D ratios were found between the lower and higher semen quality groups in the present sample, suggesting that 2D:4D ratio is not related to semen quality among infertile men. This is consistent with the findings of Auger and Eustache 9 that the 2D:4D ratio did not differ between fertile men and testicular cancer patients, whereas testicular cancer patients were younger and their sperm concentration and count were lower than that in fertile men. The co‐occurrence of testicular cancer and decreased semen quality was observed in a prospective cohort study 31 of 32 442 Danish men, which showed that males with lower semen quality had a higher risk of developing testicular cancer compared to those with higher semen quality. Jacobsen et al.'s 31 finding is in line with the hypothesis proposed by Skakkebæk et al. 1 that testicular cancer is a pathological condition that can be summarized in the TDS category. TDS is thought to be the result of endocrine disruption caused by environmental factors in the programming of embryonic sexual maturation, 1 however neither the present nor the previous study 9 supports the hypothesis. It is possible that 2D:4D ratio may not reflect individual differences in androgen exposure in the uterus, or factors other than androgen exposure are causing both testicular cancer and poor semen quality.
In a study in China, sperm motility was negatively associated with the 2D:4D ratio of both hands in infertile men (N = 196), whereas no significant association was observed among control men (N = 72). 14 Wood et al. 15 reported that the 2D:4D ratios of men with acquired forms of azoospermia were lower than those of men with nonobstructive azoospermia. We could not perform a similar analysis because of the limited number of patients with azoospermia (N = 1). The findings of previous studies targeting infertile men also vary, and no clear conclusion can be drawn regarding the relationship between the 2D:4D ratio and the reproductive function of men.
In conclusion, correlations between the 2D:4D ratios and male reproductive function were mostly weak or insignificant. Findings from the present and previous studies are not consistent, reflecting, at least in part, the variability in methodologies. The variability of the 2D:4D ratio and its association with reproductive function across populations of different racial or ethnic origins is an understudied area. Future studies targeting fertile men using the same methodology are warranted to examine the associations between the 2D:4D ratio and reproductive function in men.
FUNDING INFORMATION
This research was funded by the Japan Society for the Promotion of Science (JSPS) Topic‐Setting Program to Advance Cutting‐Edge Humanities and Social Sciences Research, Global Initiatives, Grant Number JSPS00119217822 (P.I.: S.K.) and JSPS KAKENHI 22K10484 (P.I.: S.K.).
CONFLICT OF INTEREST
There is no conflict of interest to declare. Human rights statements and informed consent: All procedures followed were in accordance with the ethical standards of the responsible committee on human experimentation (institutional and national) and with the Helsinki Declaration of 1964 and its later amendments. Informed consent was obtained from all patients for being included in the study. This study was approved by the Institutional Research Ethics Committees of the Graduate School of Medicine and Faculty of Medicine, University of Tokyo (2020057NI‐(2)), Tsukuba Gakuen Hospital (20–07), and the International University of Health and Welfare (20‐S‐8).
Supporting information
Figure S1: Scatter plot of sperm concentration and 2D:4D ratios (A: left hand, B: right hand) and total sperm motility and 2D:4D (C: left hand, D: right hand) by semen quality category. The horizontal lines correspond to the WHO reference value of 16 million/ml (A and B) or 42% (C) and (D). Men in the lower semen quality group showed sperm count <39 million, sperm concentration <16 million/ml, or total motility <42%. All the other participants were categorized as the higher semen quality group.
Figure S2: Scatter plot of LH and 2D:4D ratios (A: left hand, B: right hand) and testosterone and 2D:4D ratios (C: left hand, D: right hand) by semen quality category. Men in the lower semen quality group showed sperm count <39 million, sperm concentration < 16 million/ml, or total motility <42%. All other participants were categorized as the higher semen quality group.
Figure S3: Scatter plot of age and 2D:4D ratios (A: left hand, B: right hand) and height and 2D:4D ratios (C: left hand, D: right hand) by semen quality category. Men in the lower semen quality group showed sperm count <39 million, sperm concentration < 16 million/ml, or total motility <42%. All other participants were categorized as the higher semen quality group.
Figure S4: Scatter plot of weight and 2D:4D ratios (A: left hand, B: right hand) and BMI and 2D:4D ratios (C: left hand, D: right hand) by semen quality category. Men in the lower semen quality group showed sperm count <39 million, sperm concentration < 16 million/ml, or total motility <42%. All other participants were categorized as the higher semen quality group.
Figure S5: Scatter plot of the mean testis volume and 2D:4D ratios (A: left hand, B: right hand) and semen volume and 2D:4D ratios (C: left hand, D: right hand) by semen quality category. Men in the lower semen quality group showed sperm count <39 million, sperm concentration < 16 million/ml, or total motility <42%. All other participants were categorized as the higher semen quality group.
ACKNOWLEDGMENTS
We thank all participants in this study. Special thanks to Mr. Tatsuji Ihana for his help in conducting the study.
Uchida M, Iwamoto T, Yamasaki K, Kariya F, Konishi S. The ratio of 2nd to 4th digit length and reproductive function of infertile male patients. Reprod Med Biol. 2023;22:e12500. 10.1002/rmb2.12500
REFERENCES
- 1. Skakkebæk NE, Rajpert‐De Meyts E, Main KM. Testicular dysgenesis syndrome: an increasingly common developmental disorder with environmental aspects. Hum Reprod. 2001;16(S103):972–8. [DOI] [PubMed] [Google Scholar]
- 2. Berenbaum SA, Bryk KK, Nowak N, Quigley CA, Moffat S. Fingers as a marker of prenatal androgen exposure. Endocrinology. 2009;150(11):5119–24. [DOI] [PMC free article] [PubMed] [Google Scholar]
- 3. Manning JT, Scutt D, Wilson J, Lewis‐Jones DI. The ratio of 2nd to 4th digit length: a predictor of sperm numbers and concentrations of testosterone, luteinizing hormone and oestrogen. Hum Reprod. 1998;13(11):3000–4. [DOI] [PubMed] [Google Scholar]
- 4. McIntyre MH. The use of digit ratios as markers for perinatal androgen action. Reprod Biol Endocrinol. 2006;4(1):1–9. [DOI] [PMC free article] [PubMed] [Google Scholar]
- 5. Lutchmaya S, Baron‐Cohen S, Raggatt P, Knickmeyer R, Manning JT. 2nd to 4th digit ratios, fetal testosterone and estradiol. Early Hum Dev. 2004;77(1–2):23–8. [DOI] [PubMed] [Google Scholar]
- 6. Kondo T, Zakany J, Innis JW, Duboule D. Of fingers, toes and penises. Nature. 1997;390:29. [DOI] [PubMed] [Google Scholar]
- 7. Malas MA, Dogan S, Hilal Evcil E, Desdicioglu K. Fetal development of the hand, digits and digit ratio (2D: 4D). Early Hum Dev. 2006;82(7):469–75. [DOI] [PubMed] [Google Scholar]
- 8. Bang AK, Carlsen E, Holm M, Petersen JH, Skakkebaæk NE, Jørgensen N. A study of finger lengths, semen quality and sex hormones in 360 young men from the general Danish population. Hum Reprod. 2005;20(11):3109–13. [DOI] [PubMed] [Google Scholar]
- 9. Auger J, Eustache F. Second to fourth digit ratios, male genital development and reproductive health: a clinical study among fertile men and testis cancer patients. Int J Androl. 2011;34(4pt2):e49–58. [DOI] [PubMed] [Google Scholar]
- 10. Firman RC, Simmons LW, Cummins JM, Matson PL. Are body fluctuating asymmetry and the ratio of 2nd to 4th digit length reliable predictors of semen quality? Hum Reprod. 2003;18(4):808–12. [DOI] [PubMed] [Google Scholar]
- 11. Klimek M, Galbarczyk A, Nenko I, Alvarado LC, Jasienska G. Digit ratio (2D:4D) as an indicator of body size, testosterone concentration and number of children in human males. Ann Hum Biol. 2014;41(6):518–23. [DOI] [PubMed] [Google Scholar]
- 12. Muller DC, Giles GG, Bassett J, Morris HA, Manning JT, Hopper JL, et al. Second to fourth digit ratio (2D:4D) and concentrations of circulating sex hormones in adulthood. Reprod Biol Endocrinol. 2011;9(1):1–11. [DOI] [PMC free article] [PubMed] [Google Scholar]
- 13. Hönekopp J, Bartholdt L, Beier L, Liebert A. Second to fourth digit length ratio (2D:4D) and adult sex hormone levels: new data and a meta‐analytic review. Psychoneuroendocrinology. 2007;32(4):313–21. [DOI] [PubMed] [Google Scholar]
- 14. Lu H, Huo Z h, Liu YJ, Shi ZY, Zhao JL. Correlations between digit ratio and infertility in Chinese men. Early Hum Dev. 2012;88(11):865–9. [DOI] [PubMed] [Google Scholar]
- 15. Wood S, Vang E, Manning J, Walton J, Troup S, Kingsland C, et al. The ratio of second to fourth digit length in azoospermic males undergoing surgical sperm retrieval: predictive value for sperm retrieval and on subsequent fertilization and pregnancy rates in IVF/ICSI cycles. J Androl. 2003;24(6):871–7. [DOI] [PubMed] [Google Scholar]
- 16. Manning JT, Wood S, Vang E, Walton J, Bundred PE, van Heyningen C, et al. Second to fourth digit ratio (2D:4D) and testosterone in men. Asian J Androl. 2004;6(3):211–5. [PubMed] [Google Scholar]
- 17. Konishi S, Moriki Y, Kariya F, Akagawa M. Casual sex and sexlessness in Japan: a cross‐sectional study. Sexes. 2022;3:254–66. [Google Scholar]
- 18. Semen Analyses Standaidization Guidelines (Seieki kensa hyojunka guideline). The Japanese Urological Association, Editor. The working Group for Creating Semen Analyses Standardization Guidelines. Tokyo: Kanahara & CO., LTD; 2003. [Google Scholar]
- 19. Campbell MJ, Lotti F, Baldi E, Schlatt S, Festin MPR, Björndahl L, et al. Distribution of semen examination results 2020 – a follow up of data collated for the WHO semen analysis manual 2010. Andrology. 2021;9(3):817–22. [DOI] [PubMed] [Google Scholar]
- 20. WHO. World Health Organization . WHO laboratory manual for the examination and processing of human semen. World Health Organization, Department of Reproductive Health and Research. 6th ed. Geneva, Switzerland: WHO Press; 2021. Available at. https://www.who.int/publications/i/item/9789240030787 [Google Scholar]
- 21. Peters M, Mackenzie K, Bryden P. Finger length and distal finger extent patterns in humans. Am J Phys Anthropol. 2002;117(3):209–17. [DOI] [PubMed] [Google Scholar]
- 22. Manning JT, Fink B, Neave N, Caswell N. Photocopies yield lower digit ratios (2D:4D) than direct finger measurements. Arch Sex Behav. 2005;34(3):329–33. [DOI] [PubMed] [Google Scholar]
- 23. Allaway HC, Bloski TG, Pierson RA, Lujan ME. Digit ratios (2D:4D) determined by computer‐assisted analysis are more reliable than those using physical measurements, photocopies, and printed scans. Am J Hum Biol. 2009;21(3):365–70. [DOI] [PMC free article] [PubMed] [Google Scholar]
- 24. Ökten A, Kalyoncu M, Yariş N. The ratio of second‐ and fourth‐digit lengths and congenital adrenal hyperplasia due to 21‐hydroxylase deficiency. Early Hum Dev. 2002;70(1–2):47–54. [DOI] [PubMed] [Google Scholar]
- 25. Kumar S, Voracek M, Singh M. Sexual dimorphism in digit ratios derived from dorsal digit length among adults and children. Front Endocrinol (Lausanne). 2017;8:1–8. [DOI] [PMC free article] [PubMed] [Google Scholar]
- 26. Brown WM, Hines M, Fane BA, Breedlove SM. Masculinized finger length patterns in human males and females with congenital adrenal hyperplasia. Horm Behav. 2002;42(4):380–6. [DOI] [PubMed] [Google Scholar]
- 27. Manning JT, Kilduff LP, Trivers R. Digit ratio (2D:4D) in Klinefelter's syndrome. Andrology. 2013;1(1):94–9. [DOI] [PubMed] [Google Scholar]
- 28. Buck JJ, Williams RM, Hughes IA, Acerini CL. In‐utero androgen exposure and 2nd to 4th digit length ratio—comparisons between healthy controls and females with classical congenital adrenal hyperplasia. Hum Reprod. 2003;18(5):976–9. [DOI] [PubMed] [Google Scholar]
- 29. Richards G, Browne WV, Constantinescu M. Digit ratio (2D:4D) and amniotic testosterone and estradiol: an attempted replication of Lutchmaya et al. (2004). J Dev Orig Health Dis. 2021;12(6):859–64. [DOI] [PubMed] [Google Scholar]
- 30. Brambilla DJ, Matsumoto AM, Araujo AB, McKinlay JB. The effect of diurnal variation on clinical measurement of serum testosterone and other sex hormone levels in men. J Clin Endocrinol Metab. 2009;94(3):907–13. [DOI] [PMC free article] [PubMed] [Google Scholar]
- 31. Jacobsen R, Bostofte E, Engholm G, et al. Risk of testicular cancer in men with abnormal semen characteristics: cohort study. Br Med J. 2000;321(7264):789–92. [DOI] [PMC free article] [PubMed] [Google Scholar]
Associated Data
This section collects any data citations, data availability statements, or supplementary materials included in this article.
Supplementary Materials
Figure S1: Scatter plot of sperm concentration and 2D:4D ratios (A: left hand, B: right hand) and total sperm motility and 2D:4D (C: left hand, D: right hand) by semen quality category. The horizontal lines correspond to the WHO reference value of 16 million/ml (A and B) or 42% (C) and (D). Men in the lower semen quality group showed sperm count <39 million, sperm concentration <16 million/ml, or total motility <42%. All the other participants were categorized as the higher semen quality group.
Figure S2: Scatter plot of LH and 2D:4D ratios (A: left hand, B: right hand) and testosterone and 2D:4D ratios (C: left hand, D: right hand) by semen quality category. Men in the lower semen quality group showed sperm count <39 million, sperm concentration < 16 million/ml, or total motility <42%. All other participants were categorized as the higher semen quality group.
Figure S3: Scatter plot of age and 2D:4D ratios (A: left hand, B: right hand) and height and 2D:4D ratios (C: left hand, D: right hand) by semen quality category. Men in the lower semen quality group showed sperm count <39 million, sperm concentration < 16 million/ml, or total motility <42%. All other participants were categorized as the higher semen quality group.
Figure S4: Scatter plot of weight and 2D:4D ratios (A: left hand, B: right hand) and BMI and 2D:4D ratios (C: left hand, D: right hand) by semen quality category. Men in the lower semen quality group showed sperm count <39 million, sperm concentration < 16 million/ml, or total motility <42%. All other participants were categorized as the higher semen quality group.
Figure S5: Scatter plot of the mean testis volume and 2D:4D ratios (A: left hand, B: right hand) and semen volume and 2D:4D ratios (C: left hand, D: right hand) by semen quality category. Men in the lower semen quality group showed sperm count <39 million, sperm concentration < 16 million/ml, or total motility <42%. All other participants were categorized as the higher semen quality group.