

Abstract

Heterogeneous catalytic hydrogenation is an interesting alternative to conventional methods that use inorganic hydrides. The hydrogenation of acetophenone under heterogeneous conditions with the supported catalysts based on Ni is the most useful due to its redox properties and lower cost. As is well-known, catalyst support can significantly affect catalyst performance. We have investigated the influence of various physical-chemical parameters on the selective reaction of the hydrogenation of acetophenone by using different nickel catalysts on clinoptilolite supports, in four different forms: natural, previously modified with NH3 (Ni/Z+NH4+), with HNO3 (Ni/Z+H+), and thermally treated (Ni/Z 500 °C). In particular, our work focuses on determining the influence of the mentioned physical-chemical parameters on the percentages of conversion and the selectivity of the catalysis. This study aims to identify the combination of parameters that allows for obtaining the best catalytic results. The identification of the physical-chemical parameters that determine the percentages of conversion and selectivity allows us to design optimal catalysts.
Introduction
Hydrogenation of aromatic ketones such as acetophenone is a widely used reaction for obtaining alcohols used as intermediates in the synthesis of pharmaceutical compounds and fine chemicals.1 In particular, the hydrogenation of acetophenone is interesting due to the primary reaction product 1-phenylethanol (Phel).2 Direct hydrogenation with a pressure of H2 gas and transfer hydrogenation (TH) are the used strategies for hydrogenation.3
The process of hydrogenation of molecules that have conjugated C=C and C=O groups, such as α, β-unsaturated aldehydes or ketones, can be complex given the coexistence of two or more functional groups of comparable reactivity since the hydrogenation of the bond C=C is thermodynamically more favorable than that of C=O.
From this point of view, the selective hydrogenation of aromatic ketones to their corresponding alcohol is a complicated reaction due to the great variety of products that can be obtained, both from the hydrogenation of the aromatic ring and from the hydrogenolysis of the produced alcohols.4 Therefore, the design of catalytic systems with high selectivity to the desired product remains a fundamental objective in the study of this type of reaction. In this sense, heterogeneous catalytic hydrogenation is an interesting alternative to conventional methods that use inorganic hydrides (LiAlH4 or NaBH4), due to the reduction of toxic waste and the possibility of recovering and reusing the catalyst.5,6 The hydrogenation of acetophenone under heterogeneous conditions has been studied with several supported monometallic catalysts based on Pt,2,7,8 Pd,9 Ru,10 and Ni.10−18 The Cu/SiO2 showed a very good activity with a selectivity of 100% toward the alcohol 1-phenyl ethanol.18 Among these systems, supported catalysts based on Ni are the most useful due to their redox properties and their lower cost than those based on noble metals such as Pt, Pd, etc.
The activity, selectivity, and stability of several Ni and Ni–Pt catalysts supported on synthetic zeolite were studied by Rajashekharam et al.11,19 Their research has focused on 10% and 20% Ni catalysts on synthetic HZSM5 and HY high surface area zeolites in the hydrogenation of acetophenone. Their work studied the variation of the conversion and the selectivity with the activation temperature and the percentage of nickel used. Using theoretical models to explain the effect caused by water adsorbed on the surface of the support during the reaction gives rise to the limiting factor of the reaction rate.
Noble metals show the best activity and selectivity with regard to the reforming process under the same reaction conditions, particle size, and dispersion. For the dry reforming of methane (DRM), Ni (in other non-noble metals in the transition metal group) have proved to be efficient and the best choice of active metal catalyst by exhibiting low cost and high activity.20−22 Besides, transition metal-based catalysts, in particular nickel, are excellent for biomass gasification due to their high activities in tar elimination and ability to improve gas quality.23 The Ni-based catalysts are used for tunable selectivity in CO2 hydrogenation considering the size Ni particles.24 In general, highly active and stable catalytic materials with transition metal as the active component is a key issue in high-temperature catalytic processes including catalytic reforming for energy conversion and chemical production.25
In this work, we have investigated the influence of several physical-chemical properties in the selective reaction of hydrogenation of acetophenone by using nickel catalysts on clinoptilolite supports, in four different forms: natural, previously modified NH3; with HNO3 and calcined at 500 °C. The influence on the activity of the chemical and physical properties produced by the modification of the support was studied. In particular, the specific surface area, porosity, acid, hydroadsorption and redox properties of the catalyst were analyzed. In particular, the optical dynamic laser speckle technique was used to quantify the characteristic time τ for the hydroadsorption of all catalysts. This technique is easy to implement, economical, and nondestructive. Then, it represents an ideal tool to obtain a linear correlation between hydroadsorption and the respective specific surface area26
Materials and Methods
Methods for Catalyst Characterization
All the catalysts were characterized by conventional physical-chemical techniques such as X-ray diffraction using a Philips PW 1714 diffractometer with CuKα radiation and Ni filter in a measurement range of 2 from 5 to 70°, SEM-EDS electron microscopy using a PHILIPS scanning electron microscope (model SEM 505), with a dispersive energy microanalysis system of RX (EDS-EDAX 9100), and FTIR spectroscopy with a Bruker brand spectrophotometer (model EQUINOX 55) in the range of 4000 to 400 cm–1.
The zeolite clinoptilolite chosen as support is a mineral from La Rioja, Argentine, widely described in a previous report.27 The original material was modified in the following way: zeolite was ground manually until obtaining a powder of very fine granules. 1 g of the solid was treated with 10 mL of ammonium hydroxide (1 M) solution for the basic modification and 1 g of the solid was treated with 10 mL of nitric acid (1 M) for the acid modification. Samples were heated at 70 °C and magnetically stirred for 12 h. The solid samples were separated by filtration and washed with distilled water several times until neutral pH was obtained in the residue. Finally, 1 g of natural zeolite was thermally treated at 500 °C for 2 h. The incipient wetness impregnation method was used for the preparation of catalysts. An aqueous solution of Ni (NO3)2·6H2O of adequate concentration to obtain a 5% w/w of Ni content, was used. The catalyst was dried at 110 °C for 24 h and then calcined at 500 °C for 4 h. Finally, all samples were reduced at 500 °C in H2 flow (H2 flow rate: 30 mL/min, oven ramp: 10 °C/min).
The study of the redox sites influence was carried out by the TPR programmed temperature reduction technique by a homemade reactor using a 10% H2 flow in N2 atmosphere, with a flow rate of 20 mL/min and ramp of heating of 10 °C/min at a maximum temperature of 800 °C.28 The experimental values obtained for each sample were fitted with the order n′ model of nuclei (Avrami-Erofeev). In this case, the curve that describes the TPR curve (dα/dT vs T), is defined by eq 1:29,30
| 1 |
where x = ER/RT, R is the gas constant, β is the slope of the temperature variation, A0 and ER are the exponential factors and the activation energy of the Arrhenius equation, respectively.
The textural characterization was carried out by N2 adsorption isotherms at 77 K by using automatic Micromeritics ASAP 2020 equipment.
To fit the experimental adsorption curves, various adsorption isotherms were used to obtain the specific surface area. In addition, the volume distribution of the pores is determined by applying the VBS (Villareal, Barrera, and Sapag) method to the experimental values of nitrogen adsorption. This method is an improvement of the traditional BJH method, which overestimates the volume of the pores.31
To perform hydroadsorption measurements, the speckle laser dynamic (DSL) technique, described by Mojica et. al.,26,27 was used. In this method, the speckle patterns were processed using the second-order moment of inertia method. The temporal evaluation of this parameter allowed us to obtain the characteristic times τ of hydroadsorption for each catalyst using the model proposed in ref (32).
Potentiometric Titration with n-Butylamine
The acid strength of the systems was determined by potentiometric titration with n-butylamine (bta).33 50 mg of catalyst was added to 50 mL of acetonitrile with magnetic stirring. It was stabilized for 5400 s under magnetic stirring. After that, the titration was performed with n-butylamine (bta) 0.025N (in CH3CN) adding 0.05 mL every 2 min. The procedure of titration was automatically performed in a titrator “794 Basic Titrino of Metrohm” with Metrohm electrode (the measure was in mV). The potential difference measured by the titration system can be expressed using an expression similar to the classic Nernst equation, given by
| 2 |
where ΔVa and k are constants, aunneutralized = 1 for considering that the initial potential ΔVi measured at the beginning of the reaction is the total acid strength. Besides, “aneutralized” is related to the total number of acid sites that can be measured by the mequiv of bta/g of catalysts
| 3 |
where k′ is constant dependent on the intrinsic characteristics of the cell (reference, indicator, and contact), determined by using the experimental values of the titration:ΔVa = −76.9071 ± 9.3275; k′ = 13.4731 ± 0.8505. The potential difference (ΔVi) measured vs the milliequivalents (mequiv of bta) added per gram of the catalysts were graphed, and the resultant function can be modeled by
| 4 |
where ΔV0 is a constant dependent on the acid strength of the solid surface, n is a value associated with the neutralization; m represents milliequivalents of bta per gram of catalysts and bi is a constant determined by regression analysis. The curve is asymptotic, so it takes a long time to reach the stable and final value of ΔVf.
| 5 |
The limit required to reach the plateau defined
by eq 5 is the total
number of acid sites. For the ΔVf, the value of mequiv of bta is designed as mequivf/(g
of catalyst). Due to the considerable time of stabilization, a determination
of ΔVf criteria was established:
ΔV = fΔVf, where f is considered 90% of the expected
value and for which the mequivf/(g of catalyst) was determined.
In general, for the equipment calibration, the strength of the acid
sites in the solid is assigned according to the potential (ΔV0).34 Finally, the
relative strength acid was calculated as  .
.
Hydrogenation Analysis
The hydrogenation reactions of acetophenone were carried out in a batch reactor, autoclave type, using a pressure of H2 of 10 atm, at a temperature of 80 °C and using 60 mL of n-heptane as a solvent. In each test, 0.25 g of catalyst and an amount of ketone of 4.6 mmol/g of catalyst were used.
The progress of the reaction was followed by gas chromatography. For this purpose, we used a gaseous Varian CP-3800 gas chromatograph equipped with an FID detector and a CP wax 52 CB capillary column (30 m × 0.53 mm, DF = 1.0 m). The reaction products were identified through patterns and by mass spectrometry, in a Shimadzu QP5050 GC/MS equipment with a SUPELCO SPBTM-5 capillary column (30m × 0.25 mm d.i.) during 2 h.
Results and Discussion
Hydrogenation of Acetophenone
The selectivity of the different products at 10% conversion is described in Table 1 for the different catalysts. The systems were highly selective to the desired product, 1-phenylethanol (PE), reaching a selectivity of 95%. Minor products were obtained cyclohexylmethyl ketone (CHK), the product of the hydrogenation of the aromatic ring, and cyclohexyl ethanol (CE) from the hydrogenation of PE.
Table 1. Percent Selectivity to Products at 10% Conversion.
| Catalyst | Conv. | SEC | SEB | SCHK | SCE | SPE |
|---|---|---|---|---|---|---|
| Ni/Z | 50.00 | 3.40 | 3.50 | 93.10 | ||
| Ni/Z 500 °C | 9.00 | 3.20 | 2.20 | 92.40 | ||
| Ni/Z+NH4+ | 21.00 | 3.50 | 2.50 | 93.60 | ||
| Ni/Z+H+ | 19.00 | 0.30 | 2.10 | 2.50 | 95.10 |
A minimal amount of ethylbenzene (EB) has been detected, the formation of which can be explained by hydrogenolysis of the C–O bond of the intermediate alcohols or by initial hydrogenation of the C=O bond followed by dehydration, with the formation of C = C bond, and subsequent addition of hydrogen to this new bond formed.35−37 As can be observed in Table 1, all the catalysts studied show different conversion values. In order to explain this result, we must evaluate and correlate the relationship between the chemical, textural, acidity, redox, and hygroscopic properties with selectivity and conversion percentage. These physicochemical properties will be evaluated and discussed in the following section.
Characterization of the Catalyst
SEM-EDS
Figure 1 shows the SEM-EDS results for all the catalysts, together with the standard deviation (the deviation is obtained from different points in the sample), which indicates the small variations in the relative distribution. Lower standard deviation values indicate the samples tend to be similar or quite homogeneous. Figure 1b (right) shows an SEM image with a magnification of 1000× corresponding to the Ni/Z. In this case, a quite regular surface is observed. In previous work,38 Ni-based catalysts were analyzed by using TEM showing particles with an average diameter of the order 10 nm. In Figure 1b (left), the spectrum corresponding to the Ni/Z sample is depicted. The highest peak corresponds to Si. Notice Si is the element with the highest abundance.
Figure 1.

(a) SEM-EDS data of the major elements present in the analyzed catalysts and (b) EDS spectrum and SEM image corresponding to Ni/Z.
The activity corresponding to Ni/Z and Ni/Z-H+ catalysts with similar Ni contents were very different (50 and 19% conversion, respectively). Then, no direct correlation was observed between activity and chemical composition or Ni concentration. Note that the Ni content does not explain the difference in conversion rates.
FTIR Spectroscopy
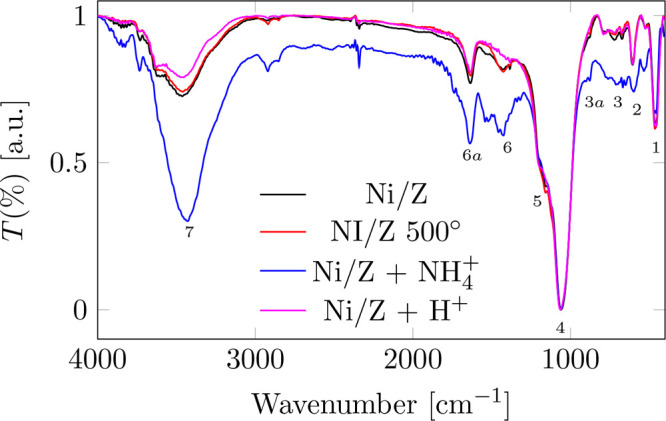
The FTIR spectra of the materials are shown in Figure 2. Bands are observed in the range of 3600 cm–1 to 1600 cm–1 which can be assigned to the modes of stretch and bending of the water molecules. Indeed, the absorption band in the range 3750–3745 cm–1 is typical of silanols isolated on the external surface. On the other hand, the strongest interactions with hydrogen bonds give rise to very broad bands in the range of 3650–3200 cm–1 Additionally, the natural frequency of stretching from N–N between 2295 and 2299 cm–1 is observed.
Figure 2.
FTIR infrared spectrum of catalysts.
The 4,5 bands observed in the range between 1200 and 1000 cm–1 are assigned to the T-O stretching modes (T = Si or Al) due to the TO4 tetrahedral groups (SiO4 and AlO4).39 Some of these bands are due to the intense antisymmetric stretching bands of the Si–O bonds of the silicon tetrahedron. Others bands have their origin in the type of bond between them. The former is common to any type of silicate or aluminosilicate, whether amorphous or crystalline and insensitive to the type of union between the tetrahedrons, while the position and intensity of the latter will be influenced by the crystalline structure. However, both are closely coupled which makes it difficult to distinguish. The observed bands 5,2 at 1206 and 607 cm–1 are assigned to the asymmetric and symmetric stretching modes of the internal tetrahedral groups, while those 4,3 at 1053 and 794 cm–1 are associated with the asymmetric and symmetric stretching modes. external links, respectively.32 The 1 band observed in the 400 cm–1 region is attributed to the deformation modes of these tetrahedral groups. The Z-NH4+ spectrum in the range from 3900 to 3200 cm–1, bands 7 assigned to NH stretching appear due to the presence of NH4 bound to the surface. Band 6a at 1632 cm–1 results from the superposition of the ammonium component and the mode corresponding to the deformation of the adsorbed H2O. The spectra of the acid form of the zeolite show that the external asymmetric mode νaT-O-T shifts slightly to higher wave numbers than the natural zeolite. Two new bands appear in this spectrum. Band 6, at 1384 cm–1, is attributed to asymmetric stretching modes of the N–O bonds of the surface nitrate groups, generated by treatment with NH4. Band 3a, observed at 955 cm–1, is assigned to the Si–OH stretching mode, a typical Brönsted acid site.
The behavior observed between 1200 and 400 cm–1 corresponds to the Si–O and Al–O bonds, stretching modes, and angular deformation.32
The patterns corresponding to the analyzed samples in Figure 3 are similar. This fact indicates that the structure is maintained with the different treatments. However, the X-ray diffraction lines of the calcined samples are shifted slightly to lower 2θ angles, probably due to the increased cell volume. Theoretical spectrum analysis shows that peaks defined as 1 and 2 correspond to (h, k, l = 2, – 1.0; d = 9.18 and multiplicity = 6) and (h, k, l = 4, – 2, 1; d = 3.92) On the other hand was observed high thermal stability up to 650 °C41,42 in the zeolite structure.
Figure 3.

Diffractograms for the catalyst samples. Theoretical spectrum based on CIF for the H38.64Al10.62K4.63Na6O91.32Si25.38 structure for zeolite is included in green.40
Textural Properties
As mentioned above, the chemical modification carried out on the supports gave rise to different textural properties such as specific surface area, volume, and pore size. Then, we evaluate the influence of the detailed properties on the catalytic activity.
The textural properties were analyzed by the N2 adsorption method. In order to fit the experimental values, several known isotherms (Langmuir, Freundlich, Temkin, BET, GAB, Oswin, Chirife, Henderson, Chung-Pfost, and Henderson26) were applied to Ni/Z, Ni/Z 500 °C, Ni/Z+NH4+, and Ni/Z+H+ samples.
Figure 4 shows the experimental results of N2 adsorption and the fitting with the different adsorption isotherms for the Ni/Z catalyst. Except for the Chung-Pfost isotherm, the other isotherms can describe the adsorption corresponding to p/p0 < 0.2 (region used for the specific surface area determination, see Figure 4b). However, the Chirife model presents a better fit to the experimental values and it permits us to obtain of the best value of the specific surface area.
Figure 4.

(a) Amount of nitrogen adsorbed as a function of the relative pressure for the Ni/Z sample with the respective fitting by using the different isotherm. (b) Inset corresponding to the relative pressure region p/p0 < 0.2.
Table 2 shows the specific surface areas (total, external, and micropores for each catalyst) for each sample determined by the BET, Chirife, and Lewicki isotherms. Using the t-method (Harkins-Jura), the values of the external specific surface area for all catalysts were obtained. By using these values and the total surface area, the pore’s surface area can be calculated (see Table 2).
Table 2. Textural Parameters: Total Specific (Stotal), External (Sext), and Pore Surface Areas (Sp) [m2/g]; pore width [Å] and fc as VBS Parameter by Adsorption of N2 Using BET, Chirife, and Lewicki Isotherms.
| Parameter | Ni/Z | Ni/Z+500 °C | Ni/Z+NH4+ | Ni/Z+H+ |
|---|---|---|---|---|
| Stotal(BET) | 7.2765 | 7.5815 | 6.8171 | 10.6051 |
| Isotherm | Chirife | Lewicki | Lewicki | Chirife |
| Stotal | 10.9032 | 12.5203 | 10.8735 | 16.1661 |
| Sext | 6.3219 | 8.5713 | 7.0076 | 9.7906 |
| Sp/Stotal [%] | 63 | 52 | 56 | 60 |
| fc | 0.0000 | 0.1240 | 0.1670 | 0.0440 |
| Pore width [Å] | 156.7 | 143.1 | 149.5 | 149.1 |
The fc parameter, indicated in Table 2, corresponds to the radius correction described by the Kelvin equation.43 This parameter is required to obtain a better description of the pores volume in the VBS method. The values of this parameter were determined using the desorption curves.
Pore distributions are shown in Figure 5, where can be seen that the Ni/Z sample has the largest volume and pore size. The other samples have a small size as reported in Table 2. The area under the pore volume vs size curve (obtained by numerical integration represents the total volume of pores) was: Ni/Z (0.0069 cm3/g), Ni/Z+NH4+ (0.0068 cm3/g), Ni/Z+H+ (0.0057 cm3/g), and Ni/Z+500 °C (0.0035 cm3/g).
Figure 5.

Distribution of size pores: pore volume dV/dDp in function of pore width [Dp] of the catalysts.
Based on the nitrogen adsorption results, we determine that there is no direct correlation between the conversion values and the pore volume. However, Figure 6 shows a linear relationship between the conversion percentages and the pore size in A represented by the following equation: conversion [%] = 3.0661(pore – width [Å]) – 433.9353. This fact indicates a direct relation between the pore size and the conversion rate.
Figure 6.

Conversion (%) vs pore width (Dp) [Å] of catalysts.
Dynamic Laser Speckle Applied to the Water Adsorption of Catalysts
The results reported by Rajashekharam et al.11 for 10 and 20% Ni catalysts on zeolite in an acetophenone hydrogenation reaction showed a strong inhibitory influence on the reaction rate due to the water formed during hydrogenation.
On the other hand, the results reported by Masson et al.12 showed the effect produced by different solvents on conversion and selectivity. The conversion rates by using a 2-propanol solvent were low. However, by using 2-propanol-water mixture, the selectivity was very high (remained close to 90%) for both a monometallic catalyst (Ni) and a bimetallic catalyst (NiCr1.5). Then, as part of the textural properties study, we analyze the hydrophilic property of the catalysts by the Dynamic Laser Speckle method (DLS).
Figure 7 shows the experimental values of the second-order inertia moment (MSO) and the fitting curves obtained using the model proposed by Mojica et al.26 Thus, the water adsorption characteristic time “τ” was determined. This value indicates the hydroadsorption capacity of each sample and represents the time in which the MSO reaches 37% of its initial value.26 This value can be linearly correlated with the specific surface area of the materials. In Table 3 are listed these values.
Figure 7.

MSO as a function of time for catalysts.
Table 3. Characteristic Times τ for the Water Adsorption for Catalysts.
| Sample | Ni/Z | Ni/Z+500 °C | Ni/Z+NH4+ | Ni/Z+H+ |
|---|---|---|---|---|
| τ [s] | 64.27 | 86.14 | 63.23 | 113.67 |
| SBet(g/m2) | 7.2765 | 7.5815 | 6.8171 | 10.6051 |
| τd [s] | 47.25 | 29.70 | 51.65 | 7.40 |
Figure 8 shows the relationship between the specific surface areas calculated by BET and Chirife-Lewicki isotherms for the different catalyst considered. The linear relationships obtained for both cases can be described by the following equations: SChi,Lew = 0.1038τ + 4.1204 and SBET = 0.0687τ + 2.4498.
Figure 8.

Specific surface area (S) as a function of the characteristic time (τ) of the catalysts.
In Figure 9, the derivatives of the second-order moment vs time are shown. This rate reaches the maximum activity between 7 and 50 s depending on the material. A decrease in activity is observed until reaching a stationary regimen close to 300 s for all samples.
Figure 9.

MSO rate of change vs time for catalysts.
The time to reach a maximum activity (τd) is inversely proportional to the specific surface area of systems (see Table 3).
In addition, it is interesting to analyze the importance of the MSO exchange rate for each catalyst. In general; there is no direct relationship between the time τd (related to hydrophilicity) and the conversion rate. However, the DLS experimental data were very useful to indicate the effectiveness of a given dynamic process that depends on chemical and textural properties such as hydrophilicity.
It is observed that hygroscopicity influences the conversion percentage of the catalyst. In particular, catalysts with longer characteristic times have a lower conversion percentage.
Determination of Acidity by the Potentiometric Titration Method with n-Butylamine
Due to the acid properties of all samples, the influence of their acidity on the catalytic activity was studied. The potentiometric titration technique with n-butylamine is useful to estimate the level of acid strength and the number of acid sites present on the surface of the catalyst.
Figure 10 shows the potential difference Vi as a function of the mequivalents of n-butylamine per grams of catalyst for all samples. The theoretical fitting of the experimental values is represented as a continuous line using the eq 4, In this case, n = 2.
Figure 10.

Acidity curves for the catalysts.
Table 4, summarizes the values obtained according to those of ΔV0 between −100 and 0 mV. Taking into account ref,34 it can be considered that all samples contain weak acid sites.
Table 4. Summary of Acidity Parameters of the Catalyst.
| Sample | Ni/Z | Ni/Z+500 °C | Ni/Z+NH4+ | Ni/Z+H+ |
|---|---|---|---|---|
| ΔV0 [mV] | –42.30 | –26.30 | –43.80 | –10.50 |
| ΔVf [mV] | –101.52 | –89.78 | –106.02 | –86.80 |
| ΔV0 – ΔVf [mV] | 59.22 | 63.48 | 66.22 | 76.30 |
| mequivf/g of catalyst | 1.86 | 2.19 | 2.44 | 2.32 |
| Relative acid strengh | 1.40 | 2.41 | 1.51 | 7.26 |
The number of acid sites, meqivf/g of catalyst, for all samples are similar. As it is well-known, an increase in the Si/Al relation produces a decrease in covalent bond strength occurs due to the easier ionization of the proton and so, an increase in Brønsted acid strength.44
This effect can be observed in Figure 11, where a linear correlation between Si/Al relation and mequivf/g of catalyst was found for all catalyst as a function of the n-butylamine mequiv per grams of catalyst. It is also important to note that the acidity values for samples are small, and a low effect in the catalysis process is expected. However, the catalysts with lower relative acid strength show a better percentage of conversion.
Figure 11.

Si/Al ratio as a function of the final mequiv of n-butylamine per unit grams of catalyst.
Temperature-Programmed Reduction
To study the influence of the redox sites provided essentially by the ionic and metallic particles of Ni species present in all samples, temperature-programmed reduction measurements were performed. Figure 12 shows the TPR patterns for all samples. The experimental values are plotted as a continuous line while the simulations obtained by using the model of Avrami-Erofeev eq 1 of order n′ are indicated as segmented lines. The parameters used for the simulation are summarized in Table 5.
Figure 12.

TPR patterns for the catalysts and the natural zeolite at room temperature and at 500 °C.
Table 5. Summary of Parameters (ER [kJ/mol] and n′) Used in the Simulation of the Avrami-Erofeev Model of Order n′ for Zeolite (Natural and Treated) And Ni Catalysts.
| Sample | ZN | ZN 500 °C | Ni/Z |
|---|---|---|---|
| ER | 49.4 | 49.0 | 23.1; 49.0 |
| n′ | 2.4 | 2.0 | 2.2; 2.0 |
| Sample | Ni/Z+500 °C | Ni/Z+NH4+ | Ni/Z+H+ |
| ER | 22.7; 46.2 | 20.1; 23.8; 32.0 | 21.2; 23.4; 44.4 |
| n′ | 2.4; 2.2 | 3.9; 2.5;1.1 | 3.9;1.1; 1.1 |
All the catalyst patterns, show an intense signal of H2 consumption due to the reduction process of Ni2+ → Ni0 (Ni/Z+NH4+-360.5 °C; Ni/Z+H+-375 °C; Ni/Z-390 °C; and Ni/Z-500-395 °C).45−48 The remaining peaks between 600 and 800 °C for all samples are due to the collapse of the zeolite structure effect. Jones et al. attributed the signal close to 727 °C to reductions of Ni2+ → Ni+ was placed at sites in the super cage of zeolite and sodalite.49 Above this value (727 °C), the reduction continues with the formation of Ni0 and the possible reduction of Ni2+ in hexagonal prism sites.45,49
As it is observed the reduction temperature change according to the support, showing that the Ni/Z+NH4+ system presented the lowest signal indicating a lower interaction with the support. This diagram (Figure 12) shows two signals of low intensity at 411 and 504 °C. These peaks could be due to the presence of a different degree of oxidation interacting more strongly with the support.45 In Table 5, the energy values ER for different catalysts are shown. It is important to note that no relationship was found between the conversion percentage of the catalysts and the ER energy values.
Conclusions
The values of conversion and selectivity obtained in our work are similar to those reported by Rajashekharam et al.11,19 even though they used Ni catalysts with a higher surface area (500 m2/g) and supported synthetic zeolites.
All the catalysts have similar percentages of nickel but the catalytic results are very different. Our results allow us to demonstrate that the conversion percentage is directly related to the pore width.
Besides, the catalysts with lower relative acid strength show a better conversion percentage.
Catalysts with longer characteristic times have a lower conversion percentage. These characteristic times are related to the hygroscopicity of the catalyst and they were determined by using a nonconventional dynamic laser speckle technique.
The catalysts used in our analysis showed moderate activity and good selectivity toward the desired product, 1-phenylethanol. The four samples studied showed similar selectivity and different conversion. The highest conversion value is obtained for the original supported Ni zeolite, (Ni/Z). However, the different conversion percentages allow us to determine the effect of the physicochemical properties. Then, this analysis gives us the tools to design an optimized catalyst.
Also, the specific surface was calculated by using different models and the best experimental values corresponding to the Chirife and Lewicki are analyzed. A theoretical description of the TPR diagrams using the model of Avrami-Erofeev of order n′, allow determining the activation energy. In this case, we do not observe a relation between the mentioned parameters and the conversion percentages.
Acknowledgments
This work was supported by Consejo Nacional de Investigaciones Científicas y Técnicas PIP N° 00849, University of La Plata Grant N° I239, and X924, ANPCyT Grant PICT N°. 4558 and PICT-2021-CAT-I-00074.
The authors declare no competing financial interest.
References
- Hong X.; Li B.; Wang Y.; Lu J.; Hu G.; Luo M. Stable Ir/SiO2 catalyst for selective hydrogenation of crotonaldehyde. Appl. Surf. Sci. 2013, 270, 388–394. 10.1016/j.apsusc.2013.01.035. [DOI] [Google Scholar]
- Gao F.; Allian A. D.; Zhang H.; Cheng S.; Garland M. Chemical and kinetic study of acetophenone hydrogenation over Pt/Al2O3: Application of BTEM and other multivariate techniques to quantitative on-line FTIR measurements. J. Catal. 2006, 241, 189–199. 10.1016/j.jcat.2006.04.024. [DOI] [Google Scholar]
- Wang D.; Astruc D. The Golden Age of Transfer Hydrogenation. Chem. Rev. 2015, 115, 6621–6686. 10.1021/acs.chemrev.5b00203. [DOI] [PubMed] [Google Scholar]
- Abu-Reziq R.; Avnir D.; Blum J. Catalytic hydrogenolysis of aromatic ketones by a sol–gel entrapped combined Pd-[Rh(cod)Cl]2 catalyst. J. Mol. Catal. A: Chem. 2002, 187, 277–281. 10.1016/S1381-1169(02)00235-2. [DOI] [Google Scholar]
- Burke S. D.; Danheiser R. L.. Handbook of Reagents for Organic Synthesis, Oxidizing and Reducing Agents, 1st ed.; Wiley–VCH: Weinheim, Germany, 1999. [Google Scholar]
- Seyden-Penne J.Reductions by the Alumino and Borohydrides in Organic Synthesis, 2nd ed.; Wiley–VCH: Weinheim, Germany, 1997. [Google Scholar]
- Santori G. F.; Moglioni A. G.; Vetere V.; Iglesias G. Y. M.; Casella M. L.; Ferretti O. A. Hydrogenation of aromatic ketones with Pt- and Sn-modified Pt catalysts. Appl. Catal., A 2004, 269, 215–223. 10.1016/j.apcata.2004.04.020. [DOI] [Google Scholar]
- Chen C.-S.; Chen H.-W.; Cheng W.-H. Study of selective hydrogenation of acetophenone on Pt/SiO2. Appl. Catal., A 2003, 248, 117–128. 10.1016/S0926-860X(03)00156-X. [DOI] [Google Scholar]
- Lenarda M.; Casagrande M.; Moretti E.; Storaro L.; Frattini R.; Polizzi S. Selective catalytic low pressure hydrogenation of acetophenone on Pd/ZnO/ZnAl2O4. Catal. Lett. 2007, 114, 79–84. 10.1007/s10562-007-9046-4. [DOI] [Google Scholar]
- Malyala R.; Rode C.; Arai M.; Hegde S.; Chaudhari R. Activity, selectivity and stability of Ni and bimetallic Ni–Pt supported on zeolite Y catalysts for hydrogenation of acetophenone and its substituted derivatives. Appl. Catal., A 2000, 193, 71–86. 10.1016/S0926-860X(99)00442-1. [DOI] [Google Scholar]
- Rajashekharam M.; Bergault I.; Fouilloux P.; Schweich D.; Delmas H.; Chaudhari R. Hydrogenation of acetophenone using a 10% Ni supported on zeolite Y catalyst: kinetics and reaction mechanism. Catal. Today 1999, 48, 83–92. 10.1016/S0920-5861(98)00361-7. [DOI] [Google Scholar]
- Masson J.; Cividino P.; Court J. Selective hydrogenation of acetophenone on chromium promoted Raney nickel catalysts. III. The influence of the nature of the solvent. Appl. Catal., A 1997, 161, 191–197. 10.1016/S0926-860X(97)00068-9. [DOI] [Google Scholar]
- Masson J.; Vidal S.; Cividino P.; Fouilloux P.; Court J. Selective hydrogenation of acetophenone on chromium promoted raney nickel catalysts: II. Catalytic properties in the hydrogenation of acetophenone, determination of the reactivity ratios as selectivity criteria. Appl. Catal., A 1993, 99, 147–159. 10.1016/0926-860X(93)80096-9. [DOI] [Google Scholar]
- Kumbhar P. S. Nickel supported on titania-silica: preparation, characterisation and activity for liquid phase hydrogenation of acetophenone. Appl. Catal., A 1993, 96, 241–252. 10.1016/0926-860X(90)80013-5. [DOI] [Google Scholar]
- Bonnier J.M.; Court J.; Wierzchowski P.T.; Hamar-Thibault S. Unique bimetallic nickel-chromium and nickel-molybdenum catalysts for hydrogenation in the liquid phase. Appl. Catal. 1989, 53, 217–231. 10.1016/S0166-9834(00)80022-6. [DOI] [Google Scholar]
- Koscielski T.; Bonnier J.; Damon J.; Masson J. Catalytic hydrogenation on raney nickel catalyst modified by chromium hydroxide deposition. Appl. Catal. 1989, 49, 91–99. 10.1016/S0166-9834(00)81425-6. [DOI] [Google Scholar]
- Bonnier J.; Damon J.; Masson J. New approach to skeletal nickel catalysts catalytic properties of the nickel-chromium system. Appl. Catal. 1988, 42, 285–297. 10.1016/0166-9834(88)80008-3. [DOI] [Google Scholar]
- Bertero N. M.; Apesteguia C. R.; Marchi A. J. Catalytic and kinetic study of the liquid-phase hydrogenation of acetophenone over Cu/SiO2 catalyst. Appl. Catal., A 2008, 349, 100–109. 10.1016/j.apcata.2008.07.014. [DOI] [Google Scholar]
- Rajashekharam M.; Chaudhari R. Improved stability of a bimetallic Ni-Pt catalyst for hydrogenation of acetophenone and substituted derivatives. Catal. Lett. 1996, 41, 171–176. 10.1007/BF00811486. [DOI] [Google Scholar]
- Ekeoma B. C.; Yusuf M.; Johari K.; Abdullah B. Mesoporous silica supported Ni-based catalysts for methane dry reforming: A review of recent studies. Int. J. Hydrogen Energy 2022, 47, 41596–41620. 10.1016/j.ijhydene.2022.05.297. [DOI] [Google Scholar]
- Meloni E.; Martino M.; Palma V. A Short Review on Ni Based Catalysts and Related Engineering Issues for Methane Steam Reforming. Catalysts 2020, 10, 352. 10.3390/catal10030352. [DOI] [Google Scholar]
- Abdullah B.; Abd Ghani N. A.; Vo D.-V. N. Recent advances in dry reforming of methane over Ni-based catalysts. Journal of Cleaner Production 2017, 162, 170–185. 10.1016/j.jclepro.2017.05.176. [DOI] [Google Scholar]
- Chan F. L.; Tanksale A. Review of recent developments in Ni-based catalysts for biomass gasification. Renewable and Sustainable Energy Reviews 2014, 38, 428–438. 10.1016/j.rser.2014.06.011. [DOI] [Google Scholar]
- Feng K.; Tian J.; Guo M.; Wang Y.; Wang S.; Wu Z.; Zhang J.; He L.; Yan B. Experimentally unveiling the origin of tunable selectivity for CO2 hydrogenation over Ni-based catalysts. Applied Catalysis B: Environmental 2021, 292, 120191. 10.1016/j.apcatb.2021.120191. [DOI] [Google Scholar]
- Li S.; Gong J. Strategies for improving the performance and stability of Ni-based catalysts for reforming reactions. Chem. Soc. Rev. 2014, 43, 7245–7256. 10.1039/C4CS00223G. [DOI] [PubMed] [Google Scholar]
- Mojica-Sepulveda R. D.; Mendoza-Herrera L. J.; Grumel E.; Soria D. B.; Cabello C. I.; Trivi M. Dynamic laser speckle technique as an alternative tool to determine hygroscopic capacity and specific surface area of microporous zeolites. Appl. Surf. Sci. 2018, 447, 587–593. 10.1016/j.apsusc.2018.03.231. [DOI] [Google Scholar]
- Mojica-Sepulveda R.; Mendoza-Herrera L.; Agosto M.; Grumel E.; Soria D.; Cabello C.; Trivi M. Hydro-adsorption study by dynamic laser speckle of natural zeolite for adsorbent and fertilizer applications. Adv. Chem. Eng. Sci. 2016, 6, 570–583. 10.4236/aces.2016.65049. [DOI] [Google Scholar]
- Reiche M.; Maciejewski M.; Baiker A. Characterization by temperatura programmed reduction. Catal. Today 2000, 56, 347–355. 10.1016/S0920-5861(99)00294-1. [DOI] [Google Scholar]
- Moulijn J. A.; van Leeuwen P. W. N. M.; van Santen R. A.. Temperature programmed reduction and sulphiding. In Catalysis: An Integrated Approach to Homogeneous, Heterogeneous and Industrial Catalysis; Studies in Surface Science and Catalysis; Elsevier, 1993; Vol. 79, pp 401–417. 10.1016/S0167-2991(08)63815-X [DOI] [Google Scholar]
- Hurst N. W.; Gentry S. J.; Jones A.; McNicol B. D. Temperature programmed reduction. Catal. Rev. - Sci. Eng. 1982, 24, 233–309. 10.1080/03602458208079654. [DOI] [Google Scholar]
- Kruk M.; Jaroniec M. Accurate Method for Calculating Mesopore Size Distributions from Argon Adsorption Data at 87 K Developed Using Model MCM-41 Materials. Chem. Mater. 2000, 12, 222–230. 10.1021/cm9905601. [DOI] [Google Scholar]
- Karge H. Characterization by infrared spectroscopy. Micro. Meso. Mater. 1998, 22, 547–549. 10.1016/S1387-1811(98)80021-8. [DOI] [Google Scholar]
- Muñoz M.; Mendoza-Herrera L. J.; Romanelli G. P.; Gazzoli D.; Cabello C. I. Catalytic behavior of the WOx-ZrO2 system in the clean selective oxidation of diphenyl sulfide (DPS). Catal. Today 2021, 372, 146–153. 10.1016/j.cattod.2020.10.011. [DOI] [Google Scholar]
- Diez A. S.; Graziano-Mayer M.; Radivoy G.; Volpe M. A. Suzuki–Miyaura cross-coupling of aryl iodides and phenylboronic acid over palladium-free CeO2 catalysts. Appl. Catal., A 2014, 482, 24–30. 10.1016/j.apcata.2014.05.020. [DOI] [Google Scholar]
- Costa D. C.; Soldati A. L.; Bengoa J. F.; Marchetti S. G.; Vetere V. Phosphorus as a promoter of a nickel catalyst to obtain 1-phenylethanol from chemoselective hydrogenation of acetophenone. Heliyon 2019, 5, e01859 10.1016/j.heliyon.2019.e01859. [DOI] [PMC free article] [PubMed] [Google Scholar]
- Rudolf C.; Dragoi B.; Ungureanu A.; Chirieac A.; Royer S.; Nastro A.; Dumitriu E. NiAl and CoAl materials derived from takovite-like LDHs and related structures as efficient chemoselective hydrogenation catalysts. Catal. Sci. Technol. 2014, 4, 179–189. 10.1039/C3CY00611E. [DOI] [Google Scholar]
- Ide M.; Hao B.; Neurock M.; Davis R. Mechanistic insights on the hydrogenation of α, β-unsaturated ketones and aldehydes to unsaturated alcohols over metal catalysts. ACS Catal. 2012, 2, 671–683. 10.1021/cs200567z. [DOI] [Google Scholar]
- Serrano E. R.; Merlo A. B.; Bengoa J. F.; Marchetti S. G.; Vetere V.. Obtención de alcohol furfurílico por hidrogenación en fase líquida de furfural utilizando catalizadores NiFe. XXIV Congreso Iberoamericano de Catálisis; Galoá, 2014; p 124.
- Bekkum H. V.; Flanigen E.; Jacobs P.; Jensen J.. Introduction to Zeolite Science and Practice, 1st ed.; Studies in Surface Science and Catalysis; Elsevier, 2001; Vol. 137. [Google Scholar]
- Sato M.; Morikawa K.; Kurosawa S. X-ray Rietveld analysis of cation exchanged zeolite-L(LTL). European Journal of Mineralogy 1990, 2, 851–860. 10.1127/ejm/2/6/0851. [DOI] [Google Scholar]
- Sakizci M.; Erdogan Alver B.; Yorukogullari E. Thermal and SO2 adsorption properties of some clays from turkey. J. Therm. Anal. Calorim. 2011, 103, 435–441. 10.1007/s10973-010-0928-0. [DOI] [Google Scholar]
- Sakizci M.; Alver B.; Yorukogullari E. Investigation of clinoptilolite rich natural zeolites from turkey: a combined XRF, TG/DTG, DTA and DSC study. J. Therm. Anal. Calorim. 2010, 100, 19–26. 10.1007/s10973-009-0118-0. [DOI] [Google Scholar]
- Villarroel-Rocha J.; Barrera D.; Sapag K. Introducing a self-consistent test and the corresponding modification in the Barrett, Joyner and Halenda method for pore-size determination. Micro. Meso. Mater. 2014, 200, 68–78. 10.1016/j.micromeso.2014.08.017. [DOI] [Google Scholar]
- Le Van Mao R.; Nguyen T.M.; Yao J. Conversion of ethanol in aqueous solution over zsm-5 zeolites: Influence of reaction parameters and catalyst acidic properties as studied by ammonia tpd technique. Appl. Catal. 1990, 61, 161–173. 10.1016/S0166-9834(00)82141-7. [DOI] [Google Scholar]
- Mahoney F.; Rudham R.; Summers J. V. Hydrogen oxidation catalysed by X zeolite containing transition metal ions. J. Chem. Soc., Faraday I 1979, 75, 314–322. 10.1039/f19797500314. [DOI] [Google Scholar]
- Rabo J. A.; Bezman R. D.; Poutsma M. L. Zeolites in industrial catalysis. Acta Phys. Chem. 1978, 24, 39–52. [Google Scholar]
- Uytterhoeven J. B. Metallic clusters in zeolites. Acta. Phys. Chem. 1978, 24, 53–69. [Google Scholar]
- Beyer H.; Jacobs P. A.; Uytterhoeven J. B. Redox behaviour of transition metal ions in zeolites. Part 2. Kinetic study of the reduction and reoxidation of silver-Y zeolites. J. Chem. Soc., Faraday I 1976, 72, 674–685. 10.1039/f19767200674. [DOI] [Google Scholar]
- Jones A.; McNicol B. D.. Temperature Programmed Reduction for Solid Materials Characterization, 1st ed.; CRC Press: Boca Raton, FL, 1986. [Google Scholar]