

Abstract

Metal-free porous activated carbon is an effective alternative to capture CO2 due to its high surface area and textural advantages. In this regard, the present research work explores a suitable method for producing activated porous carbon with a high specific surface area through a two-step reaction involving rice husk and KOH at 600 °C for 1 h to capture CO2. By varying the ratio of rice husk biomass to KOH, the texture and specific surface area of the activated porous carbon has been altered. A high surface area of ∼755 m2/g and a micropore volume of 0.243 cm3/g have been observed in the porous carbon produced with a KOH/biomass weight ratio of 3 (PAC2). Nitrogen contents in PAC1 and PAC2 were approximately 2.27 and 2.71 atom %, respectively. When compared with other materials, PAC2 has the highest CO2 adsorption capability, reaching up to 3.13 mmol/g at 0 °C and 1.55 mmol/g at 50 °C. The isosteric heat of adsorption confirms the presence of both physisorption and chemisorption. The materials turn out to be highly CO2/N2 selective, with the highest selectivity of 131, proving that the samples are potential materials for capturing CO2 from flue gases. These findings unequivocally show that porous activated carbon can be used to make CO2 adsorption efficient, inexpensive, and, more importantly, extremely effective.
Introduction
The anthropogenic CO2 concentration has increased rapidly since the industrial era started, and it is now exceeding 410 ppm, which is more than 50% higher than preindustrial levels.1 According to IPCC, the global mean temperature has already increased 0.8–1 °C, and it needs to be controlled before the temperature increases to 2 °C by 2100. The carbon dioxide-capturing process is an important technology for the world to become net-zero, where most of its energy comes from fossil fuels.2−4 Amine scrubbing is the most cutting-edge technology for CO2 capture from flue gas. However, this technology suffers from significant drawbacks, including a high energy requirement, equipment corrosion difficulties, solvent degradation, and possibly hazardous waste generation.5 However, CO2 capture by adsorption is effective, having low-cost materials, low heat capacity, fast kinetics, high CO2 adsorption capacity, high CO2 selectivity, and very high thermal, mechanical, and chemical stabilities.6 Various novel solid sorbents such as zeolites,7 silica,8 porous polymers,9 carbon,10 metal–organic frameworks (MOFs),11 and ionic liquids12 are reported for carbon capture. In contrast to the traditional materials used for CO2 capture and utilization, MOFs11 and covalent organic frameworks (COFs)13,14 represent a novel class of hybrid porous solid sorbents with promising technological advancement. These were naturally explored for gas adsorption because they had especially high porosities and high surface areas.15 With regard to post-combustion CO2 capture, MOFs with metal-binding sites displayed higher CO2 affinities, ensuring adequate adsorption capacity. However, these sites also had the drawback of the stability of the MOFs. The majority of the studied COFs are fairly typical physical adsorbents. As COFs have a low adsorption capacity compared with other materials, especially under post-combustion CO2 capture conditions, they are typically used in high-pressure environments.
In this regard, porous activated carbon materials exhibit significant potential because they are easily synthesized, are inexpensive, have adaptable pore architectures, possess high chemical and thermal stability, etc.16 Agricultural residues and food waste such as almond shells,17 coconut shells,18 mushroom,19 rice husk (RH),20 etc., have been widely studied in the preparation of porous activated carbon after feedstocks go through one-step or two-step carbonization and activation processes. The properties of these porous activated carbons can be altered by altering the activator/carbon source ratio,21 activation temperature,22 and activating agents such as K2CO3, KOH H3PO4, ZnCl2, etc.23−27
Recently, extensive research interest has been focused on studies on the production of activated porous carbon from waste or biomass and their application for CO2 adsorption. Rattanaphan et al.28 synthesized activated carbon from used tea leaves using NaOH as an activator and modified it with ethylenediamine to serve as a CO2 sorbent. At 30 °C and 1 bar pressure, they claimed that the CO2 adsorption was equivalent to 2.5 mmol/g. Nitrogen-doped activated carbons were prepared by Yue et al.29 using urea-modified coconut shell and K2CO3 as the activating agent. The activated carbon material shows CO2 uptakes of up to 3.71 mmol/g at 25 °C and 5.12 mmol/g at 0 °C at 1 bar. Activated carbon was also prepared by Choi et al.30 utilizing pollens and KOH as the activating agent for CO2 adsorption. A KOH/carbonized pollen ratio of 3:1 at 800 °C produced the highest activated carbon material with a surface area of 1460 m2/g. This material has a high CO2/N2 selectivity (15–12 in the 0–1 bar range) and the highest CO2 sorption values of 5.63 and 3.42 mmol/g at 0 and 25 °C, respectively. Hong et al.31 synthesized activated carbon utilizing packing peanuts by physical and chemical activation. It is found that chemical activation can provide a greater microporous carbon structure compared with physical activation.31 At a KOH/carbon ratio of 5, the highest Brunauer–Emmett–Teller (BET) surface area of 2420 m2/g has been reported. They claimed that as the KOH/carbon mass ratio increases, both the specific surface area and the total pore volume increase. However, the maximum CO2 adsorption abilities of 6.51 and 4.07 mmol/g at 0 and 25 °C, respectively, were obtained using peanut-derived activated carbon with a KOH/carbon ratio of 3 rather than 5. Recently, KOH-impregnated rice-husk-derived activated carbon was used by Wang et al. to create a high-performance adsorbent for indoor CO2 adsorption.20 DKOH-AC revealed a high adsorption capacity of 2.1 mmol/g at a low amount of indoor CO2 (2000–500 ppm). The outcomes demonstrated that despite sacrificing the BET surface area, KOH impregnation greatly increased the CO2 adsorption capability (via chemisorption). Among the aforementioned carbon materials, those with microporous structures are useful for CO2 capture due to their remarkable properties, which have led to high CO2 capture efficiency and selectivity. To the best of our knowledge, there are very few reports on the effect of the concentration of activation agents on the porous texture, surface properties, and CO2 adsorption performance of sorbents. However, the inability to regulate the growth and formation of the pore structure is still a significant challenge in the preparation of activated carbon adsorbents derived from waste biomass. The novelty of this study is the utilization of waste biomass to prepare an effective carbon-based adsorbent with efficient CO2 capture properties with great selectivity, and the role of the activating agent concentration to prepare effective porous activated carbon has been discussed in detail.
In the present work, we examined the effect of activation agent/biomass precursor ratios on the porous texture, surface properties, CO2 adsorption capacity, and CO2/N2 selectivity performance of the sorbent in detail with various model fits. Here, rice husk has been used as feedstock, and a two-step method was followed to prepare porous activated carbon while varying the KOH/biochar mass ratios. The maximum BET surface area of 755 m2/g and micropore volume of 0.243 cm3/g were obtained at a KOH/carbon ratio of 3 (porous activated carbon 2; PAC2). Various physicochemical properties of the synthesized material have been characterized by X-ray diffraction (XRD), field-emission scanning electron microscopy (FESEM), thermogravimetric analysis (TGA), BET, CHNS, X-ray photoelectron spectroscopy (XPS), and CO2 adsorption studies. By modifying the preparation conditions and performing surface modifications, CO2 adsorption capacities of 2.89 and 3.13 mmol/g, at 1 bar, 0 °C for PAC1 (porous activated carbon 1) and PAC2, respectively, were found. PAC1 shows a very high CO2/N2 selectivity of 131 at 0.1 bar and ∼ 37 at 1 bar (calculated viz. IAST method).
Experimental Section
Materials
Rice husk was collected from West Bengal, potassium hydroxide (KOH) was from Merck, and concentrated hydrochloric acid (98% HCl) was obtained from (Merck). All of the compounds were used as received without additional purification.
Synthesis of Rice Husk Biochar (RHBC) and Porous Activated Carbon
The rice husk sample was washed with distilled water and placed in an oven at 70 °C overnight to remove moisture. Then, the dried rice husk was pyrolyzed at 600 °C in a vertical vacuum pyrolyzer for 2 h to obtain rice husk biochar. The heating rate was fixed at 5 °C/min. The rice husk biochar was further used to synthesize activated carbon. The biochar was activated by KOH in two different weight ratios, i.e., 1:1 and 1:3 (biochar/KOH), respectively. Then, the mixture was heated at 400 °C for 30 min, after which the temperature was increased to 600 °C and maintained for 1 h. After cooling, the sample was collected and neutralized with 0.5M HCl and finally washed with distilled water. The obtained product was dried in an oven. The final products activated by the mixed activators were named porous activated carbon 1 (PAC1; biochar/KOH weight ratio 1:1) and porous activated carbon 2 (PAC2; biochar/KOH weight ratio 1:3).
Characterization of Adsorbents
Proximate and ultimate analyses of raw rice husk and the biochar were performed to determine the basic contents and elemental compositions of the materials. The elemental composition of the materials was determined by a CHNS analyzer using an Elementar instrument. The proximate characterization was conducted as per the standard ASTM standards (D-3173, D-3174, and D-3175) to determine the moisture, volatile matter, and ash content of both biomass and biochar samples.32 For moisture determination, samples were oven-dried at 105 °C for 2 h. The samples were heated at 950 °C for 7 min in a muffle furnace for volatile matter determination. For ash content determination, the samples were heated at 750 °C for 30 min. Fixed carbon was determined by subtracting the sum of moisture, volatile matter, and ash from 100. The powder X-ray diffraction (PXRD) study was conducted using a Bruker D8 Advance instrument in the scanning range of 20–80°. The X-ray diffractometer had a Cu cathode for the generation of X-ray of wavelength 1.54 Å. Thermal parameters of the materials were evaluated by thermogravimetric analysis using a Perkin-Elmer STA6000 thermogravimeter. It was performed in the temperature range of 30–900 °C with a heating rate of 20 °C/min under non-isothermal conditions (N2 atmosphere with a flow of 50 mL/min). The morphological analysis of the samples was carried out by field-emission scanning electron microscopy (FESEM) (model JEOL JSM-7610F). The elemental and chemical compositions of the sample were determined using a Thermo Scientific K-Alpha X-ray photoelectron spectrometer (XPS) equipped with an Al Kα X-ray source. Surface area and other parameters were determined by N2 adsorption–desorption isotherms at 77 K using a 3FLEX 3500 from Micromeritics Instrument Corporation. Before the measurements, all samples were degassed at a temperature of 200 °C for 24 h. Using the Brunauer–Emmett–Teller (BET) equation, the specific surface area (SBET) values of the samples were calculated, the total pore volume was computed at a relative pressure of P/P0 = 0.99, the micropore volume was determined by the t-plot method, and the average pore width was determined as 4Vt/SBET. The pore size distribution (PSD) was estimated by the nonlocal density functional theory (NLDFT) assuming a slit-pore model.
CO2 Adsorption Experiments and Model Fit
The CO2 adsorption study was also conducted using a 3FLEX 3500 from Micromeritics Instrument Corporation. All of the samples were tested at three different temperatures 0, 25, and 50 °C. The adsorption plots were fitted to different adsorption isotherms, i.e., the Langmuir, Freundlich, and Toth isotherms. The Langmuir model predicts that adsorption occurs only in a monolayer formation on the adsorbate; it is a theoretical expression. The empirical Freundlich model predicts multilayer adsorption on a heterogeneous adsorbent, whereas the Toth model is a three-parameter model extended from the Langmuir equation taking the heterogeneity of adsorbent surfaces into account.33 The Langmuir, Freundlich, and Toth models are given below in eqs 1–3, respectively:33,34
| 1 |
where qe (mmol/g) is the adsorption capacity at equilibrium, q0 (mmol/g) is the saturated amount of the gas adsorbed, and b is given by b = b0 eQ/RT, where b0 is the adsorption affinity, Q is the isosteric heat of adsorption, R = 8.314 J mol–1 K–1, and P (kPa) is pressure.
| 2 |
Here, kF is the Freundlich constant and nF is the adsorption intensity.
| 3 |
Here, kT′ is the surface heterogeneity parameter. This equation reduces to the Langmuir model when kT′ becomes 1.
The isosteric heat of adsorption was calculated by the Clausius–Clapeyron equation.35 It is used to measure the enthalpy change when adsorbate molecules are adsorbed from the bulk phase to the adsorbed phase. The calculation was performed for all samples based on their adsorption isotherms at three different temperatures: 0, 25, and 50 °C.
The equation is given as follows:
| 4 |
where ΔHS (kJ/mol) is the isosteric heat of adsorption, R = 8.314 J mol–1 K–1, and pressure and temperature are denoted, respectively, as P (kPa) and T (K).
Adsorbent selectivity is a very important parameter as it shows the capability to adsorb at different temperatures and pressures. Moreover, in the case of mixed component adsorption, it is necessary to determine the selectivity of one adsorbent over another toward a component. To determine the selectivity of the adsorbent in a mixed component adsorbate, the ideal adsorption solution theory (IAST) was proposed.36,37 In this method, the adsorption of a binary mixture can be predicted from pure component adsorption isotherms. First, the pure component data are fitted to the Toth isotherm model (it showed the highest R2 value), and then calculations are based on the selectivity equation:
| 5 |
where x is the molar fraction of components in the adsorbed phase and y is the same in the bulk phase (in different sites).
Results and Discussion
The FESEM morphologies of rice husk biochar (RHBC) and KOH-impregnated porous activated carbon (PAC1 and PAC2) are shown in Figure 1a–c. From the morphological analysis, it is found that no pores are present in the biochar; however, KOH activation produces a highly developed porous structure with micron-sized pores observed on the surface of porous activated carbons (i.e., PAC1 and PAC2, respectively). It has also been noticed that pores increase drastically with an increase in the KOH impregnation ratio. Moreover, after chemical activation, the smooth and regular surface of the RHBC was replaced by pores, and PAC2 showed a very uniform highly porous structure compared with PAC1. The surface after activation has larger pores of around 2–5 μm size, with micropores and mesopores concealed inside the surface. The surface area analysis of PAC2 shows ∼76.34% as the micropore area out of the total surface area. The main function of KOH is to assist in the oxidation of rice husk. In the activation process, it is thought that the reaction between KOH and carbon creates gases that encourage the creation of pores, particularly small mesopores and micropores. KOH also removes tar and aids in the removal of pollutants such as SiO2. Carbon is oxidized to produce carbon dioxide, hydrogen, metallic potassium, water, and potassium carbonate. In this regard, Singh et al.38 and Serafin et al.16 proposed a redox reaction mechanism between biomass carbon and KOH and described the effect of the activating agent on pore formation. The synthesis of activated carbon and the emergence of high porosity are the results of subsequent reactions and the evolution of volatiles from the biomass surface that took place during the carbonization process in conjunction with chemical activation. Typically, when KOH combines with biomass carbon, K2CO3, metallic potassium, evolved hydrogen, and carbon monoxide are produced. The reactions are as follows
| 6 |
| 7 |
or
| 8 |
| 9 |
The functional groups abundant in biomass are also degraded in the presence of KOH into volatiles such as water and carbon dioxide, which contribute to porosity as they are released through the structure of carbon.
| 10 |
| 11 |
| 12 |
In addition, the biomass carbon reacted with potassium carbonate or potassium oxides, which contributed to the development of pores. During washing with HCl and water, potassium compounds (i.e., K2O, K2CO3, and K) that are intercalated into the carbon structure are eliminated, as a result of which a high surface area and highly porous activated carbon were generated.
| 13 |
| 14 |
| 15 |
Proximate analysis of the material before pyrolysis and after forming the biochar shows 63.45 and 21.36% volatile matter in them, respectively, and the amount of fixed carbon content increased from 7.91 to 34.35% after pyrolysis (Table 1). The ultimate analyses suggest that the overall carbon percentage of the biochar increased from 25.6 to 70.87%. This proves that pyrolysis was able to remove all of the volatile matter inside the material and make the material more carbonaceous with potential for CO2 capture.39
Figure 1.

SEM images of (a) RHBC and (b, c) activated carbons PAC1 and PAC2, respectively, prepared with different KOH-to-biomass ratios at a temperature of 600 °C.
Table 1. Properties of the Rice Husk and Its Biochar.
| properties | rice husk | biochar (BC) |
|---|---|---|
| Proximate Analysis | ||
| moisture (%) | 10.53 | 4 |
| volatile matter (%) | 63.45 | 21.36 |
| ash content (%) | 18.11 | 40.39 |
| fixed carbon content (%) | 7.91 | 34.25 |
| Ultimate Analysis | ||
| carbon (%) | 25.6 | 70.87 |
| hydrogen (%) | 4.5 | 1.514 |
| nitrogen (%) | 0.5 | 1.48 |
| sulfur (%) | 0.4 | 0.1 |
| oxygen (%) | 69 | 26.036 |
X-ray diffraction patterns of rice husk, rice husk biochar, and porous activated carbon are shown in Figure 2. Three characteristic peaks are seen in the XRD patterns of rice husk at 2θ values of 16, 23, and 35°, which are reported to be peaks of cellulose, and the peaks observed between 10 and 35° are attributed to the diffraction of amorphous carbon.40 In the pyrolytic rice husk biochar, the broad peak found between 18 and 29° is attributed to the C (002) plane. There is another broad region with less intensity at 2θ between 42 and 47° attributable to the C(100) plane. Previous results suggest that these peaks reflect the condensed aromatic carbonized planes; the sharper the peak, the higher the degree of condensation of the aromatic ring.40−43 All of these characteristics were retained in the KOH-impregnated activated carbon; however, the C(002) and C(100) peaks are slightly more intense than those of biochar, which confirms that KOH activation has enhanced its degree of carbon ordering.
Figure 2.

XRD patterns of (a) rice husk and RHBC and (b) RHBC and activated carbons (i.e., PAC1 and PAC2) prepared with different KOH/biomass ratios at a temperature of 600 °C.
Thermogravimetric analysis (TGA) of the rice husk (RH) and rice husk biochar (RHBC) are shown in Figure 3a,b. The initial degradation at around 40–150 °C accounts for weight loss due to the moisture present in both samples. The RH sample showed two weight-loss stages at 200–450 °C, attributed to the decomposition of hemicellulose and cellulose, and at 450–750 °C, assigned to the gradual decomposition of lignin.6,44,45 Biomass having a high amount of hemicellulose and cellulose results in microporous carbons, needed for carbon dioxide adsorption, and rice husk is proved to have a high amount of hemicellulose and cellulose, as seen in the DTG curve. The gradual weight loss after that is due to the carbonization of biomass.46 The sample RHBC is clearly stable up to 600 °C, and the gradual decrease in weight afterward is believed to be due to carbonization.
Figure 3.

TGA–derivative thermogravimetry (DTG) analysis of (a) rice husk (RH) and (b) rice husk biochar (RHBC).
The N2 adsorption–desorption isotherms are used to determine the physical characteristics of all samples, including their specific surface area, micropore volume, total pore volume, and pore diameter. Figure 4a,b shows the N2 adsorption–desorption isotherms and textural properties of all carbonaceous materials that are summarized in Table 2. Rice husk biochar shows a very minute surface area and no micropore area, which is very clear through the isotherm (Figure 4a). However, the KOH-activated samples showed a significant increase in the surface area, and a significant effect of the KOH amount is also observed (see in Table 2). PAC2 exhibited the highest surface area of 756 m2/g, of which 630.20 m2/g constitutes the micropore area. This slightly less surface area may be due to the formation of solid K2CO3 (see equation nos 6–15).47 The adsorption isotherm curves for the activated biochars are type I according to the IUPAC classification. The hysteresis plots in Figure 4b are almost horizontal and parallel over a wide range; this depicts a H4-type hysteresis, suggesting that the sample contains slit-like pores.48 In both the activated samples, high adsorption is seen at a very low relative pressure, which indicates the presence of mainly the micropores.49,50
Figure 4.

N2 adsorption–desorption isotherms of (a) rice husk biochar (RHBC) and (b) activated carbons (i.e., PAC1 and PAC2) prepared with different KOH/biomass ratios at the temperature of 600 °C. (c) Pore size distribution of RHBC, PAC1, and PAC2.
Table 2. Textural Properties of BCRH and Its Activated Derivatives PAC1 and PAC2.
| samples | SBET(m2/g) | SBETmicro(m2/g) | SBETmicro/SBET (%) | Vt(cm3/g) | Vmi(cm3/g) | V<0.7 nm | V<0.7 nm/Vmi (%) | Vmi/Vt (%) |
|---|---|---|---|---|---|---|---|---|
| RHBC | 9.77 | 0.02 | ||||||
| PAC1 | 413.59 | 330.63 | 79.94 | 0.312 | 0.130 | 0.076 | 58.46 | 35.04 |
| PAC2 | 755.73 | 630.20 | 83.39 | 0.393 | 0.243 | 0.176 | 72.46 | 52.78 |
The BET surface area of the rice husk biochar is significantly low (9.77 m2/g) with no micropores and a pore volume of 0.02 cm3/g. The micropore area and volume were calculated through a t-plot analysis. PAC1 showed an SBET of 413 m2/g with a micropore area of 330 m2/g. With an increase in the char/KOH ratio to 1:3, the SBET increased to 755 m2/g, the total pore volume to 0.393 cm3/g, and the micropore volume to 0.243 cm3/g. The data confirm that SBET and Vmi increased due to KOH impregnation. Figure 4c shows the pore size distribution (PSD) curves of the porous activated carbon computed using the N2 adsorption data at 77 K. It was found that the number of pores increased considerably with an increase in the KOH impregnation ratio, which may due to the effect of KOH. KOH activation caused the development of micropores, resulting in an enhanced surface area and total pore volume as well as pore enlargement, particularly in the presence of a large amount of KOH.30 The distribution clearly suggests that the samples are mainly nano-microporous (0.3–0.6 nm) in nature, which helps in improving the CO2 adsorption capacity.51
The chemical compositions of the RHBC, PAC1, and PAC2 samples were studied by XPS. Figures 5 and 6 show the XPS spectra of C 1s, O 1s, and N 1s observed for the RHBC, PAC1, and PAC2 samples. The quantitative surface chemical composition is summarized in Table 3. PAC2 shows the highest nitrogen content (2.71 atom %), an N/C ratio of 0.056, and also the highest oxygen content of 49.08 atom %. PAC1 and PAC2 show relatively high nitrogen contents compared with that of RHBC. The high-resolution O 1s spectra of PAC1 and PAC2 are shown in Figure 6b,c. In the O 1s spectrum, two prominent peaks are observed in all samples, which are assigned to C=O groups (531.2 eV) and C–OH or C–O–C groups (532.8 eV).52,53 On the other hand, the high-resolution N 1s spectra, shown in Figure 5a–c, can be deconvoluted to contributions of pyridinic-N (398.6 eV), pyrrolic-N (400.4 eV), and oxidized pyridinic-N (402.3 eV) in the carbon structure.53 Because these are chemically more active than their counterparts inside the carbon network, the carbon atoms on the edges of the graphitic layers can be replaced with externally doped nitrogen atoms more easily, which leads to the generation of pyridinic-N and pyrrolic-N on the surface.52,53 The pyrrolic peak is more prominent than the pyridinic peak in the chemically activated samples (Figure 5b,c), and these groups are predicted to be more effective at attracting acidic CO2 molecules.53 The much higher amount of carbon burnoff in activated samples results in the collapse of the hexagonal ring into the pentagonal ring, which decreases the intensity of the pyridinic peak. The formation of pyrrole peaks is caused by the chemical reactions of KOH, which displaces more carbons from the surface of the condensed aromatic structure of the carbon network.
Figure 5.

N 1s XPS spectra of (a) RHBC, (b) PAC1, and (c) PAC2 samples.
Figure 6.

(a) Survey spectra of RHBC, PAC1, and PAC2 samples. O 1s XPS spectra of (b) PAC1 and (c) PAC2. (d–f) C 1s XPS of RHBC, PAC1, and PAC2, respectively.
Table 3. Quantitative Characterization of the Surface Compositions of RHBC, PAC1, and PAC2.
| surface
atomic concentration (%) | |||
|---|---|---|---|
| C 1s | O 1s | N 1s | |
| RHBC | 72.57 | 25.88 | 1.14 |
| PAC1 | 82.47 | 15.26 | 2.27 |
| PAC2 | 48.21 | 49.08 | 2.71 |
The CO2 adsorption at three distinct temperatures of 0, 25, and 50 °C was measured under pressure. A comparison of the CO2 adsorption capacities of different samples under various conditions is shown in Figure 7a–c and Table 4. PAC2 exhibited the highest adsorption of 3.13 mmol/g at 0 °C at 1 bar pressure. At low pressure (0.1 bar), the samples also showed promising results, probably due to the presence of narrower micropores (V<0.7 nm).54 PAC2 has the highest amount of narrower micropores compared with the other activated carbons (V<0.7 nm/Vmi is 72.46 > 58.46%), and this resulted in the CO2 uptake of PAC2 being slightly higher (1.50 mmol/g) than that of PAC1 (1.48 mmol/g) at 0 °C temperature and 0.1 bar pressure. At lower temperatures and higher pressure, all three samples show the highest CO2 adsorption capacity. Porous activated carbon was found to be a good CO2 uptake material at ambient temperature as well as at 50 °C. At ambient temperatures and pressure, the samples RHBC, PAC1, and PAC2 adsorb 1.06, 2.11, and 2.24 mmol/g, respectively. PAC1 and PAC2 showed very similar results at 50 °C and 1 bar (1.54 and 1.55 mmol/g, respectively). The data were further fitted to the Langmuir, Freundlich, and Toth isotherms (Figure 8a,b), and the Toth isotherm displayed the highest R2 of 0.999, suggesting heterogeneity of the adsorbent. A comparison of the CO2 uptake under different conditions has been plotted and shown in Figure 9.
Figure 7.

CO2 adsorption isotherms of the rice husk-derived carbons of (a) RHBC, (b) PAC1, and (c) PAC2.
Table 4. CO2 Adsorption Capacities of RHBC, PAC1, and PAC2.
| CO2 uptake (mmol/g) |
||||||
|---|---|---|---|---|---|---|
| 0 °C |
25 °C |
50 °C |
||||
| sample | 0.1 bar | 1 bar | 0.1 bar | 1 bar | 0.1 bar | 1 bar |
| RHBC | 0.63 | 1.39 | 0.35 | 1.06 | 0.22 | 0.74 |
| PAC1 | 1.48 | 2.89 | 0.86 | 2.11 | 0.53 | 1.54 |
| PAC2 | 1.50 | 3.13 | 0.88 | 2.24 | 0.57 | 1.55 |
Figure 8.

Langmuir, Freundlich, and Toth isotherm model fits of the rice husk-derived carbon of (a) PAC1 and (b) PAC2.
Figure 9.
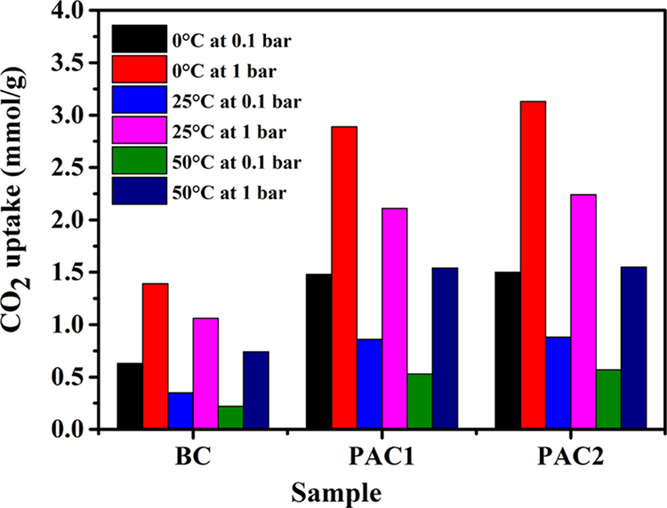
Comparison of CO2 uptake of the rice husk-derived carbons of RHBC, PAC1, and PAC2 under different conditions.
The isosteric heat of adsorption of the samples was computed using eq 4, and the relationship between that heat and the amount of CO2 loaded is depicted in Figure 10. With a continuously increasing CO2 load, the heat of adsorption tends to decrease for all samples. This might be due to high-energy active adsorption sites getting bound to CO2 molecules, which gradually decreases the heat of adsorption with the consumption of high-energy active sites.55 The average isosteric heat of adsorption for the materials are 24.94, 26.66, and 25.26 kJ/mol for RHBC, PAC1, and PAC2, respectively. The higher the heat of adsorption, the stronger the CO2 adsorption properties. Generally, an isosteric heat of adsorption of 0–20 kJ/mol confirms physisorption, and a value greater than 20 kJ/mol throughout the process implies that the adsorption mechanism may include both physisorption and chemisorption.54,56 In the present study, the average isosteric heat of adsorption for the samples are 24.94 kJ/mol for RHBC, 26.66 kJ/mol for PAC1, and 25.26 kJ/mol for PAC2. These results support the fact that KOH-activated porous carbon shows both physical and chemical adsorption of CO2.
Figure 10.

Isosteric heat of adsorption of the rice husk-derived carbons of RHBC, PAC1, and PAC2.
Under real-life conditions, the adsorbate might not be present as a single component, rather it will be present in a mixed gas; as obtaining the adsorption quantity of a single component from the mixed adsorbate can be difficult, the IAST theory is used to calculate the selectivity of the adsorbent in a CO2/N2 mixture (15:85 as per flue gas compositions). To calculate the selectivity, the data were first fitted to the Toth isotherm as it showed the highest R2 value of 0.999, and the data were substituted in the selectivity eq 5. Here, we selected the best set of data according to the CO2 adsorption performance, which is PAC1 and PAC2 at 0 °C, and compared the data with the N2 adsorption data for the same samples at the same temperature. N2 adsorption was very lower compared with CO2 adsorption. Both samples showed very high selectivity at lower as well as ambient pressures at 0 °C. Manoranjan et al.45 and Wilmer et al.57 reported that the heat of adsorption plays a crucial role in determining the selectivity of an adsorbent, and a heat of adsorption in the range of 18–27 kJ/mol is ideal for CO2 sorbents. In our study, the average isosteric heat of adsorption for the materials are 24.94, 26.66, and 25.26 kJ/mol for RHBC, PAC1, and PAC2, respectively. Figure 11 shows the selectivity factors for the activated carbons. PAC1 showed the highest selectivity at 0.1 bar (131 compared with 98 for PAC2) as well as at 1 bar (36.67 compared with 30 for PAC2). Such a high selectivity indicates the good CO2-capturing ability of the KOH-activated carbons from a flue gas stream.
Figure 11.

(a) Toth fit and (b) IAST selectivity of rice husk-derived carbons of PAC1 and PAC2.
Conclusions
In summary, two distinct impregnation ratios were used in a two-step procedure to create activated carbons from the chemical activation of rice husk. The optimum conditions for preparing the activated carbons were carbonization at 600 °C and then KOH activation at a KOH/char ratio of 3:1. The BET surface area obtained under this condition is 755 m2/g with a micropore volume of 0.243 cm3/g. XRD of the sample confirmed the amorphous nature of the sample, and FESEM confirmed that the KOH impregnation had a very positive impact on the samples; with an increase in the impregnation ratio, the pore volume, especially micropore volume, increased. The pore size distribution of the samples showed the presence of narrower micropores in the activated samples, which proved to be the best for CO2 adsorption. The results are confirmed in the CO2 adsorption study as PAC2 showed the highest CO2 adsorption capacity of 3.13 mmol/g at 0 °C compared with 2.89 mmol/g for PAC1 and 1.39 mmol/g for RHBC. The data showed comparable results at ambient temperature and at an elevated temperature of 50 °C. The high CO2 adsorption capacities of PAC1 and PAC2 are attributed to the presence of the highly microporous surface area and high nitrogen content in the form of pyridinic-N and pyrrolic-N species in the framework of the porous structure. The Toth model fitted the data very well because of the heterogeneity of the material. The isosteric heat of adsorption is more for PAC1, and the values prove the occurrence of both physisorption and chemisorption in the adsorption process. The activated carbon material shows a CO2/N2 selectivity of 131.39 at 0.1 bar and 36.67 at 1 bar (for PAC1), which indicates the material’s potential to be used for CO2 capture from a flue gas mixture. This research work is very significant from the perspective of our future efforts to produce effective and affordable activated carbons from biomass. The methodology described here combines carbonization with chemical activation and is a simple process using inexpensive and easily available carbon sources that could be promising alternatives for CO2 capture.
Acknowledgments
R.N. and D.S. thank NITJ and SSS-NIBE for providing research facilities. S.K.G. thanks the SSS-NIBE and Ministry of New and Renewable Energy (MNRE), Govt. of India, for providing fellowship. M.K.J., S.Y. thanks NITJ for providing research facilities
Author Contributions
R.N.: conceptualization, methodology, experiments, writing—original draft preparation; M.K.J.: supervision; Sujit Kumar Guchhait: methodology, writing—original draft preparation, conceptualization, preparation of the graphical abstract; D.S.: original draft preparation, preparation of activated carbon from biomass; S.Y.: supervision, conceptualization, original draft preparation.
The authors declare no competing financial interest.
This paper published ASAP on January 13, 2023 with an error in the title. The title was corrected and the corrected paper reposted on January 17, 2023.
References
- Trends in Atmospheric Carbon Dioxide, Earth System Research Laboratory, National Oceanic & Atmospheric Administration. Https://Www.Noaa.Gov/News-Release/Carbon-Dioxide-Now-More-than-50-Higher-than-Pre-Industrial-Levels (accessed Sept 26, 2022).
- Yuan X.; Kumar N. M.; Brigljević B.; Li S.; Deng S.; Byun M.; Lee B.; Lin C. S. K.; Tsang D. C. W.; Lee K. B.; Chopra S. S.; Lim H.; Ok Y. S. Sustainability-Inspired Upcycling of Waste Polyethylene Terephthalate Plastic into Porous Carbon for CO2capture. Green Chem. 2022, 24, 1494–1504. 10.1039/d1gc03600a. [DOI] [Google Scholar]
- Thengane S. K.; Bandyopadhyay S. Biochar Mines: Panacea to Climate Change and Energy Crisis?. Clean Technol. Environ. Policy 2020, 22, 5–10. 10.1007/s10098-019-01790-1. [DOI] [Google Scholar]
- Gupta A.; Paul A. Carbon Capture and Sequestration Potential in India: A Comprehensive Review. Energy Procedia 2019, 160, 848–855. 10.1016/j.egypro.2019.02.148. [DOI] [Google Scholar]
- Yu C. H.; Huang C. H.; Tan C. S. A Review of CO2 Capture by Absorption and Adsorption. Aerosol Air Qual. Res. 2012, 12, 745–769. 10.4209/aaqr.2012.05.0132. [DOI] [Google Scholar]
- González A.; Plaza M. G.; Rubiera F.; Pevida C. Sustainable Biomass-Based Carbon Adsorbents for Post-Combustion CO2 Capture. Chem. Eng. J. 2013, 230, 456–465. 10.1016/j.cej.2013.06.118. [DOI] [Google Scholar]
- Siriwardane R. V.; Shen M.-S.; Fisher E. P.; Poston J. A. Adsorption of CO2 on Molecular Sieves and Activated Carbon. Energy Fuels 2001, 15, 279–284. 10.1021/ef000241s. [DOI] [Google Scholar]
- Huang S.-J.; Hung C.-T.; Zheng A.; Lin J.-S.; Yang C.-F.; Chang Y.-C.; Deng F.; Liu S.-B. Capturing the Local Adsorption Structures of Carbon Dioxide in Polyamine-Impregnated Mesoporous Silica Adsorbents. J. Phys. Chem. Lett. 2014, 5, 3183–3187. 10.1021/jz501616c. [DOI] [PubMed] [Google Scholar]
- Ben T.; Pei C.; Zhang D.; Xu J.; Deng F.; Jing X.; Qiu S. Gas Storage in Porous Aromatic Frameworks (PAFs). Energy Environ. Sci. 2011, 4, 3991. 10.1039/c1ee01222c. [DOI] [Google Scholar]
- Sevilla M.; Fuertes A. B. Sustainable Porous Carbons with a Superior Performance for CO2 Capture. Energy Environ. Sci. 2011, 4, 1765. 10.1039/c0ee00784f. [DOI] [Google Scholar]
- Millward A. R.; Yaghi O. M. Metal–Organic Frameworks with Exceptionally High Capacity for Storage of Carbon Dioxide at Room Temperature. J. Am. Chem. Soc. 2005, 127, 17998–17999. 10.1021/ja0570032. [DOI] [PubMed] [Google Scholar]
- Wang C.; Luo H.; Jiang D.; Li H.; Dai S. Carbon Dioxide Capture by Superbase-Derived Protic Ionic Liquids. Angew. Chem. 2010, 122, 6114–6117. 10.1002/ange.201002641. [DOI] [PubMed] [Google Scholar]
- Zhu Y.; Zhu D.; Yan Q.; Gao G.; Xu J.; Liu Y.; Alahakoon S. B.; Rahman M. M.; Ajayan P. M.; Egap E.; Verduzco R. Metal Oxide Catalysts for the Synthesis of Covalent Organic Frameworks and One-Step Preparation of Covalent Organic Framework-Based Composites. Chem. Mater. 2021, 33, 6158–6165. 10.1021/acs.chemmater.1c01747. [DOI] [Google Scholar]
- Dey K.; Pal M.; Rout K. C.; Kunjattu H S.; Das A.; Mukherjee R.; Kharul U. K.; Banerjee R. Selective Molecular Separation by Interfacially Crystallized Covalent Organic Framework Thin Films. J. Am. Chem. Soc. 2017, 139, 13083–13091. 10.1021/jacs.7b06640. [DOI] [PubMed] [Google Scholar]
- Modak A.; Jana S. Advancement in Porous Adsorbents for Post-Combustion CO2 Capture. Microporous Mesoporous Mater. 2019, 276, 107–132. 10.1016/j.micromeso.2018.09.018. [DOI] [Google Scholar]
- Serafin J.; Baca M.; Biegun M.; Mijowska E.; Kaleńczuk R. J.; Sreńscek-Nazzal J.; Michalkiewicz B. Direct Conversion of Biomass to Nanoporous Activated Biocarbons for High CO2 Adsorption and Supercapacitor Applications. Appl. Surf. Sci. 2019, 497, 143722 10.1016/j.apsusc.2019.143722. [DOI] [Google Scholar]
- Plaza M. G.; Pevida C.; Martín C. F.; Fermoso J.; Pis J. J.; Rubiera F. Developing Almond Shell-Derived Activated Carbons as CO2 Adsorbents. Sep. Purif. Technol. 2010, 71, 102–106. 10.1016/j.seppur.2009.11.008. [DOI] [Google Scholar]
- Chen J.; Yang J.; Hu G.; Hu X.; Li Z.; Shen S.; Radosz M.; Fan M. Enhanced CO2 Capture Capacity of Nitrogen-Doped Biomass-Derived Porous Carbons. ACS Sustainable Chem. Eng. 2016, 4, 1439–1445. 10.1021/acssuschemeng.5b01425. [DOI] [Google Scholar]
- Sun Z.; Srinivasakannan C.; Liang J.; Duan X. Preparation and Characterization of Shiitake Mushroom-Based Activated Carbon with High Adsorption Capacity. Arab. J. Sci. Eng. 2019, 44, 5443–5456. 10.1007/s13369-019-03746-5. [DOI] [Google Scholar]
- Wang S.; Lee Y. R.; Won Y.; Kim H.; Jeong S. E.; Wook Hwang B.; Ra Cho A.; Kim J. Y.; Cheol Park Y.; Nam H.; Lee D. H.; Kim H.; Jo S. H. Development of High-Performance Adsorbent Using KOH-Impregnated Rice Husk-Based Activated Carbon for Indoor CO2 Adsorption. Chem. Eng. J. 2022, 437, 135378 10.1016/j.cej.2022.135378. [DOI] [Google Scholar]
- Li D.; Ma T.; Zhang R.; Tian Y.; Qiao Y. Preparation of Porous Carbons with High Low-Pressure CO2uptake by KOH Activation of Rice Husk Char. Fuel 2015, 139, 68–70. 10.1016/j.fuel.2014.08.027. [DOI] [Google Scholar]
- Lubkowski K.; Arabczyk W.; Grzmil B.; Michalkiewicz B.; Pattek-Janczyk A. Passivation and Oxidation of an Ammonia Iron Catalyst. Appl. Catal., A 2007, 329, 137–147. 10.1016/j.apcata.2007.07.006. [DOI] [Google Scholar]
- Fujiki J.; Yogo K. The Increased CO 2 Adsorption Performance of Chitosan-Derived Activated Carbons with Nitrogen-Doping. Chem. Commun. 2016, 52, 186–189. 10.1039/C5CC06934C. [DOI] [PubMed] [Google Scholar]
- Kwiatkowski M.; Fierro V.; Celzard A. Numerical Studies of the Effects of Process Conditions on the Development of the Porous Structure of Adsorbents Prepared by Chemical Activation of Lignin with Alkali Hydroxides. J. Colloid Interface Sci. 2017, 486, 277–286. 10.1016/j.jcis.2016.10.003. [DOI] [PubMed] [Google Scholar]
- Ludwinowicz J.; Jaroniec M. Effect of Activating Agents on the Development of Microporosity in Polymeric-Based Carbon for CO2 Adsorption. Carbon 2015, 94, 673–679. 10.1016/j.carbon.2015.07.052. [DOI] [Google Scholar]
- Nowrouzi M.; Younesi H.; Bahramifar N. Superior CO2 Capture Performance on Biomass-Derived Carbon/Metal Oxides Nanocomposites from Persian Ironwood by H3PO4 Activation. Fuel 2018, 223, 99–114. 10.1016/j.fuel.2018.03.035. [DOI] [Google Scholar]
- Hayashi J.; Kazehaya A.; Muroyama K.; Watkinson A. P. Preparation of Activated Carbon from Lignin by Chemical Activation. Carbon 2000, 38, 1873–1878. 10.1016/S0008-6223(00)00027-0. [DOI] [Google Scholar]
- Rattanaphan S.; Rungrotmongkol T.; Kongsune P. Biogas Improving by Adsorption of CO2 on Modified Waste Tea Activated Carbon. Renewable Energy 2020, 145, 622–631. 10.1016/j.renene.2019.05.104. [DOI] [Google Scholar]
- Yue L.; Xia Q.; Wang L.; Wang L.; DaCosta H.; Yang J.; Hu X. CO2 Adsorption at Nitrogen-Doped Carbons Prepared by K2CO3 Activation of Urea-Modified Coconut Shell. J. Colloid Interface Sci. 2018, 511, 259–267. 10.1016/j.jcis.2017.09.040. [DOI] [PubMed] [Google Scholar]
- Choi S. W.; Tang J.; Pol V. G.; Lee K. B. Pollen-Derived Porous Carbon by KOH Activation: Effect of Physicochemical Structure on CO2 Adsorption. J. CO2 Util. 2019, 29, 146–155. 10.1016/j.jcou.2018.12.005. [DOI] [Google Scholar]
- Hong S.-M.; Yoon H. J.; Choi Y.; Cho Y.-Z.; Mun S.; Pol V. G.; Lee K. B. Solving Two Environmental Problems Simultaneously: Scalable Production of Carbon Microsheets from Structured Packing Peanuts with Tailored Microporosity for Efficient CO2 Capture. Chem. Eng. J. 2020, 379, 122219 10.1016/j.cej.2019.122219. [DOI] [Google Scholar]
- Setter C.; Borges F. A.; Cardoso C. R.; Mendes R. F.; Oliveira T. J. P. Energy Quality of Pellets Produced from Coffee Residue: Characterization of the Products Obtained via Slow Pyrolysis. Ind. Crops Prod. 2020, 154, 112731 10.1016/j.indcrop.2020.112731. [DOI] [Google Scholar]
- Ladshaw A.; Yiacoumi S.; Tsouris C.; Depaoli D. Generalized Gas-Solid Adsorption Modeling: Single-Component Equilibria. Fluid Phase Equilib. 2015, 388, 169–181. 10.1016/j.fluid.2015.01.003. [DOI] [Google Scholar]
- Goel C.; Mohan S.; Dinesha P. CO2 Capture by Adsorption on Biomass-Derived Activated Char: A Review. Sci. Total Environ. 2021, 798, 149296 10.1016/j.scitotenv.2021.149296. [DOI] [PubMed] [Google Scholar]
- Rehman A.; Park S.-J. Tunable Nitrogen-Doped Microporous Carbons: Delineating the Role of Optimum Pore Size for Enhanced CO2 Adsorption. Chem. Eng. J. 2019, 362, 731–742. 10.1016/j.cej.2019.01.063. [DOI] [Google Scholar]
- Myers A. L.; Prausnitz J. M. Thermodynamics of Mixed-Gas Adsorption. AIChE J. 1965, 11, 121–127. 10.1002/aic.690110125. [DOI] [Google Scholar]
- Walton K. S.; Sholl D. S. Predicting Multicomponent Adsorption: 50 Years of the Ideal Adsorbed Solution Theory. AIChE J. 2015, 61, 2757–2762. 10.1002/aic.14878. [DOI] [Google Scholar]
- Singh G.; Kim I. Y.; Lakhi K. S.; Srivastava P.; Naidu R.; Vinu A. Single Step Synthesis of Activated Bio-Carbons with a High Surface Area and Their Excellent CO2 Adsorption Capacity. Carbon 2017, 116, 448–455. 10.1016/j.carbon.2017.02.015. [DOI] [Google Scholar]
- Jung S.; Park Y. K.; Kwon E. E. Strategic Use of Biochar for CO2 Capture and Sequestration. J. CO2 Util. 2019, 32, 128–139. 10.1016/j.jcou.2019.04.012. [DOI] [Google Scholar]
- Nizamuddin S.; Siddiqui M. T. H.; Baloch H. A.; Mubarak N. M.; Griffin G.; Madapusi S.; Tanksale A. Upgradation of Chemical, Fuel, Thermal, and Structural Properties of Rice Husk through Microwave-Assisted Hydrothermal Carbonization. Environ. Sci. Pollut. Res. 2018, 25, 17529–17539. 10.1007/s11356-018-1876-7. [DOI] [PubMed] [Google Scholar]
- Mohan D.; Abhishek K.; Sarswat A.; Patel M.; Singh P.; Pittman C. U. Biochar Production and Applications in Soil Fertility and Carbon Sequestration—a Sustainable Solution to Crop-Residue Burning in India. RSC Adv. 2018, 8, 508–520. 10.1039/C7RA10353K. [DOI] [Google Scholar]
- Avramiotis E.; Frontistis Z.; Manariotis I. D.; Vakros J.; Mantzavinos D. Oxidation of Sulfamethoxazole by Rice Husk Biochar-Activated Persulfate. Catalysts 2021, 11, 850. 10.3390/catal11070850. [DOI] [Google Scholar]
- Zhu X. L.; Wang P. Y.; Peng C.; Yang J.; Yan X. B. Activated Carbon Produced from Paulownia Sawdust for High-Performance CO2 Sorbents. Chin. Chem. Lett. 2014, 25, 929–932. 10.1016/j.cclet.2014.03.039. [DOI] [Google Scholar]
- Ello A. S.; de Souza L. K. C.; Trokourey A.; Jaroniec M. Development of Microporous Carbons for CO2 Capture by KOH Activation of African Palm Shells. J. CO2 Util. 2013, 2, 35–38. 10.1016/j.jcou.2013.07.003. [DOI] [Google Scholar]
- Manoranjan N.; Woo S. I. Synthesis of Azo Linked Polymers by a Diazotization-Coupling Reaction and Its Application for CO2 Capture. RSC Adv. 2016, 6, 93463–93468. 10.1039/c6ra13267g. [DOI] [Google Scholar]
- Savova D.; Apak E.; Ekinci E.; Yardim F.; Petrov N.; Budinova T.; Razvigorova M.; Minkova V. Biomass Conversion to Carbon Adsorbents and Gas. Biomass Bioenergy 2001, 21, 133–142. 10.1016/S0961-9534(01)00027-7. [DOI] [Google Scholar]
- Khalid B.; Meng Q.; Akram R.; Cao B. Effects of KOH Activation on Surface Area, Porosity and Desalination Performance of Coconut Carbon Electrodes. Desalin. Water Treat. 2016, 57, 2195–2202. 10.1080/19443994.2014.979448. [DOI] [Google Scholar]
- Sing K. S. W. Reporting Physisorption Data for Gas/Solid Systems with Special Reference to the Determination of Surface Area and Porosity (Recommendations 1984). Pure Appl. Chem. 1985, 57, 603–619. 10.1351/pac198557040603. [DOI] [Google Scholar]
- Deng S.; Wei H.; Chen T.; Wang B.; Huang J.; Yu G. Superior CO2 Adsorption on Pine Nut Shell-Derived Activated Carbons and the Effective Micropores at Different Temperatures. Chem. Eng. J. 2014, 253, 46–54. 10.1016/j.cej.2014.04.115. [DOI] [Google Scholar]
- Serafin J.; Narkiewicz U.; Morawski A. W.; Wróbel R. J.; Michalkiewicz B. Highly Microporous Activated Carbons from Biomass for CO2 Capture and Effective Micropores at Different Conditions. J. CO2 Util. 2017, 18, 73–79. 10.1016/j.jcou.2017.01.006. [DOI] [Google Scholar]
- Sethia G.; Sayari A. Comprehensive Study of Ultra-Microporous Nitrogen-Doped Activated Carbon for CO2 Capture. Carbon 2015, 93, 68–80. 10.1016/j.carbon.2015.05.017. [DOI] [Google Scholar]
- Dulyaseree P.; Fujishige M.; Yoshida I.; Toya Y.; Banba Y.; Tanaka Y.; Aoyama T.; Phonyiem M.; Wongwiriyapan W.; Takeuchi K.; Endo M. Nitrogen-Rich Green Leaves of Papaya and Coccinia Grandis as Precursors of Activated Carbon and Their Electrochemical Properties. RSC Adv. 2017, 7, 42064–42072. 10.1039/C7RA06048C. [DOI] [Google Scholar]
- Singh Mr. G.; Lakhi K. S.; Park D.; Srivastava P.; Naidu R.; Vinu A. Facile One-Pot Synthesis of Activated Porous Biocarbons with a High Nitrogen Content for CO 2 Capture. ChemNanoMat 2018, 4, 281–290. 10.1002/cnma.201700348. [DOI] [Google Scholar]
- He S.; Chen G.; Xiao H.; Shi G.; Ruan C.; Ma Y.; Dai H.; Yuan B.; Chen X.; Yang X. Facile Preparation of N-Doped Activated Carbon Produced from Rice Husk for CO2 Capture. J. Colloid Interface Sci. 2021, 582, 90–101. 10.1016/j.jcis.2020.08.021. [DOI] [PubMed] [Google Scholar]
- Hong S. M.; Jang E.; Dysart A. D.; Pol V. G.; Lee K. B. CO2 Capture in the Sustainable Wheat-Derived Activated Microporous Carbon Compartments. Sci. Rep. 2016, 6, 34590 10.1038/srep34590. [DOI] [PMC free article] [PubMed] [Google Scholar]
- Zeng S.; Duan S.; Tang R.; Li L.; Liu C.; Sun D. Magnetically Separable Ni0.6Fe2.4O4 Nanoparticles as an Effective Adsorbent for Dye Removal: Synthesis and Study on the Kinetic and Thermodynamic Behaviors for Dye Adsorption. Chem. Eng. J. 2014, 258, 218–228. 10.1016/j.cej.2014.07.093. [DOI] [Google Scholar]
- Wilmer C. E.; Farha O. K.; Bae Y. S.; Hupp J. T.; Snurr R. Q. Structure–property relationships of porous materials for carbon dioxide separation and capture. Energy Environ. Sci. 2012, 5, 9849–9856. 10.1039/C2EE23201D. [DOI] [Google Scholar]