

Abstract
Glioblastomas (GBMs) represent the most aggressive form of brain tumor arising from the malignant transformation of astrocytes. Despite various advancements, treatment options remain limited to chemotherapy and radiotherapy followed by surgery giving an overall survival of 14–15 months. These therapies are somewhere restricted in giving a better survival and cure. There is a need for new therapeutics that could potentially target GBM based on molecular pathways and pathology. Here, ubiquitin E3 ligases can be used as targets as they bind a wide array of substrates and therefore can be attractive targets for new inhibitors. Through this study, we have tried to sort various ubiquitin E3 ligases based on their expression, pathways to which these ligases are associated, and mutational frequencies, and then we tried to screen potent inhibitors against the most favorable E3 ligase as very few studies are available concerning inhibition of E3 ligase in GBM. Our study found MDM2 to be the most ideal E3 ligase and further we tried to target MDM2 against various compounds under the alkaloid class. Molecular Docking and MD simulations combined with ADMET properties and BBB scores revealed that only evodiamine and sanguinarine were effective in inhibiting MDM2. We also tried to give a proposed mechanism of how these inhibitors mediate the p53 signaling in GBM. Therefore, the new scaffolds predicted by the computational approach could help in designing promising therapeutic agents targeting MDM2 in glioblastoma.
1. Introduction
Gliomas represent the most frequently occurring primary brain tumors that arise due to the abnormality in the glial cells such as ependymal cells, oligodendrocytes, astrocytes, etc.1 Based on the cells of origin, these gliomas are classified as anaplastic astrocytoma, oligodendrogliomas, and glioblastoma.2 Glioblastoma represents the most lethal and malignant form of brain tumor and accounts for 80% of the cases as recognized by the World Health Organization (WHO).3 However, the overall median survival of the patient remains only 9–15 months following the standard therapeutic regimes such as surgery, radiotherapy, and chemotherapy.4,5 This lack of precise therapeutic targeting of these tumors is due to the undefined etiology and incomplete knowledge of the underlying mechanism behind this disease. Recent data published concedes that there is 91% involvement of p53 pathway downregulation in a variety of carcinomas.6 As the treatment options are very limited, there is an urgent need to explore more options.7 In that case, ubiquitin E3 ligase remains an untouched area of discussion as the inhibitors targeting these ligases are very few in count. Ubiquitylation represents a reversible post-translational modification that is regulated by ubiquitin E3 ligases.8 Ubiquitin E3 ligases are known to target a broad spectrum of substrates that are involved in processes like DNA repair, apoptosis, and metabolism.9 Ubiquitin E3 ligases are the pinnacle of ubiquitination with a high frequency of selectivity against the substrate, therefore, making them an attractive drug target.10
Various ubiquitin E3 ligases are known to play an important role in commanding several activities of cells. Ubiquitin E3 ligases such as MDM2 (mouse double minute 2),11 BRCA1 (breast and ovarian cancer susceptibility protein 1),12 neural precursor cell-expressed developmentally downregulated 4 (NEDD4),13 tripartite motif-containing 21 (TRIM21),14 ring finger 41 (RNF41),15 ubiquitin-protein E3 ligase (UBE3A),16 and various other E3 ligases impart an important role. Although very few inhibitors are currently available that can target these ligases and can cause suppression in GBM proliferation,17−19 our study aimed to identify a ubiquitin E3 ligase whose expression was higher in glioblastoma and plays a prominent role in GBM signaling. For this, we performed expressional and mutational studies to predict the most suitable E3 ligase for therapeutics. Through our observations, MDM2 was found to be the most suitable ubiquitin E3 ligase as it shows higher mutational frequencies in GBM and is also involved in the activation of p53.20 MDM2 acts as a ubiquitin E3 ligase and functions by binding to p53 (tumor suppressor protein).21 The binding of MDM2 to p53 causes the inactivation of p53, leading to the functional loss in p53 activity.22 The functions mediated by p53 are DNA repair, senescence, apoptosis, arrest in cellular growth, and cell growth.23 Whenever there is cellular stress like genotoxicity, damage to the DNA, oncogene activation, and hyperproliferative stress, there is upregulation of an enzyme p14 alternate reading frame protein (ARF).24 This enzyme remains upstream to MDM2, promotes escape of p53 from MDM2 degradation and therefore, the tumor-suppressing functions of p53 are not lost.25 Studies have shown that mutation in MDM2 during cancerous conditions causes gene amplification in glioblastomas and on the side, p53 remains wild type.26 This amplification causes an overexpression in MDM2 that causes p53 inactivation and increased cancer progression. Hence, breaking the MDM2-p53 interactions seems to be a promising therapeutic approach to treating glioblastomas.27 Studies have been done to identify inhibitors that can potentially target MDM2 but are still in the pipeline. Inhibitors such as RG7112 (analogous to nutlin) cause MDM2 inactivation leading to increased cellular apoptosis and cell cycle arrest showing a reduction in tumor growth in xenografts.28 Nutlin-3a is known to inhibit the MDM2-p53 interactions and enhance p53-mediated apoptosis in osteosarcoma.29 Other inhibitors of MDM2 such as CGM097, MK8242, MI77301, and RG7388 are known to be used in various cancers although only a few are known to play an important role in the therapeutics of GBM.30−33 Studies have also shown that inhibiting MDM2 can also be a therapeutic option in treating GBMs possessing wild-type p53.34,35 These studies prove that MDM2 can be an effective target in tumorgenicity and breaking the p53-MDM2 interactions can be significant in GBM treatment. However, computational and in silico analysis by inculcating a combined approach of docking at a molecular level and dynamics simulation studies at the initial screening and analysis can help us to identify potential inhibitors against these ligases as they are very limited in count.36,37
Researchers have focused on identifying synthetic inhibitors as therapeutic options but these chemical inhibitors possess enhanced cytotoxicity. Studies concerning the use of natural alkaloids in GBM therapeutics are very few in number.38 Natural alkaloids can be of great value as they show very less or no side effects. Alkaloids represent an important class of natural compounds and are shown to induce cell death in GBM as they are potent antioxidants.39 Alkaloids such as melatonin (monoamine alkaloid) are able to inhibit MDM2 in the MCF7 breast cancer cell line.40 Melatonin is also known to inhibit phosphorylation of MDM2, enhancing acetylation of p53 thereby leading to p53-MDM2 disruption and gain of functions of p53.41 Another study found that papaverine (non-narcotic opium alkaloid) was able to induce suppression in GBM activity.42 Evodiamine is a natural alkaloid derived from the fruit of Evodia rutaecarpa (medicinal plant) mostly used by the Chinese in medicine.43 This alkaloid is known to exhibit the property of anti-inflammation and is known to be reported in reducing the proliferation of cancerous cells by the process of apoptosis and cell cycle arrest.44 Evodiamine was found to induce calcium/JNK-mediated autophagy and mitochondrial-mediated apoptosis in GBM.45,46 However, the role of evodiamine in targeting MDM2 as a ubiquitin E3 ligase remains unclear. Another alkaloid sanguinarine, which is a benzophenanthridine alkaloid, was able to induce apoptosis in human breast carcinoma cells.47 A recent study shows that evodiamine can inhibit liver carcinoma via Met/EGFR signaling.48 Evodiamine was found to induce apoptosis in lung carcinoma.49 Evodiamine has been shown to target the cancer stem-like cells through the p55-p21-Rb pathway in breast cancer.50 Sanguinarine, a benzophenanthridine, is a nitrogen-containing alkaloid isolated from the roots of Sanguinaria canadeni.51 This alkaloid is known to possess antibacterial and anti-inflammatory properties. Sanguinarine is found to induce apoptosis in a p53-dependent manner in hepatocellular carcinoma.52 Sanguinarine was also able to induce apoptosis in C6 rat glioblastoma cells.53 Sanguinarine was also able to induce metastasis in breast cancer.54 Sanguinarine is known to induce ROS-dependent activation of autophagy and possesses an anti-glioma effect.55
However, the role of sanguinarine in targeting MDM2 is not understood and how these alkaloids can be the potential inhibitors of ubiquitin E3 ligase is also unknown.56 Studies have shown that alkaloids can induce self-ubiquitination and degradation in MDM2 by targeting MDM2-DAXX-HAUSP interactions.57 Alkaloids such as berberine, matrine, and melatonin are reported to be effective in reducing the expression of MDM2 or decreasing the stability in acute lymphoblastic leukemia, liver carcinoma, and breast cancer.41,58 Other studies in which alkaloids can be seen in altering the MDM2-p53 signaling are indole-3-carbinol59 and fluspirilene60 targeting breast and colon cancer. Since alkaloids can target a variety of cancers, very few or no studies are available on the therapeutic targeting of GBM using alkaloids. In our study, we screened two natural alkaloids, i.e., evodiamine and sanguinarine based on the literature, docking, and simulation studies. Also, we checked how these compounds interact with MDM2 and used nutlin-3a as the reference against MDM2.36
Our study was focused on the identification of a potent ubiquitin E3 ligase and how these ubiquitin E3 ligases can be targeted using natural inhibitors. Our approach was based on using mutational analysis, pathway studies, and expressional analysis to explore the role of various ubiquitin E3 ligases in GBM. In the end, we were able to identify MDM2 as a targetable E3 ligase and we also tried to target this ligase with evodiamine and sanguinarine. These alkaloids were screened from the compound library, and the various physiochemical properties of these compounds were also accessed. Further, molecular docking and dynamics simulation studies were also performed to predict whether these inhibitors can target MDM2 and could be a new therapeutic avenue in targeting GBMs.
2. Materials and Methodology
2.1. Collection of Raw Data
Datasets that are used in the current study have been extracted from the National Centre for Biotechnology Information (NCBI) gene expression omnibus (GEO) (https://www.ncbi.nlm.nih.gov/geo/).61 The microarray gene expression profiles were obtained from GSE 4290, GSE 104291, and GSE 50161 datasets. The platform used in GSE 104291, GSE 50161, and GSE 4290 is GPL570 [HG-U133_Plus_2] Affymetrix human genome.
2.2. Identification of Differentially Expressed Genes
The present study utilized GEO2R (https://www.ncbi.nlm.nih.gov/geo/geo2r), a web-based interactive tool that works on the R language limma package. GEO2R can be used as a comparative tool for two or more sets of samples and is helpful in the prediction of differential expression in the GEO series.61 We used GEO2R to filter out the genes that were differentially expressed in these three datasets. To study the biological prospects, biological functions were annotated for differentially expressed genes. P-value < 0.05 and the |log FC| > 2 and |log FC| < 2 were used as cut-off criteria to filter out the differentially expressed genes (DEGs).
2.3. Screening of Ubiquitin E3 Ligases and Venn Analysis
The DEGs from the above three datasets were screened for the presence of any ubiquitin E3 ligases. UbiBrowser2.0 (http://ubibrowser.bio-it.cn/), an integrated bioinformatics platform was used as an identification tool for ubiquitin E3 ligases in these DEGs. Final confirmation of these DEGs as ubiquitin E3 ligases was done using UbiNet2.0 (https://awi.cuhk.edu.cn/~ubinet/index.php). DEGs that were identified as ubiquitin E3 ligases were then analyzed by VENN analysis to filter out common E3 ligases in these three datasets.
2.4. Functional Enrichment Analysis of Identified Ubiquitin E3 Ligases
To scrutinize the biological, cellular, and molecular functions and the various pathways involved in these ubiquitin E3 ligases, Gene Ontology (GO) terms and pathway prediction were done using SHINYGO 7.16 (http://bioinformatics.sdstate.edu/go/). Parameters such as a P-value < 0.05 and count > 3 were set as the threshold for significantly enriched terms. Eventually, the functional enrichment network was constructed.
2.5. Mutational Analysis and Expression Analysis of Common Ubiquitin E3 Ligases
To predict the mutational signatures of the identified ubiquitin E3 ligases, we used the cBio cancer genomic portal (https://www.cbioportal.org/). This platform can analyze the molecular data retrieved from cancerous tissues and cytogenetics and is useful in the determination of epigenetics and genetic levels. Expression analysis followed by mutational analysis was done using gene expression profiling interactive analysis 2 (http://gepia2.cancer-pku.cn/) to predict the rate of expression of identified E3 ligases in glioblastoma and to check whether the data is statistically significant or not. Here, n represents the value of normal patient count, whereas t represents the number of patients affected and suffering from glioblastoma. This data was obtained from TCGA and the expression analysis was performed using GEPAI2.
2.6. Compound Library Screening
In the present study, 70 alkaloids were taken from the naturally occurring plant-based anticancer compound activity-target (NPACT) database. The 3D chemical structure and canonical SMILES of these alkaloids were downloaded using PubChem.62 Ligand confirmations were downloaded in the 2D SDF format and visualization was done using Avogadro (https://avogadro.cc/) and then converted to the PDB format. These structures were checked for the presence of any H-bond or any other bound group apart from our ligand of interest.
2.7. Analysis of ADMET Descriptors and the Blood–Brain Barrier (BBB)
ADMET profiling (i.e., absorption, distribution, metabolism, excretion, and toxicity) of selected compounds was conducted using SwissADME.63 Both the physical and pharmaceutical properties were screened using SwissADME. CBligand (https://www.cbligand.org/CCGS/) was used as a platform to check the BBB permeability of the compounds used in the study. On the basis of the results obtained from SwissADME and CBligand analysis, filtered compounds were considered further for molecular docking and simulations with the filtered ubiquitin E3 ligase.
2.8. Molecular Docking Studies
The PDB structure of MDM2 (PDB id: 3JZK) was downloaded from the RCSB PDB database. Molecular docking was performed against the MDM2 receptor protein with filtered alkaloids. Docking analysis was performed using WEBINA (https://durrantlab.pitt.edu/webina/), a JavaScript that runs Auto Dock Vina entirely in a web browser.64 Molecular docking of MDM2 was performed with different alkaloids. Heteroatoms that were present within the PDB structure of MDM2 were removed and hydrogen was added using WEBINA. Structural visualization of MDM2 was done using Avogadro and UCSF Chimera (https://www.cgl.ucsf.edu/chimera/). Docking was performed by employing a grid size of x-axis = 40, y-axis = 45, and z-axis = 40. Prediction of docking results was based on the best interactions between the receptor and the ligand and on the binding affinity. The 3D and 2D confirmations were generated using Discovery Studio 2020.65 The complex that showed the best binding affinity as compared to the reference then proceeded for MD simulation studies.
2.9. Molecular Dynamics Simulations of Protein–Ligand Complexes
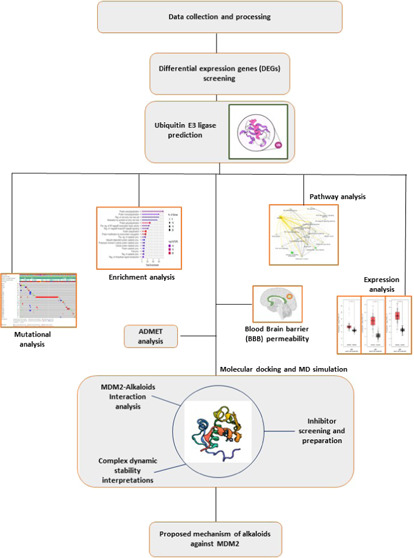
MD simulation of the identified compounds with MDM2 was performed individually using the GROMACS 2019.3 package (https://bioexcel.eu/gromacs-2019-6-is-available/). The top 14 ligand–protein complexes were first simulated at 20 ns to check the stability of the complexes. Complexes that were found to be stable at 20 ns were then considered for simulation on a 50 ns timescale to provide an insight into how stable they are and to see how they behave dynamically. Complex preparation was done using the CHARMM36 all-atom force field. The charge topology of the compounds was generated using CGenFF and then solvated in a cubical boundary box with a dimensional separation of 1.0 nm using a TIP3 water model. Charge neutralization was done via the addition of precise concentrations of chloride [Cl–] ions and sodium [Na+] ions. Energy minimization was performed at 10 kJ/mol/nm using the long steepest descent algorithm for 10,000 steps followed by 10,000 steps of a conjugate gradient to avoid any steric clashes. The system was then subjected to equilibration with position-restrained (NVT and NPT) dynamics simulations at a constant temperature and pressure of 300 K and 1 bar for a duration of 50 ns. The plots for the root-mean-square deviation (RMSD), root-mean-square fluctuation (RMSF), the radius of gyration (Rg), and the number of hydrogen bonds were then plotted. Complete methodology and workflow are shown in Figure 1.
Figure 1.

Workflow overview: data extraction was performed from the National Centre for Biotechnology Information (NCBI) gene expression omnibus (GEO). Data analysis and processing were performed using GEO2R. After data processing, the differentially expressed genes (DEGs) were filtered out from the datasets GSE 4290, GSE 104291, and GSE 50161. These DEGs were then filtered using parameters such as P-value and the fold change (log FC) values. Prediction of potential ubiquitin E3 ligases present within these three datasets was done using UbiNet and the confirmation of the DEGs acting as ubiquitin E3 ligases was done using UbiBrowser. Post E3 ligase prediction, Venn analysis was done to identify the common ubiquitin E3 ligases present within the three datasets. GO functional enrichment and pathway analyses were done using SHINYGO 7.16 to identify the functions of each of the 21 common ubiquitin E3 ligases and the pathways associated with them. After the enrichment and pathway analysis, mutational frequencies of the 21 common E3 ligases were checked using cBiportal to predict the most suitable and targetable ubiquitin E3 ligase for our study focusing on glioblastomas (GBMs). Using gene expression profiling interactive analysis 2 (GEPAI2), the expressions were checked for the ligases filtered after mutational analysis. Selection of the most appropriate E3 ligase for our study was preceded by exploring the compound libraries and we selected the naturally occurring plant-based anticancer compound activity-target (NPACT) library and alkaloids class for this study. The blood–brain permeability (BBB) scores were checked to identify the compounds that can cross the BBB using SwissADME. ADMET analysis was then applied to the filtered compound passing the BBB to check the parameters such as absorption, distribution, metabolism, excretion, and toxicity of the alkaloids. The protein structure of mouse double minute (MDM2) that was identified as the most suitable target based on mutational frequencies was downloaded using a protein database (PDB). Ligand structures were downloaded using PubChem along with their canonical SMILES. After the preparation of the receptor and ligand, docking was carried out to check for the most suitable ligand binding with the receptor (MDM2), showing the highest binding affinity and rate of inhibition. Compounds showing the best interaction and inhibition then proceeded for molecular dynamics simulations (MDS) studies till 50 ns to validate the interactions and the stability of the complex (protein–ligand). Based on all the analyses performed, a mechanism was proposed for how the identified inhibitors can target the MDM2 that might be able to suppress GBMs.
3. Results
3.1. Raw Data Collection and DEG Screening
The raw data from three gene expression profiles (GSE 4290, GSE 104291, and GSE 50161) were downloaded from NCBI GEO databases. Of these, GSE 4290 datasets comprised 81 glioblastoma samples and 23 nontumor samples, 4 glioblastoma and 2 nontumor samples existed in the 104291 dataset, and 34 glioblastoma and 13 normal brain samples were present in the GSE 50161 dataset. DEGs between the GBM samples and normal control samples were obtained from these three datasets.
3.2. Ubiquitin E3 Ligase Identification and Venn Analysis
After the identification of DEGs, screening of ubiquitin E3 ligases was done within these DEGs. These DEGs were individually picked up to check whether they showed the activity of an E3 ligase or not. DEGs that functioned as a substrate for a particular ligase were omitted from the study. A total of 181 ligases were predicted out of which 89 were present in GSE 4290, 50 in GSE 50161, and 42 in GSE 104291 and are shown in the Supporting Information File, Table 1. Venn analysis was then conducted to deduce the common ligases among all of the ligases that were present in these three datasets. Furthermore, 21 overlapping ubiquitin E3 ligases were procured using the Venn diagram and are represented in Figure 2A. The number of overlapping ubiquitin E3 ligases present in these datasets are shown in the Supporting Information File 1, Table 2.
Figure 2.

(A) Venn diagram and tabular description of the overlap between ubiquitin E3 ligases obtained from the datasets GSE 104291, GSE 4290, and GSE 50161. Significant overlaps show that 21 ubiquitin E3 ligases were commonly shared in these datasets. (B) Mutational analysis of the 21 common ubiquitin E3 ligases revealed that MDM2 showed the highest frequency among all of the other ligases in GBM. The percentages of mutations in the top 8 ubiquitin E3 ligases were MDM2 (9%), BRCA1 (1.8%), TRIM24 (1.6%), NEDD4 (1.3%), TRIM21 (1.1%), RNF41 (1%), UBE3A (1%), and TNFAIP3 (0.9%). MDM2 was found to be the most favorable ubiquitin E3 ligase that can be targeted in countering GBM. (C) Expression levels of MDM2. The expressional rate was defined between the GBM and normal samples from the TGCA database. Plots with an asterisk (*) on the top suggest that the data is statistically significant.
3.3. Expression Profiling and Mutational Analysis
To further substantiate the study, mutational signatures were predicted for 21 E3 ligases. Each gene acting as ubiquitin E3 ligase was checked for the rate of mutational frequencies and the kind of mutations they carry. MDM2 (9%) showed the highest percentage among the 21 ubiquitin E3 ligases. For ligases other than MDM2, the frequency of mutations was BRCA1 (1.8%), TRIM24 (1.6%), NEDD4 (1.3%), TRIM21 (1.1%), RNF41 (1%), and UBE3A (1%) and the mutational signatures that were carried in most of the ligases were of amplification and missense type. An overview of the mutational analysis performed for all of the ubiquitin E3 ligases has been shown in Figure 2B. Out of these 21 E3 ligases, the expressional analysis was performed only for those ligases that showed higher mutational frequencies using TGCA GBM data. The expressional analysis was carried out using GEPAI2. Noteworthily, when compared with control samples, the expression levels of MDM2, BRCA1, TRIM24, NEDD4, and TRIM21 were higher in GBM samples and showed statistical significance and the expressional analysis can be derived from Figure 2C. On the other hand, expressional levels in the case of UBE3A and RNF41 were also higher but the data was not significant statistically. On the other hand, expressional levels in the case of UBE3A and RNF41 were also higher but the data was not significant statistically, and the expressions can be seen in the Supporting Information File, Figure 1.
3.4. Functional Enrichment and Pathway Analysis
On the basis of the results mentioned above, a functional enrichment analysis of 21 ubiquitin E3 ligases was performed. Three types of enrichment analysis were done, comprising biological process (BP), molecular function (MF), and cellular component (CC). All these enrichments are shown in Figure 3A–C. The majority of ligases were mainly associated with GO_BP terms such as ubiquitin-protein transferase activity, protein polyubiquitination, ubiquitin-protein ligase activity, and protein autoubiquitination. In the case with GO_CC terms, these genes were involved in the formation of the ubiquitin ligase complex, transferase complex, Cul4B-RING E3 ubiquitin ligase complexes, and BRCA1-BARD1 complexes. As for GO_MF, most of the genes were related to ubiquitin binding, ubiquitin-protein transferase activity, ubiquitin-protein ligase activity, ubiquitin-like protein transferase activity, and damaged DNA binding. A detailed overview of the ligases and the process with which they are associated have been summarized in Table 1.
Figure 3.

(A–C) Gene ontology (GO) functional enrichment analysis of 21 common ubiquitin E3 ligases and (D, E) schematic representation of the KEGG pathway enrichment. (A) GO cellular Enrichment analysis revealed that the top processes in which most of the ligases are involved were the ubiquitin ligase complex, transferases complex, intracellular protein-containing complex, and catalytic complex The color and the size of the dots indicate if the false discovery rate (FDR) is significant or not. The bigger the dots, the more is the intensity of the red color, showing the greater significance and number of genes involved in that process. (B) GO biological process enrichment showed that the majority of ubiquitin E3 ligases were involved in processes like protein ubiquitination, protein modification by small protein conjugation, protein polyubiquitination, and proteolysis involved in the cellular protein catabolic process. (C) GO molecular function enrichment identified that most of the ligases were involved in ubiquitin-protein transferase activity, ubiquitin-like protein transferase activity, ubiquitin-protein ligase activity, and transcription coactivator activity. The more the red color of the dots, the more significant the FDR and the processes in which these ligases are involved. (D) Depicts the bar plot images of the various pathways for 21 ubiquitin E3 ligases and how they are enriched. The red bars here represent the most enriched and significant pathway and the blue bars represent less significance. Ubiquitin-mediated proteolysis is composed of most of the significant and overlapped genes followed by the Epstein–Barr virus infection, platinum drug resistance, p53 signaling, endocytosis, and glioma. (E) KEGG pathway network based on nodes and edges. The bigger the nodes present, the greater the number of genes involved, and thicker edges here represent significance. Edges for glioma have been highlighted in yellow.
Table 1. Tabular Representation of GO Functionally Enriched Ubiquitin E3 Ligases with the Associated Biological Processes and Molecular Functions.
| GO | category | description | log P | enrichment | Z-score | hits | hits list |
|---|---|---|---|---|---|---|---|
| GO:0016567 | GO biological processes | protein ubiquitination | –31.79 | 42.48 | 28.79 | 20 | BRCA1|DDB2|MDM2|TRIM37|NEDD4|SKP2|TRIM21|TNFAIP3|UBE3A|TRIM25|TRIM24|RNF41|TRIM22|TRIM38|RBCK1|MYLIP|RNF138|DTL|RAD18|TRIM5 |
| GO:0032446 | GO biological processes | protein modification by small protein conjugation | –30.96 | 38.65 | 27.43 | 20 | BRCA1|DDB2|MDM2|TRIM37|NEDD4|SKP2|TRIM21|TNFAIP3|UBE3A|TRIM25|TRIM24|RNF41|TRIM22|TRIM38|RBCK1|MYLIP|RNF138|DTL|RAD18|TRIM5 |
| GO:0000209 | GO biological processes | protein polyubiquitination | –24.92 | 89.47 | 35.14 | 14 | BRCA1|DDB2|MDM2|NEDD4|SKP2|TRIM21|TNFAIP3|UBE3A|RNF41|TRIM22|TRIM38|RBCK1|DTL|TRIM5 |
| GO:0030163 | GO biological processes | protein catabolic process | –14.19 | 24.27 | 16.56 | 12 | MDM2|NEDD4|SKP2|TNFAIP3|UBE3A|TRIM25|TRIM24|RNF41|TRIM38|RBCK1|MYLIP|DTL |
| GO:0051603 | GO biological processes | proteolysis is involved in the cellular protein catabolic process | –13.08 | 25.22 | 16.17 | 11 | MDM2|NEDD4|SKP2|TNFAIP3|UBE3A|TRIM25|RNF41|TRIM38|RBCK1|MYLIP|DTL |
| GO:0004842 | GO molecular functions | ubiquitin-protein transferase activity | –32.88 | 63.09 | 34.33 | 19 | BRCA1|DDB2|MDM2|TRIM37|NEDD4|TRIM21|TNFAIP3|UBE3A|TRIM25|TRIM24|RNF41|TRIM22|TRIM38|RBCK1|MYLIP|RNF138|DTL|RAD18|TRIM5 |
| GO:0019787 | GO molecular functions | ubiquitin-like protein transferase activity | –32.41 | 59.65 | 33.36 | 19 | BRCA1|DDB2|MDM2|TRIM37|NEDD4|TRIM21|TNFAIP3|UBE3A|TRIM25|TRIM24|RNF41|TRIM22|TRIM38|RBCK1|MYLIP|RNF138|DTL|RAD18|TRIM5 |
| GO:0061630 | GO molecular functions | ubiquitin-protein ligase activity | –22.81 | 63.70 | 29.56 | 14 | MDM2|TRIM37|NEDD4|TRIM21|UBE3A|TRIM25|TRIM24|RNF41|TRIM22|TRIM38|MYLIP|RNF138|RAD18|TRIM5 |
| GO:0061659 | GO molecular functions | ubiquitin-like protein ligase activity | –22.56 | 61.19 | 28.95 | 14 | MDM2|TRIM37|NEDD4|TRIM21|UBE3A|TRIM25|TRIM24|RNF41|TRIM22|TRIM38|MYLIP|RNF138|RAD18|TRIM5 |
| GO:0003713 | GO molecular functions | transcription coactivator activity | –13.12 | 48.65 | 20.59 | 9 | BRCA1|TRIM37|TRIM21|UBE3A|TRIM25|TRIM24|TRIM22|TRIM38|TRIM5 |
In addition, the KEGG pathway analysis showed that these ubiquitin E3 ligases were significantly involved in ubiquitin-mediated proteolysis, Epstein–Barr virus infection, p53 signaling, and endocytosis. Figure 3D,E tries to give an overview of KEGG pathways in which these ligases were involved. Further, all of the terms were merged into clusters based on similarities and the top pathways that were enriched with most of the overlapping ligases are represented in Table 2.
Table 2. Tabular Representation of the KEGG Pathway Analysis of the Predicted Ubiquitin E3 Ligases along with Their Fold Change and Enrichment False Discovery Rate (FDR).
| enrichment FDR | hits | fold enrichment | pathway | hit list |
|---|---|---|---|---|
| 1.74 × 10–09 | 7 | 53.89125296 | ubiquitin-mediated proteolysis | BRCA1, NEDD4, TRIM37, UBE3A, DDB2, MDM2, SKP2 |
| 2.55 × 10–05 | 5 | 26.86940123 | Epstein–Barr virus infection | NEDD4, TNFAIP3, DDB2, MDM2 SKP2 |
| 0.013265001 | 2 | 29.74037834 | platinum drug resistance | BRCA1, MDM2 |
| 0.013265001 | 2 | 29.74037834 | P53 signaling pathway | DDB2, MDM2 |
| 0.013265001 | 3 | 12.92290249 | endocytosis | NEDD4, MDM2, RNF41 |
| 0.013265001 | 3 | 16.04222379 | viral carcinogenesis | UBE3A, MDM2, SKP2 |
| 0.013265001 | 2 | 28.94730159 | glioma | DDB2, MDM2 |
| 0.013265001 | 2 | 30.15343915 | melanoma | DDB2, MDM2 |
| 0.013265001 | 2 | 28.56641604 | chronic myeloid leukemia | DDB2, MDM2 |
| 0.017380146 | 2 | 23.59834369 | small-cell lung cancer | DDB2, SKP2 |
| 0.020082398 | 2 | 20.87545788 | NF-kappa B signaling pathway | TNFAIP3, TRIM25 |
| 0.026614554 | 2 | 16.57288259 | FoxO signaling pathway | MDM2, SKP2 |
3.5. Compound Prediction, BBB, and ADMET Parameters
On the basis of literature mining, we identified NPACT, a database comprising different classes of natural compounds and selected the alkaloid class from the compound library; 70 compounds were selected from the database and the BBB permeability and the BBB score were checked using the SVM algorithm in CBligand. On the basis of BBB prediction, initially, 54 compounds were filtered. ADMET profiling for these 70 compounds was done to check whether the compounds fall under the prescribed limits of ADMET analysis. Properties such as molecular mass (<500 Da), number of H-bond donors (<5), number of H-bond acceptors (<10), octal water partition coefficient (log < 5), and molar refractivity (40–130) were considered for our study. The number of violations of the Lipinski rule of five was also taken into consideration for these 70 compounds. Only 54 compounds showed zero violation of the Lipinski rule and also satisfied the ADMET threshold and were further assessed for docking and simulation studies. The parameters of the alkaloid can be seen in the Supporting Information File, Table 3.
3.6. MDM2-Alkaloids’ Interaction Profiling
Molecular docking was carried out for the screened ubiquitin E3 ligase (MDM2) with different alkaloid compounds. Any extra residue attached to the ligand was removed along with any heteroatom. Any hydrogen or water attached to either the ligand or the receptor was also omitted before proceeding with docking. The reference study conducted before using nutlin-3a as a reference compound with MDM2 shows a binding affinity of −7.9 kcal/mol. However, we used a more stringent threshold of −8.0 kcal/mol in our study to shortlist the compounds, showing specific and nonspecific bindings. Docking was performed for 54 compounds and out of these only 14 compounds showed a binding energy of above −8.0 kcal/mol. These binding energies demonstrate the high binding affinity of these compounds against MDM2. The higher the binding in negative terms indicates the more the inhibition capability of these compounds for MDM2. During MDM2 docking, the maximum number of compounds along with the reference ligand showed common interactions with the receptor residues at Ile61, His96, Ile99, Leu54, Val93, and Tyr100. A binding potential of above −8.5 kcal/mol was seen in cepharanthine (−9 kcal/mol), sanguinarine (−8.6 kcal/mol), evodiamine (−8.6 kcal/mol), tomatidine (−8.6 kcal/mol), ellipticine (−8.6 kcal/mol), and tylophoridicine F (−8.6 kcal/mol). The binding energies of various alkaloids with the best affinity and the docking coordinates along with other properties can be interpreted in Table 3.
Table 3. Tabular Representation of the Various Alkaloids Docked against MDM2 and Their ADMET Profilinga.
| alkaloid | BBB predictor | BBB SwissADME | affinity (kcal/mol) | molecular mass (<500 Da) | docking coordinates | H-bond donor (<5) | H-bond acceptor (<10) | octal water partition coefficient (log < 5) | molar refractivity (40–130) |
|---|---|---|---|---|---|---|---|---|---|
| brucine | yes | yes | –8.2 | 394.46 g/mol | 40–40–40 | 0 | 5 | 1.84 | 114.04 |
| chelerythrine | yes | yes | –8.1 | 348.37 g/mol | 40–40–40 | 0 | 4 | 3.02 | 101.6 |
| isostrychnine | yes | yes | –8.2 | 334.41 g/mol | 40–40–40 | 1 | 3 | 1.85 | 102.77 |
| sanguinarine | yes | yes | –8.6 | 334.41 g/mol | 40–40–40 | 0 | 3 | 2.09 | 101.05 |
| tomatidine | yes | yes | –8.6 | 354.44 g/mol | 40–40–40 | 1 | 4 | 2.61 | 103.74 |
| (R)-cryptopleurine | yes | yes | –7.9 | 393.48 g/mol | 40–40–40 | 0 | 5 | 4.04 | 119.16 |
| cepharanthine | yes | yes | –9 | 369.45 g/mol | 40– 40–40 | 0 | 5 | 3.33 | 108.8 |
| ellipticine | yes | yes | –8.6 | 303.36 g/mol | 40–40–40 | 1 | 1 | 2.7 | 97.67 |
| evodiamine | yes | yes | –8.6 | 315.49 g/mol | 40–40–40 | 1 | 2 | 3.88 | 96.52 |
| isotetrandrine | yes | no | –8.2 | 275.26 g/mol | 40–40–40 | 0 | 4 | 2.88 | 76.67 |
| liriodenine | yes | yes | –8.3 | 478.62 g/mol | 40–40–40 | 0 | 6 | 4.43 | 147.34 |
| tylophoridicine C | yes | no | –8.1 | 381.42 g/mol | 40–40–40 | 2 | 5 | 0.78 | 112.73 |
| tylophoridicine F | yes | yes | –8.6 | 395.45 g/mol | 40–40–40 | 1 | 5 | 1.11 | 117.2 |
| 6-O-desmethylantofine | yes | yes | –8.2 | 349.42 g/mol | 40–40–40 | 1 | 4 | 3.67 | 108.2 |
Alkaloids highlighted in red represent evodiamine and sanguinarine with their binding energies highlighted in yellow.
After the successful completion of docking, these 14 compounds then proceeded with molecular simulation studies. Evodiamine and sanguinarine showed the best possible interactions as compared to the reference used in our study, and the binding energies along with the interactions can be observed in Table 4.
Table 4. Tabular Representation of Binding Energies and the Interaction of Evodiamine, Sanguinarine, and Nutlin with MDM2.
| compounds | binding energy (kJ/mol) | interacting residues |
|---|---|---|
| evodiamine | –8.6 | Val93, Ile61, His96, Ile99, Leu54 and Leu57 |
| sanguinarine | –8.6 | Val93, Ile61, His96, Tyr100, Leu64 |
| reference (nutlin) | –7.9 | Val93, Ile61, His96, Ile99, Leu54, Phe55, Phe91, Phe86, Leu57 and Lys51. |
The 2D and 3D confirmations of evodiamine, sanguinarine, and the reference after binding with MDM2 can be observed in Figure 4A–C.
Figure 4.

(A–C) Molecular docking confirmations: Representation of 2D and 3D confirmation of MDM2 binding with (A) sanguinarine shows binding at the residues Val93, Ile61, His96, Tyr100, and Leu64 of the MDM2 protein. (B) Evodiamine represents the interactions at the sites Val93, Ile61, His96, Ile99, Leu54, and Leu57 of MDM2. (C) Reference ligand (nutlin-3a) showing interactions with MDM2 at the residues sites Val93, Ile61, His96, Ile99, Leu54, Phe55, Phe91, Phe86, Leu57, and Lys51.
3.7. MDM2-Alkaloid Complexes’ Dynamic Stability
All of the 14 compounds having binding energy above −8.0 kcal/mol were subjected to MD simulations for 50 ns, which helped us to understand the pattern of interaction and the dynamic behavior. The stability of these compounds with MDM2 was analyzed using RMSD obtained from MD simulations. The RMSD of different protein–ligand complexes along with the RMSD of ligands alone were considered. The backbone of the complexes (MDM2-sanguinarine and MDM2-evodiamine) were found to be stable when compared with the MDM2-reference complex or with the protein alone. The RMSD showed a fluctuation in the beginning and reached 0.30 nm but gradually decreased and was stable in the range of 0.15–0.25 nm when compared with the reference complex. Till 20 ns there was a slight deviation in the stability of complexes (MDM2-sanguinarine and MDM2-evodiamine) from the MDM2-reference complex. After 25 ns of simulation, the complexes started stabilizing themselves and after 35 ns both the complexes achieved better stability and were interactive till 50 ns, which can be seen in Figure 5A. Similarly, the RMSD of all of the ligands is given in Figure 5B, and it clearly shows that sanguinarine and evodiamine are both stable when compared with the reference compound; however, the RMSD of the ligand sanguinarine fluctuated in the beginning and reached 0.7 nm, but after 32 ns, it started to stabilize and was in the range of 0.2–0.4 nm.
Figure 5.

(A–C) Plots depicting variations in the root-mean-square deviation (RMSD) and root-mean-square fluctuations (RMSF) in protein alone, ligand alone, and protein–ligand complexes. (A) RMSD of MDM2, MDM2-evodiamine, MDM2-sanguinarine, and MDM2-reference complexes were calculated and plotted on the graph. The Y-axis represents the RMSD in nanometers (nm), and the X-axis represents the time in nanoseconds (ns). The RMSD of each of these was calculated at a timescale of 50 ns. Highlighted in gold represents the RMSD peak of the MDM2 protein itself. The MDM2-evodiamine RMSD peak can be seen in blue. The RMSD peak of the MDM2-sanguinarine complex is represented in orange and the peak for the MDM2-reference complex is represented in blue. This graph clearly shows that when the overall RMSD was compared, MDM2-evodiamine and MDM2-sanguinarine complexes were found to be stable against the MDM2-reference complex till 50 ns. RMSD of these complexes can be seen as stable in the range of 0.15–0.25 nm and showed stability after 35 ns. (B) Overall RMSD peak of the reference ligand, sanguinarine, and evodiamine are highlighted in blue, gray, and gold. The RMSD of the sanguinarine and evodiamine was found in the range of 0.2–0.4 nm and was stable till 50 ns. (C) RMSF peaks of MDM2-reference, MDM2-sanguinarine, and MDM2-evodiamine are represented in blue, orange, and gray, respectively. The RMSF of MDM2-sanguinarine and MDM2-evodiamine can be seen in the range with the MDM2-reference complex.
The RMSF of both the complexes along with the MDM2-reference is depicted in Figure 5C. It can be seen that the RMSF values of the two complexes are in the range with the MDM2-reference complex and are found to be stable in the range of 0.1–0.2 nm. The Rg is generally identified to check the compactness of the protein structure, and if the structure is stably folded, it will remain stable over time. It can be seen that the Rg values for both MDM2-evodiamine and MDM2-sanguinarine were found to be stable and compact for 50 ns, holding an average Rg of 1.6 nm (Figure 6A) when compared with MDM2-reference. The Coulomb’s interaction energy of each of the complexes was calculated and from the analysis it was seen that as compared to the reference, the interaction energy was more negative in the case of the other two complexes, suggesting a higher binding potential of the MDM2 receptors with ligands sanguinarine and evodiamine. The overall interaction can be seen in Figure 6B. The plots for H-bonds and pairing within 0.35 nm in Figure 6C,D shows the interactions of the amino acid residue of MDM2 with evodiamine, sanguinarine, and reference compounds during the 50 ns simulations. The formation of different types of bonds between various complexes suggests important evidence for the inhibitory potential of evodiamine and sanguinarine.
Figure 6.

(A–D) Plots representing the radius of gyration (Rg), interaction energy, number of H-bonds, and H-bond pairs within 0.35 nm. (A) Rg of all of the complexes (MDM2-evodiamine, MDM2-sanguinarine, and MDM2-reference) plotted against time with the Y-axis representing Rg in nanometers (nm), while the X-axis shows time interval in picoseconds (ps). Peak showing the interaction Rg of MDM2-evodiamine is highlighted in blue, orange in the case of MDM2-sanguinarine, and gray in MDM2-reference. The Rg of MDM2-reference showed fluctuations from the other two complexes but in the case of MDM2-evodiamine and MDM2-sanguinarine, the peaks were in the range when compared with the MDM2-reference complex, (B) Coulomb’s interaction energy in kJ/mol plotted against time in ps. The Coulomb’s interaction energy peaks in the case of MDM2-evodiamine are shown in light green, MDM2-sanguinarine in yellow, and MDM2-reference in blue. The interaction was more toward the negative and reached −70 kJ/mol in the case of MDM2-evodiamine and reached −60 kJ/mol in MDM2-sanguinarine as compared to MDM2-reference (−40 kJ/mol) suggesting a more stable interaction in the case of evodiamine and sanguinarine. (C) Plot for the number of H-bonds on each residue against time in ps. The overall H-bonds in the case of reference per residue were comparatively lower and the peak is displayed in blue. The peak for H-bonds in the case of evodiamine is shown in orange and for sanguinarine in gray. The number of H-bonds in the case of evodiamine was higher, followed by sanguinarine and reference. (D) H-bond pairing within a radius of 0.35 nm can be seen in the reference (blue), evodiamine (yellow), and sanguinarine (gray). These parings with MDM2 suggest that the pairs per residue formed in the case of sanguinarine and the pair formation were almost equal in the reference and evodiamine suggesting greater stability of sanguinarine and evodiamine with MDM2 till 50,000 ps (50 ns).
4. Discussion
GBM is highly aggressive and metastatic among other tumors of the central nervous system (CNS) with very complicated biology and carries a poor prognosis. The molecular mechanism and the signaling pathways underlying these tumors are of great significance and therefore in-depth studies are needed to counter these tumors. The overall survival in patients is very less and the therapeutic angles are also fewer. When talking about chemotherapeutics, temozolomide acts as a gold standard against these solid tumors. Surgery followed by concurrent radiotherapy remains an option. As ubiquitin E3 ligases target a large number of substrates that are regulators of the majority of cellular functions such as apoptosis, DNA repair, and metabolism, hence, they can be the therapeutic drug targets in GBMs.15 This study has tried to identify the various ubiquitin E3 ligases whose expressions are comparatively higher in GBMs, their involvement in functions operating at molecular and cellular levels, and mutational frequencies of the identified ubiquitin E3 ligase in GBMs. After the identification of targetable E3 ligases, we also tried to predict substantial inhibitors that could inhibit the expression of these identified ubiquitin E3 ligases.
Using high-throughput studies and a bioinformatics approach, DEGs were first extracted from three GBM datasets using the GEO database. These DEGs were analyzed using UbiNet and Ubibrowser (tools to predict whether the DEG is ubiquitin E3 ligase or just the substrate of any ligase). Only 21 ubiquitin E3 ligases were retrieved that were shared equally among the three datasets for GBM. Functional enrichment and KEGG analysis were carried out to see how these ubiquitin E3 ligases play an intricate role in glioblastoma at molecular, cellular, and biological levels along with the pathways on which they act. It was seen that at biological levels, out of 21 ligases, 20 were involved in the process of protein ubiquitination, protein modification by small protein conjugation, and 14 hits were involved in protein polyubiquitination. At molecular levels, most of the hits were associated with ubiquitin-protein transferase activity and ubiquitin-protein ligase activity. It was conferred from these functional enrichments that most of the hits that were common in these processes were MDM2, BRCA1, RNF41, TRIM21, NEDD4, and TRIM24. Similarly, the KEGG pathway analysis also revealed that out of these ligases, MDM2 was majorly involved in the pathways like endocytosis, ubiquitin-mediated proteolysis, and various pathways in cancer. Researchers have shown that MDM2 plays a prominent role in mediating the activation of p53 during various signaling cascades,66 and therefore, they can be better targets as ubiquitin E3 ligases. The mutational frequencies of these ubiquitin ligases were checked using data from TGCA and Mayo clinic and it was found that MDM2 carried a mutational frequency of 9% and the mutations were of the amplification type. Expression analysis of MDM2 along with other ubiquitin E3 ligases in GBM revealed that in most of the cases, the data showed statistical significance. This tells us that the expression of MDM2 was comparatively higher in patients with GBM as compared to the normal group of people according to TGCA. As very few studies are available on how ubiquitin E3 ligases can be therapeutically important and therefore, by predicting the expression of every ligase, selective targeting using either siRNA or any drug or natural compound can somehow reduce the expression of these ubiquitin E3 ligases.
Molecular docking studies showed that binding energies of evodiamine (−8.6 kJ/mol) and sanguinarine (−8.6 kJ/mol) were comparatively higher than that of the reference compound (−7.6 kJ/mol), suggesting a more sustained inhibitory effect of these alkaloids against MDM2. Sanguinarine was able to bind at the residues Val93, Ile61, His96, Tyr100, and Leu64 of the MDM2 protein while evodiamine represents interactions at the sites Val93, Ile61, His96, Ile99, Leu54, and Leu57 of MDM2. The reference showed interaction with MDM2 at the residue sites Val93, Ile61, His96, Ile99, Leu54, Phe55, Phe91, Phe86, Leu57, and Lys51. Although evodiamine and sanguinarine predicted fewer interactions as compared to the reference, based on the affinity score, these compounds were checked for stability with MD simulations. From the results obtained from simulation studies, the fluctuation and stability of the system during the simulation and the outcome trajectories for all of the complexes were inspected using different simulation parameters. These parameters included the backbone RMSDs for all of the atoms and ligands, RMSF of individual amino acid residues, formation of H-bonds, and Rg. RMSD plots when compared showed that the hits bounded to MDM2, evodiamine, and sanguinarine possessed lower fluctuations in RMSD and greater stability at the active site during the simulation at 50 ns. The RMSDs were calculated between the initial confirmations and final confirmations throughout 50 ns in dynamics simulations. This showed us that evodiamine and sanguinarine showed more stable binding when compared with the reference. RMSF on the other hand represented the important residues that were involved in strong interactions with specific ligands. The pattern of RMSF peaks suggests that the fluctuations in the values of evodiamine and sanguinarine were close to the reference and exhibited almost similar patterns. Coming to the Rg, it was seen that Rg values of the backbone atoms of MDM2 when bound to evodiamine and sanguinarine were nearly the same when compared with the reference bound to MDM2 and were maintained thoroughly till 50 ns. The results were generated from interaction energy peaks, and it can be conferred that the interactions between evodiamine, sanguinarine, and MDM2 were more stable and stronger as compared to the reference. These findings somewhere reinforced the credibility of docking results, suggesting the potential role of evodiamine and sanguinarine as potent inhibitors of MDM2.
Previous studies have shown that MDM2 acts as ubiquitin E3 ligases and also promotes the ubiquitination of p53.67 This process mediated by MDM2 leads to the identification and interaction of the proteasome by p53 thereby causing increased degradation of p53. However, the mechanism by which evodiamine and sanguinarine target the MDM2 and hence p53 remains unclear. We, therefore, proposed a mechanism of how both of these compounds could potentially target MDM2 and can induce a therapeutic response in GBM, and the proposed mechanism can be seen in Figure 7.
Figure 7.

Proposed mechanism of action of evodiamine and sanguinarine in MDM2 inhibition. Stress-induced due to genotoxicity, DNA damage, ionizing radiations, and other factors cause the activation of p53 (tumor suppressor gene) bound to MDM2. Overexpressed MDM2 causes the degradation of p53 and is not able to function properly. We hypothesized that breaking the MDM2-p53 interaction by either evodiamine or sanguinarine can prevent the degradation of p53. Upon preventing degradation of p53, activation of downstream targets associated with p53-MDM2 interactions such as the Bcl2-associated protein (BAX) causing apoptosis, growth arrest, and DNA-damage inducible gene (GADD45), and the P21 WAF causes an increase in apoptosis, DNA repair, and cell cycle arrest, therefore, restoring the normal cellular mechanism and can suppress glioblastoma.
5. Conclusions
In summary, the role of MDM2 as a potential ubiquitin E3 ligase was identified, and how it can be the game changer in the therapeutic targeting of GBM. Through our studies, it was assumed that targeting this ligase using a natural class of inhibitors instead of synthetic compounds can be more fruitful. Also, our study tried to give a proposed mechanism of how evodiamine and sanguinarine disrupt MDM2-p53 interactions and target the p53 signaling in GBM. As very few studies are available concerning therapeutics in GBM, there is an urgent need to explore other opportunities so that survival can be enhanced in patients suffering from this cancer. However, more concrete studies are still needed to display how evodiamine and sanguinarine can exploit this cancer for better therapeutics.
Acknowledgments
The authors would like to thank the senior management of Delhi Technological University (DTU) and the Department of Science and Technology (DST), India, for their constant support and financial assistance to Senior Research Fellowship (SRF) Sudhanshu Sharma (Fellow ID: IF190188).
Glossary
Abbreviations
- GBM
glioblastomas
- BRCA1
breast and ovarian cancer susceptibility protein 1
- NEDD4
neural precursor cell-expressed developmentally downregulated 4
- TRIM 21
tripartite motif-containing 21
- RNF41
ring finger41
- UBE3A
ubiquitin-protein E3 ligase
- MDM2
mouse double minute 2
- ARF
alternate reading frame
- EGFR
epidermal growth factor receptor
- GEPAI2
gene expression profiling interactive analysis 2
- GEO
gene expression omnibus
- PDB
protein database
- RMSD
root-mean-square deviation
- RMSF
root-mean-square fluctuation
- Rg
radius of gyration
- MD simulation
molecular dynamics simulations
- NPT
constant temperature, constant pressure
- NVT
constant temperature, constant volume
- BAX
Bcl2-associated protein
- GADD45
growth arrest and DNA-damage inducible gene
- KEGG
Kyoto Encyclopedia of Genes and Genomics
- ADMET
chemical absorption, distribution, metabolism, excretion, and toxicity
- GO
gene ontology
Supporting Information Available
The Supporting Information is available free of charge at https://pubs.acs.org/doi/10.1021/acsomega.2c07904.
Ubiquitin E3 ligases (Table 2); common interacting ligases (Table 2); BBB scores and ADMET profiling (Table 3); and expressional analysis (Figure 1) (PDF)
Author Contributions
P.K. conceived and designed the manuscript; S.S. collected and analyzed the data; and S.S. and P.K. wrote the manuscript, discussed the results, and analyzed the entire data.
The authors declare no competing financial interest.
Supplementary Material
References
- Komori T. Grading of Adult Diffuse GliomasAccording to the 2021 WHO Classification of Tumors of the Central Nervous System. Lab. Invest. 2022, 102, 126–133. 10.1038/s41374-021-00667-6. [DOI] [PubMed] [Google Scholar]
- Masui K.; Mischel P. S.; Reifenberger G.. Molecular Classification of Gliomas. In Handbook of Clinical Neurology; Elsevier, 2016; Vol. 134, pp 97–120. 10.1016/B978-0-12-802997-8.00006-2. [DOI] [PubMed] [Google Scholar]
- Gupta A.; Dwivedi T. A Simplified Overview of World Health Organization Classification Update of Central Nervous System Tumors 2016. J. Neurosci. Rural Pract. 2017, 08, 629–641. 10.4103/JNRP.JNRP_168_17. [DOI] [PMC free article] [PubMed] [Google Scholar]
- Di Carlo D. T.; Cagnazzo F.; Benedetto N.; Morganti R.; Perrini P. Multiple High-Grade Gliomas: Epidemiology, Management, and Outcome. A Systematic Review and Meta-Analysis. Neurosurg. Rev. 2019, 42, 263–275. 10.1007/S10143-017-0928-7. [DOI] [PubMed] [Google Scholar]
- Krex D.; Klink B.; Hartmann C.; Von Deimling A.; Pietsch T.; Simon M.; Sabel M.; Steinbach J. P.; Heese O.; Reifenberger G.; Weller M.; Schackert G. Long-Term Survival with Glioblastoma Multiforme. Brain 2007, 130, 2596–2606. 10.1093/BRAIN/AWM204. [DOI] [PubMed] [Google Scholar]
- Donehower L. A.; Soussi T.; Korkut A.; Liu Y.; Schultz A.; Cardenas M.; Li X.; Babur O.; Hsu T. K.; Lichtarge O.; Weinstein J. N.; Akbani R.; Wheeler D. A. Integrated Analysis of TP53 Gene and Pathway Alterations in The Cancer Genome Atlas. Cell Rep. 2019, 28, 1370–1384. 10.1016/J.CELREP.2019.07.001. [DOI] [PMC free article] [PubMed] [Google Scholar]
- Frosina G. Limited Advances in Therapy of Glioblastoma Trigger Re-Consideration of Research Policy. Crit. Rev. Oncol./Hematol. 2015, 96, 257–261. 10.1016/J.CRITREVONC.2015.05.013. [DOI] [PubMed] [Google Scholar]
- Brooks C. L.; Gu W. Dynamics in the P53-Mdm2 Ubiquitination Pathway. Cell Cycle 2006, 3, 893–897. 10.4161/CC.3.7.997. [DOI] [PubMed] [Google Scholar]
- Zheng N.; Shabek N. Ubiquitin Ligases: Structure, Function, and Regulation. Annu. Rev. Biochem. 2017, 86, 129–157. 10.1146/ANNUREV-BIOCHEM-060815-014922. [DOI] [PubMed] [Google Scholar]
- Huang X.; Dixit V. M. Drugging the Undruggables: Exploring the Ubiquitin System for Drug Development. Cell Res. 2016, 26, 484–498. 10.1038/cr.2016.31. [DOI] [PMC free article] [PubMed] [Google Scholar]
- Clegg H. V.; Itahana K.; Zhang Y. Unlocking the Mdm2-P53 Loop: Ubiquitin Is the Key. Cell Cycle 2008, 7, 287–292. 10.4161/CC.7.3.5358. [DOI] [PubMed] [Google Scholar]
- Umphlett M.; Shea S.; Tome-Garcia J.; Zhang Y.; Hormigo A.; Fowkes M.; Tsankova N. M.; Yong R. L. Widely Metastatic Glioblastoma with BRCA1 and ARID1A Mutations: A Case Report. BMC Cancer 2020, 20, 47 10.1186/S12885-020-6540-1. [DOI] [PMC free article] [PubMed] [Google Scholar]
- Huang X.; Chen J.; Cao W.; Yang L.; Chen Q.; et al. The many substrates and functions of NEDD4-1. Cell Death Dis. 2019, 10, 904 10.1038/s41419-019-2142-8. [DOI] [PMC free article] [PubMed] [Google Scholar]
- Alomari M. TRIM21 – A Potential Novel Therapeutic Target in Cancer. Pharmacol. Res. 2021, 165, 105443 10.1016/J.PHRS.2021.105443. [DOI] [PubMed] [Google Scholar]
- Humphreys L.; Smith P.; Chen Z.; et al. The role of E3 ubiquitin ligases in the development and progression of glioblastoma. Cell Death Differ. 2021, 28, 522–537. 10.1038/s41418-020-00696-6. [DOI] [PMC free article] [PubMed] [Google Scholar]
- Simchi L.; Panov J.; Morsy O.; et al. Novel Insights into the Role of UBE3A in Regulating Apoptosis and Proliferation. J. Clin. Med. 2020, 9, 1573 10.3390/jcm9051573. [DOI] [PMC free article] [PubMed] [Google Scholar]
- Zhang S.; Peng X.; Li X.; Liu H.; Zhao B. BKM120 Sensitizes Glioblastoma to the PARP Inhibitor Rucaparib by Suppressing Homologous Recombination Repair. Cell Death Dis. 2021, 12, 546 10.1038/s41419-021-03805-6. [DOI] [PMC free article] [PubMed] [Google Scholar]
- Lian Y.; Huang Y.; Zhang Y.; Chen D. CACYBP Enhances Cytoplasmic Retention of P27Kip1 to Promote Hepatocellular Carcinoma Progression in the Absence of RNF41 Mediated Degradation. Theranostics 2019, 26, 8392–8408. 10.7150/thno.36838. [DOI] [PMC free article] [PubMed] [Google Scholar]
- Zhao Z.; Wang Y.; Yun D.; Huang Q. TRIM21 Overexpression Promotes Tumor Progression by Regulating Cell Proliferation, Cell Migration and Cell Senescence in Human Glioma. Cell Death Dis. 2021, 12, 14 10.1038/s41419-020-03307-x. [DOI] [PMC free article] [PubMed] [Google Scholar]
- Haupt Y.; Maya R.; Kazaz A.; Oren M. Mdm2 Promotes the Rapid Degradation of P53. Nature 1997, 387, 296–299. 10.1038/387296a0. [DOI] [PubMed] [Google Scholar]
- England B.; Huang T.; Karsy M. Current Understanding of the Role and Targeting of Tumor Suppressor P53 in Glioblastoma Multiforme. Tumor Biol. 2013, 34, 2063–2074. 10.1007/S13277-013-0871-3. [DOI] [PubMed] [Google Scholar]
- Zhao Y.; Aguilar A.; Bernard D.; Wang S. Small-Molecule Inhibitors of the MDM2–P53 Protein–Protein Interaction (MDM2 Inhibitors) in Clinical Trials for Cancer Treatment: Miniperspective. J. Med. Chem. 2015, 58, 1038–1052. 10.1021/jm501092z. [DOI] [PMC free article] [PubMed] [Google Scholar]
- Mello S. S.; Attardi L. D. Deciphering P53 Signaling in Tumor Suppression. Curr. Opin. Cell Biol. 2018, 51, 65–72. 10.1016/J.CEB.2017.11.005. [DOI] [PMC free article] [PubMed] [Google Scholar]
- Kurki S.; Latonen L.; Laiho M. Cellular Stress and DNA Damage Invoke Temporally Distinct Mdm2, P53 and PML Complexes and Damage-Specific Nuclear Relocalization. J. Cell Sci. 2003, 116, 3917–3925. 10.1242/JCS.00714. [DOI] [PubMed] [Google Scholar]
- Jin Y.; Xiao W.; Song T.; Feng G.; Dai Z. Expression and Prognostic Significance of P53 in Glioma Patients: A Meta-Analysis. Neurochem. Res. 2016, 41, 1723–1731. 10.1007/S11064-016-1888-Y. [DOI] [PubMed] [Google Scholar]
- Schiebe M.; Ohneseit P.; Hoffmann W.; Meyermann R.; Rodemann H. P.; Bamberg M. Analysis of Mdm2 and P53 Gene Alterations in Glioblastomas and Its Correlation with Clinical Factors. J. Neuro-Oncol. 2000, 49, 197–203. 10.1023/A:1006410702284. [DOI] [PubMed] [Google Scholar]
- Nag S.; Zhang X.; Srivenugopal K. S.; Wang M.-H.; Wang W.; Zhang R. Targeting MDM2-P53 Interaction for Cancer Therapy: Are We There Yet?. Curr. Med. Chem. 2014, 21, 553–574. 10.2174/09298673113206660325. [DOI] [PMC free article] [PubMed] [Google Scholar]
- Her N. G.; Oh J. W.; Oh Y. J.; Han S.; Cho H. J.; Lee Y.; Ryu G. H.; Nam D. H. Potent Effect of the MDM2 Inhibitor AMG232 on Suppression of Glioblastoma Stem Cells. Cell Death Dis. 2018, 9, 792 10.1038/s41419-018-0825-1. [DOI] [PMC free article] [PubMed] [Google Scholar]
- Wang B.; Fang L.; Zhao H.; Xiang T.; Wang D. MDM2 Inhibitor Nutlin-3a Suppresses Proliferation and Promotes Apoptosis in Osteosarcoma Cells. Acta Biochim. Biophys. Sin. 2012, 44, 685–691. 10.1093/ABBS/GMS053. [DOI] [PubMed] [Google Scholar]
- Ding Q.; Zhang Z.; Liu J. J.; Jiang N.; Zhang J.; Ross T. M.; Chu X. J.; Bartkovitz D.; Podlaski F.; Janson C.; Tovar C.; Filipovic Z. M.; Higgins B.; Glenn K.; Packman K.; Vassilev L. T.; Graves B. Discovery of RG7388, a Potent and Selective P53-MDM2 Inhibitor in Clinical Development. J. Med. Chem. 2013, 56, 5979–5983. 10.1021/jm400487c. [DOI] [PubMed] [Google Scholar]
- Wang Y.; Hoi P.; Chan J.; Lee S. New Perspective on the Dual Functions of Indirubins in Cancer Therapy and Neuroprotection. Anti-Cancer Agents Med. Chem. 2014, 14, 1213–1219. 10.2174/1871520614666140825112924. [DOI] [PubMed] [Google Scholar]
- Holzer P.; Masuya K.; Furet P.; Kallen J.; Valat-Stachyra T.; Ferretti S. S.; Berghausen J.; Le Bouisset-Leonard M.; Buschmann N.; Pissot-Soldermann C.; Rynn C.; Ruetz S.; Stutz S.; Chè Ne P.; Jeay S.; Gessier F. Discovery of a Dihydroisoquinolinone Derivative (NVP-CGM097): A Highly Potent and Selective MDM2 Inhibitor Undergoing Phase 1 Clinical Trials in P53wt Tumors. J. Med. Chem. 2015, 58, 6348–6358. 10.1021/acs.jmedchem.5b00810. [DOI] [PubMed] [Google Scholar]
- Sun D.; Li Z.; Rew Y.; Gribble M.; Bartberger M. D.; Beck H. P.; Canon J.; Chen A.; Chen X.; Chow D.; Deignan J.; Duquette J.; Eksterowicz J.; Fisher B.; Fox B. M.; Fu J.; Gonzalez A. Z.; Gonzalez-Lopez De Turiso F.; Houze J. B.; Huang X.; Jiang M.; Jin L.; Kayser F.; Liu J.; Lo M. C.; Long A. M.; Lucas B.; McGee L. R.; McIntosh J.; Mihalic J.; Oliner J. D.; Osgood T.; Peterson M. L.; Roveto P.; Saiki A. Y.; Shaffer P.; Toteva M.; Wang Y.; Wang Y. C.; Wortman S.; Yakowec P.; Yan X.; Ye Q.; Yu D.; Yu M.; Zhao X.; Zhou J.; Zhu J.; Olson S. H.; Medina J. C. Discovery of AMG 232, a Potent, Selective, and Orally Bioavailable MDM2-P53 Inhibitor in Clinical Development. J. Med. Chem. 2014, 57, 1454–1472. 10.1021/jm401753e. [DOI] [PubMed] [Google Scholar]
- Canon J.; Osgood T.; Olson S. H.; Saiki A. Y.; Robertson R.; Yu D.; Eksterowicz J.; Ye Q.; Jin L.; Chen A.; Zhou J.; Cordover D.; Kaufman S.; Kendall R.; Oliner J. D.; Coxon A.; Radinsky R. The MDM2 Inhibitor AMG 232 Demonstrates Robust Antitumor Efficacy and Potentiates the Activity of P53-Inducing Cytotoxic AgentsAMG 232 Regresses Tumors And. Mol. Cancer Ther. 2015, 14, 649–658. 10.1158/1535-7163.MCT-14-0710. [DOI] [PubMed] [Google Scholar]
- Al-Ghabkari A.; Narendran A. In Vitro Characterization of a Potent P53-MDM2 Inhibitor, RG7112 in Neuroblastoma Cancer Cell Lines. Cancer Biother.Radiopharm. 2019, 34, 252–257. 10.1089/CBR.2018.2732. [DOI] [PubMed] [Google Scholar]
- Sirous H.; Chemi G.; Campiani G.; Brogi S. An Integrated in Silico Screening Strategy for Identifying Promising Disruptors of P53-MDM2 Interaction. Comput. Biol. Chem. 2019, 83, 107105 10.1016/J.COMPBIOLCHEM.2019.107105. [DOI] [PubMed] [Google Scholar]
- Lemos A.; Gomes A. S.; Loureiro J. B.; et al. Synthesis, Biological Evaluation, and in Silico Studies of Novel Aminated Xanthones as Potential P53-Activating Agents. Molecules 2019, 24, 1975 10.3390/molecules24101975. [DOI] [PMC free article] [PubMed] [Google Scholar]
- Zhai K.; Siddiqui M.; Abdellatif B.; Liskova A.; Kubatka P.; Büsselberg D. Natural Compounds in Glioblastoma Therapy: Preclinical Insights, Mechanistic Pathways, and Outlook. Cancers 2021, 13, 2317 10.3390/CANCERS13102317. [DOI] [PMC free article] [PubMed] [Google Scholar]
- Rehman S.; Khan H. Advances in Antioxidant Potential of Natural Alkaloids. Curr. Bioact. Compd. 2017, 13, 101–108. 10.2174/1573407212666160614075157. [DOI] [Google Scholar]
- Cos S.; Sánchez-Barceló E. J. Melatonin Inhibition of MCF-7 Human Breast-Cancer Cells Growth: Influence of Cell Proliferation Rate. Cancer Lett. 1995, 93, 207–212. 10.1016/0304-3835(95)03811-A. [DOI] [PubMed] [Google Scholar]
- Proietti S.; Cucina A.; Dobrowolny G.; D’Anselmi F.; Dinicola S.; Masiello M. G.; Pasqualato A.; Palombo A.; Morini V.; Reiter R. J.; Bizzarri M. Melatonin Down-Regulates MDM2 Gene Expression and Enhances P53 Acetylation in MCF-7 Cells. J. Pineal Res. 2014, 57, 120–129. 10.1111/JPI.12150. [DOI] [PubMed] [Google Scholar]
- Inada M.; Shindo M.; Kobayashi K.; Sato A.; Yamamoto Y.; Akasaki Y.; Ichimura K.; Tanuma S. I. Anticancer Effects of a Non-Narcotic Opium Alkaloid Medicine, Papaverine, in Human Glioblastoma Cells. PLoS One 2019, 14, e0216358 10.1371/JOURNAL.PONE.0216358. [DOI] [PMC free article] [PubMed] [Google Scholar]
- Gavaraskar K.; Dhulap S.; Hirwani R. R. Therapeutic and Cosmetic Applications of Evodiamine and Its Derivatives—A Patent Review. Fitoterapia 2015, 106, 22–35. 10.1016/J.FITOTE.2015.07.019. [DOI] [PubMed] [Google Scholar]
- Jiang J.; Hu C. Evodiamine: A Novel Anti-Cancer Alkaloid from Evodia Rutaecarpa. Molecules 2009, 14, 1852–1859. 10.3390/MOLECULES14051852. [DOI] [PMC free article] [PubMed] [Google Scholar]
- Liu A. J.; Wang S. H.; Chen K. C.; Kuei H. P.; Shih Y. L.; Hou S. Y.; Chiu W. T.; Hsiao S. H.; Shih C. M. Evodiamine, a Plant Alkaloid, Induces Calcium/JNK-Mediated Autophagy and Calcium/Mitochondria-Mediated Apoptosis in Human Glioblastoma Cells. Chem. Biol. Interact. 2013, 205, 20–28. 10.1016/J.CBI.2013.06.004. [DOI] [PubMed] [Google Scholar]
- Liang Z.; Wang Y.; Zhang H.; Deng J.; Lei F.; Li J.; Shi T.; Wang S.; Li R.; Wang Z. Design, Synthesis and Bioactivity Evaluation of Favorable Evodiamine Derivative Scaffold for Developing Cancer Therapy. Eur. J. Med. Chem. 2022, 239, 114530 10.1016/J.EJMECH.2022.114530. [DOI] [PubMed] [Google Scholar]
- Choi W. Y.; Kim G. Y.; Lee W. H.; Choi Y. H. Sanguinarine, a Benzophenanthridine Alkaloid, Induces Apoptosis in MDA-MB-231 Human Breast Carcinoma Cells through a Reactive Oxygen Species-Mediated Mitochondrial Pathway. Chemotherapy 2008, 54, 279–287. 10.1159/000149719. [DOI] [PubMed] [Google Scholar]
- Du H.; Peng Q.; Gu J.; Qiu P.; Liu L.; Du B.; Jiang Y.; Tan Y. Effect of Evodiamine on Cancer Metabolism of Liver Tumor Through Met/EGFR and HIF Pathways. SSRN Electron. J. 2022, 0, 29 10.2139/SSRN.4095315. [DOI] [Google Scholar]
- Mohan V.; Agarwal R.; Singh R. P. A Novel Alkaloid, Evodiamine Causes Nuclear Localization of Cytochrome-c and Induces Apoptosis Independent of P53 in Human Lung Cancer Cells. Biochem. Biophys. Res. Commun. 2016, 477, 1065–1071. 10.1016/J.BBRC.2016.07.037. [DOI] [PubMed] [Google Scholar]
- Han S.; Woo J. K.; Jung Y.; Jeong D.; Kang M.; Yoo Y. J.; Lee H.; Oh S. H.; Ryu J. H.; Kim W. Y. Evodiamine Selectively Targets Cancer Stem-like Cells through the P53-P21-Rb Pathway. Biochem. Biophys. Res. Commun. 2016, 469, 1153–1158. 10.1016/J.BBRC.2015.12.066. [DOI] [PubMed] [Google Scholar]
- Basu P.; Kumar G. S.. Sanguinarine and Its Role in Chronic Diseases. In Anti-inflammatory Nutraceuticals and Chronic Diseases; Springer, 2016; pp 155–172. [DOI] [PubMed] [Google Scholar]
- Zhang B.; Wang X.; Deng J.; Zheng H.; Liu W.; Chen S.; Tian J.; Wang F. P53-Dependent Upregulation of MiR-16-2 by Sanguinarine Induces Cell Cycle Arrest and Apoptosis in Hepatocellular Carcinoma. Cancer Lett. 2019, 459, 50–58. 10.1016/J.CANLET.2019.05.042. [DOI] [PubMed] [Google Scholar]
- Han M. H.; Kim S. O.; Kim G. Y.; Kwon T. K.; Choi B. T.; Lee W. H.; Choi Y. H. Induction of Apoptosis by Sanguinarine in C6 Rat Glioblastoma Cells Is Associated with the Modulation of the Bcl-2 Family and Activation of Caspases through Downregulation of Extracellular Signal-Regulated Kinase and Akt. Anticancer Drugs 2007, 18, 913–921. 10.1097/CAD.0B013E328117F463. [DOI] [PubMed] [Google Scholar]
- Ghauri M. A.; Su Q.; Ullah A.; Wang J.; Sarwar A.; Wu Q.; Zhang D.; Zhang Y. Sanguinarine Impedes Metastasis and Causes Inversion of Epithelial to Mesenchymal Transition in Breast Cancer. Phytomedicine 2021, 84, 153500 10.1016/J.PHYMED.2021.153500. [DOI] [PubMed] [Google Scholar]
- Pallichankandy S.; Rahman A. ROS-dependent activation of autophagy is a critical mechanism for the induction of anti-glioma effect of sanguinarine. Free Radical Biol. Med. 2015, 89, 708–720. 10.1016/j.freeradbiomed.2015.10.404. [DOI] [PubMed] [Google Scholar]
- Kulikov R.; Letienne J.; Kaur M.; Grossman S. R.; Arts J.; Blattner C. Mdm2 Facilitates the Association of P53 with the Proteasome. Proc. Natl. Acad. Sci. U.S.A. 2010, 107, 10038–10043. 10.1073/PNAS.0911716107. [DOI] [PMC free article] [PubMed] [Google Scholar]
- Zhang X.; Gu L.; Li J.; Shah N.; He J.; Yang L. Degradation of MDM2 by the Interaction between Berberine and DAXX Leads to Potent Apoptosis in MDM2-Overexpressing Cancer Cells. Cancer Res. 2010, 73, 9895–9904. 10.1158/0008-5472.can-10-1546. [DOI] [PMC free article] [PubMed] [Google Scholar]
- Zhou N.; Li J.; Li T. Matrine-induced Apoptosis in Hep3B Cells via the Inhibition of MDM2. Mol. Med. Rep. 2017, 15, 442–450. 10.3892/mmr.2016.5999. [DOI] [PubMed] [Google Scholar]
- Brew C. T.; Aronchik I.; Hsu J. C.; Sheen J.-H.; Dickson R. B.; Bjeldanes L. F.; Firestone G. L. Indole-3-carbinol activates the ATM signaling pathway independent of DNA damage to stabilize p53 and induce G1 arrest of human mammary epithelial cells. Int. J. Cancer 2006, 118, 857–868. 10.1002/ijc.21445. [DOI] [PubMed] [Google Scholar]
- Patil S. P.; Pacitti M. F.; Gilroy K. S.; Ruggiero J. C.; Griffin J. D.; Butera J. J.; Notarfrancesco J. M.; Tran S.; Stoddart J. W. Identification of Antipsychotic Drug Fluspirilene as a Potential P53-MDM2 Inhibitor: A Combined Computational and Experimental Study. J. Comput. Aided. Mol. Des. 2015, 29, 155–163. 10.1007/s10822-014-9811-6. [DOI] [PubMed] [Google Scholar]
- Clough E.; Barrett T. The Gene Expression Omnibus Database. Methods Mol. Biol. 2016, 1418, 93–110. 10.1007/978-1-4939-3578-9_5. [DOI] [PMC free article] [PubMed] [Google Scholar]
- Kim S.; Thiessen P. A.; Bolton E. E.; Chen J.; Fu G.; Gindulyte A.; Han L.; He J.; He S.; Shoemaker B. A.; Wang J.; Yu B.; Zhang J.; Bryant S. H. PubChem Substance and Compound Databases. Nucleic Acids Res. 2016, 44, D1202–D1213. 10.1093/NAR/GKV951. [DOI] [PMC free article] [PubMed] [Google Scholar]
- Daina A.; Michielin O.; Zoete V. SwissADME: A Free Web Tool to Evaluate Pharmacokinetics, Drug-Likeness and Medicinal Chemistry Friendliness of Small Molecules. Sci. Rep. 2017, 7, 42717 10.1038/srep42717. [DOI] [PMC free article] [PubMed] [Google Scholar]
- Kochnev Y.; Hellemann E.; Cassidy K. C.; Durrant J. D. Webina: An Open-Source Library and Web App That Runs AutoDock Vina Entirely in the Web Browser. Bioinformatics 2020, 36, 4513–4515. 10.1093/BIOINFORMATICS/BTAA579. [DOI] [PMC free article] [PubMed] [Google Scholar]
- Pawar S. S.; Rohane S. H. Review on Discovery Studio: An Important Tool for Molecular Docking. Asian J. Res. Chem. 2021, 14, 1–3. 10.5958/0974-4150.2021.00014.6. [DOI] [Google Scholar]
- Daniele S.; Costa B.; Zappelli E.; da Pozzo E.; et al. Combined Inhibition of AKT/MTOR and MDM2 Enhances Glioblastoma Multiforme Cell Apoptosis and Differentiation of Cancer Stem Cells. Sci. Rep. 2015, 5, 9956 10.1038/srep09956. [DOI] [PMC free article] [PubMed] [Google Scholar]
- Kubbutat M. H. G.; Jones S. N.; Vousden K. H. Regulation of P53 Stability by Mdm2. Nature 1997, 387, 299–303. 10.1038/387299A0. [DOI] [PubMed] [Google Scholar]
Associated Data
This section collects any data citations, data availability statements, or supplementary materials included in this article.