Abstract
Heart failure (HF) is a leading cause of mortality. Failing hearts undergo profound metabolic changes, but a comprehensive evaluation in humans is lacking. We integrate plasma and cardiac tissue metabolomics of 678 metabolites, genome-wide RNA-sequencing, and proteomic studies to examine metabolic status in 87 explanted human hearts from 39 patients with end-stage HF compared with 48 nonfailing donors. We confirm bioenergetic defects in human HF and reveal selective depletion of adenylate purines required for maintaining ATP levels. We observe substantial reductions in fatty acids and acylcarnitines in failing tissue, despite plasma elevations, suggesting defective import of fatty acids into cardiomyocytes. Glucose levels, in contrast, are elevated. Pyruvate dehydrogenase, which gates carbohydrate oxidation, is de-repressed, allowing increased lactate and pyruvate burning. Tricarboxylic acid cycle intermediates are significantly reduced. Finally, bioactive lipids are profoundly reprogrammed, with marked reductions in ceramides and elevations in lysoglycerophospholipids. These data unveil profound metabolic abnormalities in human failing hearts.
Despite major treatment advances made over the past 40 years, HF continues to be a major health and economic burden worldwide. HF is a leading cause of death in the United States of America and the leading cause of hospital admissions in patients aged >65 years1. The 5-year mortality rate for patients with HF remains at ~50%2,3. Neurohormonal blockade has been the mainstay of HF management for decades, but the limits of its benefits have probably been reached. Development of therapies addressing new pathways is in dire need.
Mounting evidence indicates that the failing heart is an ‘engine out of fuel’ which fails to use energy substrates appropriately to satisfy its metabolic demands. In the failing human heart, high-energy phosphate levels are reduced by as much as 40%, via mechanisms still incompletely understood4,5. The subject of metabolic reprogramming in HF has undergone intense study for decades and metabolic interventions have long been proposed as new therapies for HF. However, our understanding of metabolic reprogramming in HF remains incomplete and effective metabolic therapies have not yet been achieved.
Recently, several conceptual and technical breakthroughs, including advances in mass spectrometry (MS) technology, have created new opportunities to study metabolism more deeply in HF. For example, studies evaluating plasma of patients with HF have identified new prognostic biomarkers of HF, including most notably the elevation of acylcarnitines6,7. Similarly, we recently used these techniques on plasma from the artery and coronary sinus of 110 patients, providing a comprehensive quantification of fuel use by the failing and nonfailing human heart8. These studies have provided a rich source of information about plasma metabolites, and exchange between cardiac tissue and plasma, but have not adequately examined human cardiac tissue as such. We therefore performed comprehensive metabolomic analyses on tissues and plasma from 87 explanted hearts of 39 patients with end-stage HF undergoing cardiac transplantation and 48 nonfailing hearts obtained from organ donors. We integrate these metabolomics data with, when available, matched RNA-sequencing (RNA-seq) data and proteomics data to provide a detailed depiction of the metabolic landscape of human HF. We wish to highlight that these depictions are not definitive demonstrations of causality or metabolic flux, because we measured static pool sizes. Where possible, we also consider these metabolomics data in light of our recent quantification of arteriovenous changes in metabolites8, which do reflect metabolic flux.
Results and discussion
Cardiac and plasma metabolic alterations in human HF.
We evaluated hearts from two cohorts of subjects (Extended Data Table 1). The first consisted of 18 patients with end-stage, nonischemic, dilated cardiomyopathy (DCM) undergoing cardiac transplantation, and a control group of 18 donors with ejection fraction (EF) >50 on an echocardiograph, matched for age, race and sex. There were four black men, five white men, four black women and five white women in each group. Patients with diabetes or left ventricular assist devices (LVADs) were excluded9–11. Three failing and ten nonfailing patients had matched plasma samples available. The second cohort consisted of an additional 21 patients with DCM and an additional 30 nonfailing donors, all of whom also had plasma available. There were no significant differences in race, age, sex, weight, height or body mass index between groups in either cohort (Extended Data Table 1). Echocardiographic parameters reflected end-stage DCM in the failing cases and preserved cardiac function in the control groups (Extended Data Table 1).
A critical aspect of our metabolomic studies was the careful and systematic protocol of cardioprotective harvests, thus minimizing metabolic changes during harvest. This protocol consisted of in situ perfusion with ice-cold cardioplegia solution employed in human heart surgery and organ procurements, prompt explantation, continuous cooling and transport to the lab for freezing (<4 h cold ischemic time) (Fig. 1a). Left ventricular (LV) tissue samples and plasma samples were then subjected to comprehensive metabolomics, using liquid chromatography–MS (LC–MS), on two different occasions, one for each cohort, separated by 6 months. More than 500 metabolites were detected with confidence in each tissue cohort and >450 metabolites were detected in plasma; 307 metabolites were significantly altered in at least one tissue cohort (fasle discovery rate (FDR) < 0.05), and 73 were significantly altered in both cohorts (Supplementary Table 1). In plasma, 144 metabolites were altered in at least one cohort and 8 metabolites were significantly altered in both plasma cohorts (Supplementary Table 2). There was strong concordance in the quantified fold-change in both cases in tissue (R2 = 0.57 and 0.89, respectively; Extended Data Fig. 1a and Fig. 1b) and in plasma (R2 = 0.49 and R2 = 0.86, respectively; Extended Data Fig. 1b,c), underscoring the high reproducibility of the approach.
Fig. 1 |. Cardiac and plasma metabolic alterations in human HF.
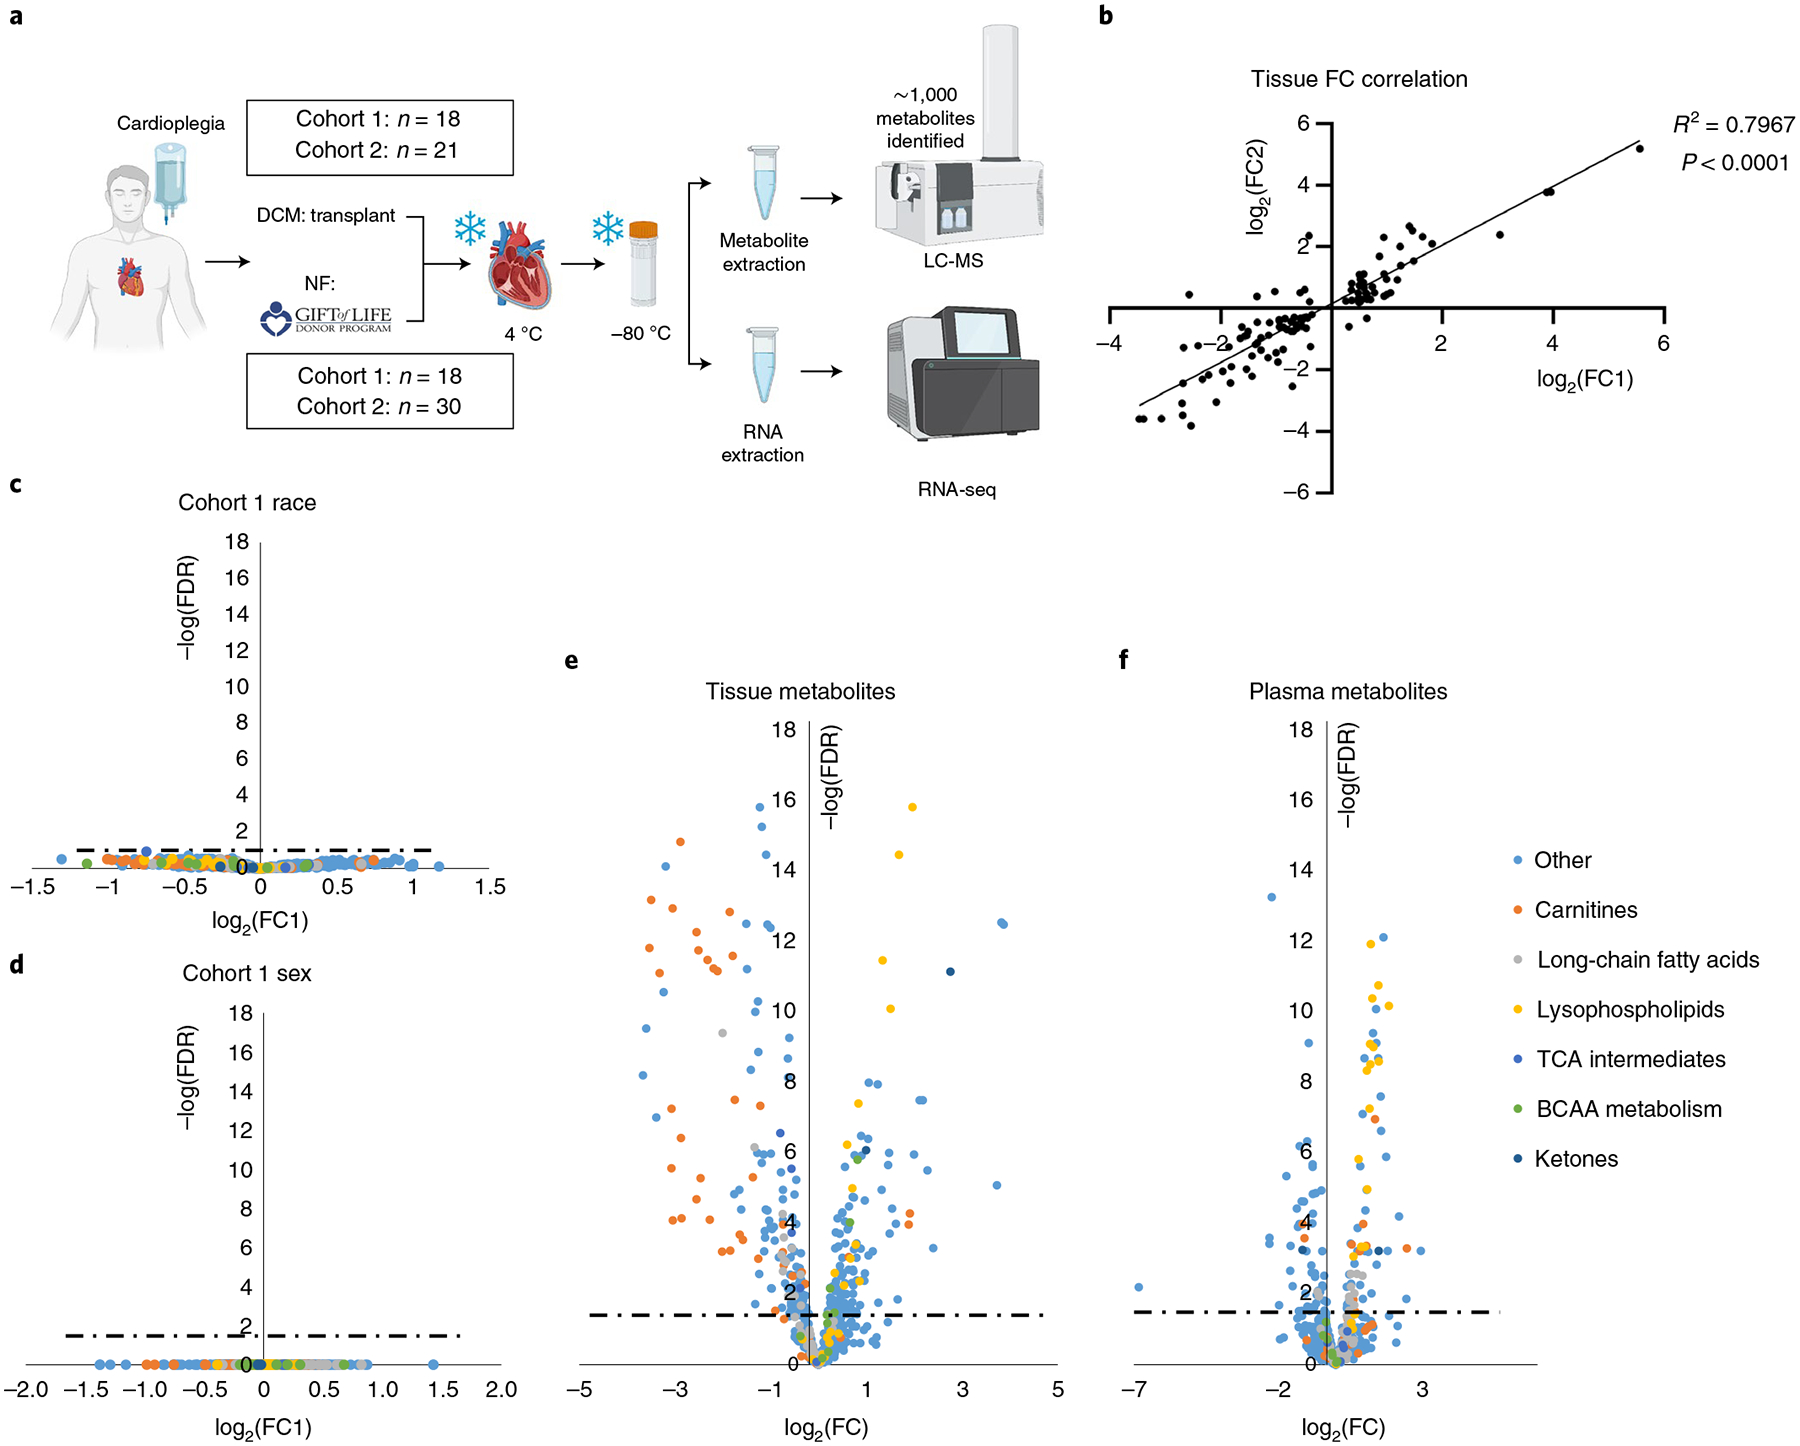
a, Overview of sample procurement and experimental design. b, Correlation between cohorts 1 and 2 of fold-changes (FCs) between nonfailing and failing samples of metabolites significantly altered by two-sided Student’s t-test (FDR < 0.05) in both tissue cohorts. c,d, Volcano plot of racial (c) and sex (d) differences in metabolite abundance in nonfailing tissue samples from cohort 1. Fold-changes were calculated as an average value for black patients divided by that of white patients (c) or an average value for female patients over that of male patients (d). Dotted lines represent the threshold of statistical significance (FDR). e,f, Volcano plots of differences in metabolite abundance in cardiac tissue (e) and plasma (f) from combined cohorts, comparing nonfailing with failing samples. Panel a created with BioRender.com
Cohort 1 was case controlled and specifically designed to test whether metabolic differences could be detected between races or between sexes. However, neither principal component analysis (PCA) nor a similarity matrix indicated notable clustering along race or sex (Extended Data Fig. 1d–f). In contrast, nonfailing and DCM hearts segregated distinctly (Extended Data Fig. 1g) and showed high similarity by group (Extended Data Fig. 1d). Direct comparison of metabolite content between white and black, or men versus women, revealed no significant differences (Fig. 1c,d). We concluded that sex and race do not greatly affect metabolic profile in comparison to the profound changes seen in end-stage DCM (it is important to note that these data are in end-stage HF and the data should not be used to justify no longer examining the impact of sex and race on HF progression). In light of this fact, and of the high concordance between measurements in our two cohorts of subjects (Fig. 1b and Extended Data Fig. 1a–c), we combined datasets for all subsequent evaluations (Supplementary Tables 1 and 2). Volcano plots of the combined dataset revealed numerous highly significant metabolic alterations in DCM in both tissue and plasma, with a Padj value reaching well below 10−10 (Fig. 1e,f).
To provide a more comprehensive picture of each metabolic pathway, we combined the metabolomics data with genome-wide RNA-seq expression data, derived from a subset of the same hearts analyzed above (n = 17 nonfailing and 14 DCM hearts), as well as previously published whole-tissue proteomics data, also derived from a subset of the hearts above (n = 7 nonfailing and 6 DCM hearts)12 (see also Supplementary Tables 3 and 4). Global evaluation of the RNA-seq dataset revealed strong separation of nonfailing from DCM groups, by both PCA and similarity matrix (Extended Data Fig. 2a,b). Gene expression was dramatically different between nonfailing (NF) and DCM groups (Extended Data Fig. 2c). Comparison of significantly altered genes (FDR P < 0.05) with a previously published dataset13 revealed close concordance (Extended Data Fig. 2d; R2 = 0.68). Below, we integrate these data with the metabolomics data above and discuss major observations, organized by metabolic pathway.
Loss of adenylate purines and high-energy molecules in HF.
First, we note that the energy charge of DCM hearts is low compared with NF hearts (Fig. 2a). This is reflected in lower total ATP levels (33% reduction, FDR = 9 × 10⁻⁴), total phosphocreatine (PCr) levels (55% reduction, FDR = 2.7 × 10⁻³), PCr:Cr ratio (0.65), PCr:ATP ratio (0.63) and ATP:ADP ratio (0.59) (Fig. 2a,b). Total creatine levels are also reduced by ~35%, as has been recognized since 1939 (ref.14) and this has been interpreted as an adaptive response to maintain ATP:ADP ratios, via the creatine kinase reaction, in the face of declining ability to regenerate ATP via oxidative phosphorylation15. Numerous 31P magnetic resonance spectroscopy studies in the 1980s showed reduced cardiac PCr:ATP ratios in patients with DCM, which correlated with the New York Heart Association class, EJ and prognosis16,17. Our observations are consistent with these previous studies.
Fig. 2 |. Loss of adenylate purines and high-energy phosphate molecules in HF.
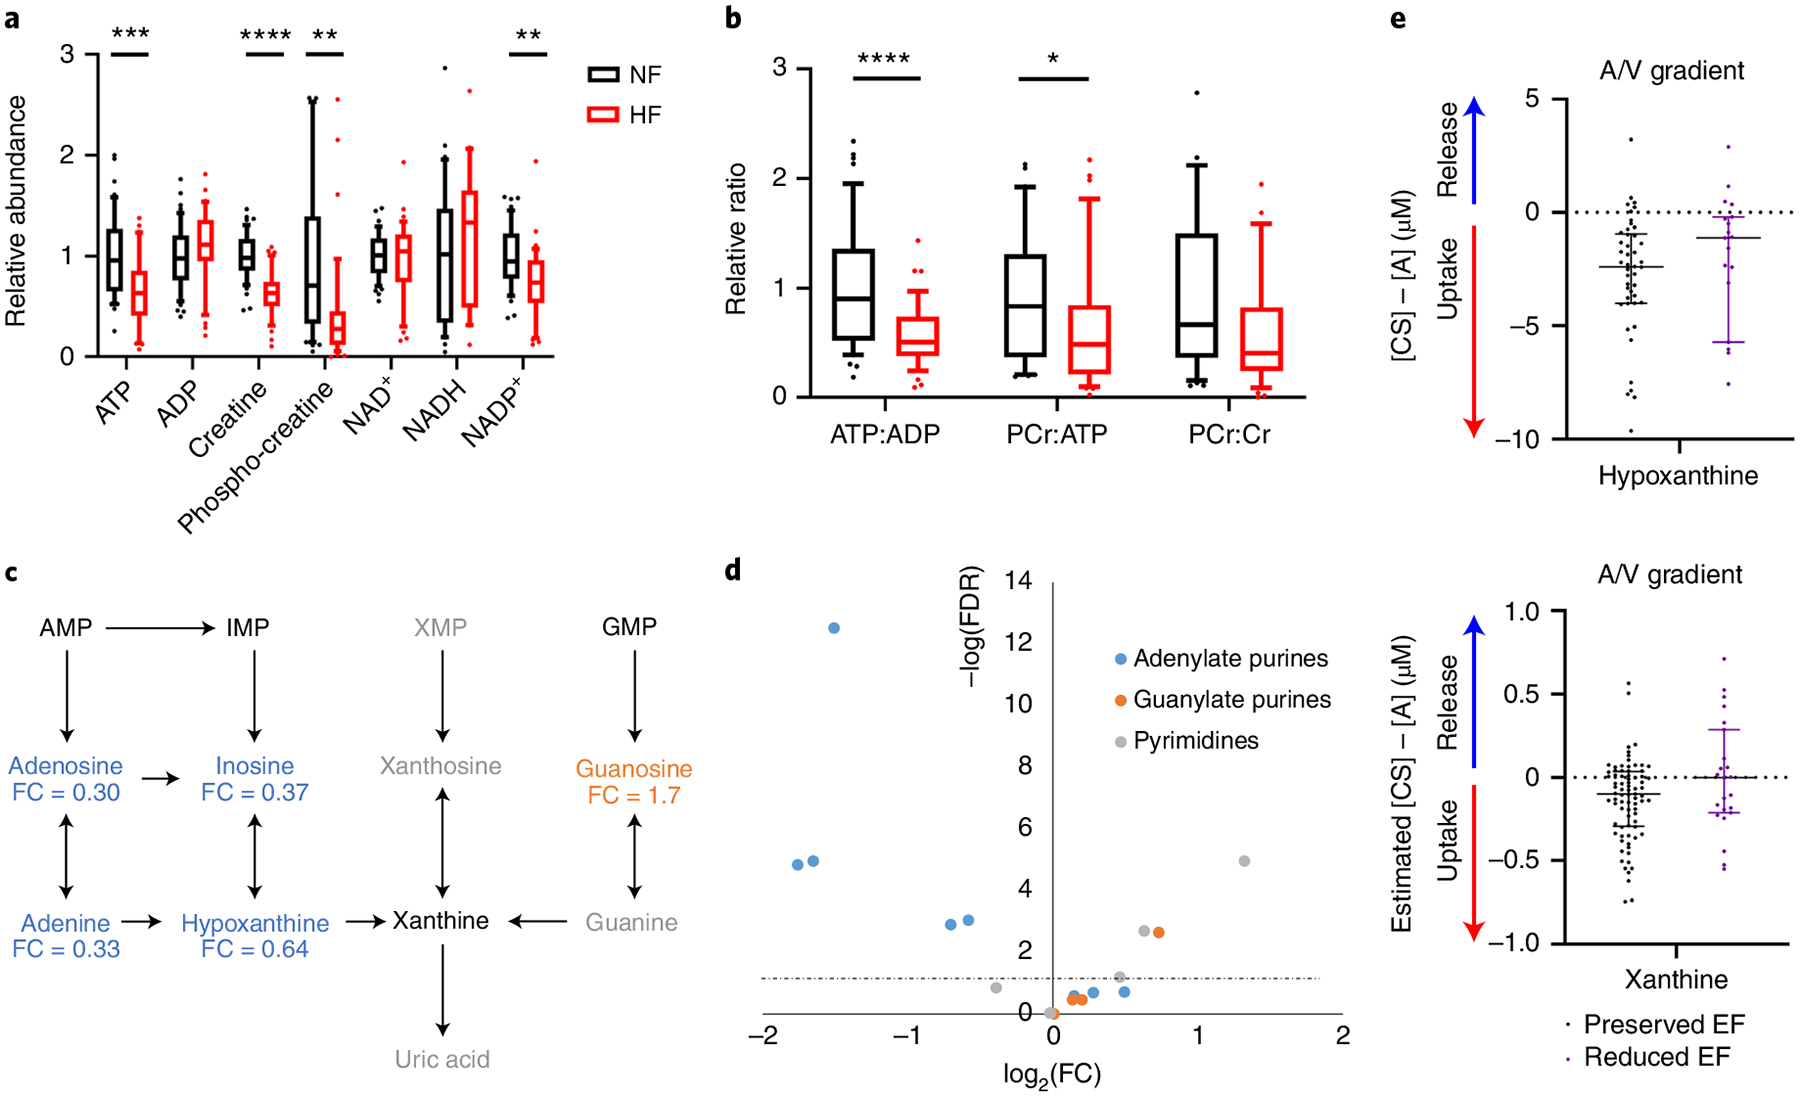
a,b, Relative abundance (a) and ratios (b) of metabolites involved in high-energy phosphate transfers in cardiac tissue from NF donors (n = 48) or subjects with HF (n = 39). The whiskers represent the 10th and 90th percentiles, the midline represents the median, the edges of boxes represent the first and third quartiles and points represent data points outside the 10th–90th percentile range. *P < 0.05, **P < 0.01, ***P < 0.001, ****P < 0.0001. FDR-corrected (a) or nominal (b) P values were determined by two-tailed Student’s t-test. (ATP FDR = 0.000904; ADP FDR = 0.258; creatine FDR = 7.01 × 10⁻⁹; PCr FDR = 0.00268; NAD+ FDR = 0.787; NADH FDR = 0.463; NADP+ FDR = 0.00167; ATP:ADP P = 1.9 × 10⁻⁵; PCr:ATP P = 0.0458; PCr:Cr P = 0.0556). c, Purine degradation pathway. Blue text indicates significantly reduced in failing cardiac tissue and orange significantly elevated in failing cardiac tissue. Fold-change is indicated below each metabolite. Gray text indicates not detected. Significance based on FDR-corrected, two-tailed Student’s t-test (n = 48 NF and n = 39 HF samples). d, Volcano plot of nucleotides, nucleosides, bases and their intermediates from all tissue samples. Fold-change was calculated as the average for NF samples divided by the average of failing samples. P values are FDR-corrected, two-tailed Student’s t-test. The dotted line represents the threshold of statistical significance. A/V, arteriovenous. e, Transcoronary gradient concentrations (artery to coronary sinus) of hypoxanthine and xanthine in human patients with preserved (n = 81) versus reduced (n = 23) EF. Negative values indicate uptake of metabolite into the heart and positive values indicate release of metabolite from the heart. The lines represent the median and interquartile range (IQR). Two outliers in each graph are not shown. AMP, adenosine monophosphate; IMP, inosine monophosphate; XMP, xanthosine monophosphate; GMP, guanosine monophosphate.
Reduced ATP, an adenylate purine, was only one of many changes in nucleotide metabolism seen in the failing hearts We observed dramatic reductions in the concentrations of nearly all adenylate purines in failing myocardium (Fig. 2c,d and Extended Data Fig. 3a): adenine by 67%, adenosine by 70%, inosine by 63%, hypoxanthine by 36% and ATP (the largest contributor to the purine pool) by 32%. In contrast, guanosine, which is also a purine, is increased by 70% and pyrimidine derivatives are either unchanged or increased, indicating a specific depletion of adenylate purines (Fig. 2c,d and Extended Data Fig. 3b,c). Purine depletion has been noted in human and nonhuman ischemic myocardium15, as well as in the pacing-induced canine model of HF18, but the mechanism of purine loss, in particular in the nonischemic setting, remains unclear. Protein expressions of isoforms of cytosolic 5′,3′-nucleotidase (NT5C1A and NT5C2), gatekeepers of AMP and IMP degradation, are unaltered in failing hearts (Supplementary Table 4), suggesting that, if there is increased purine degradation, it occurs via allosteric effects. Extracellular secretion of adenosine, the product of this reaction, is an important component of coronary vascular regulation and secreted adenosine can be deaminated to inosine via extracellular adenosine deaminase. We found inosine to be more than doubled in plasma from patients with failing hearts (2.3-fold, FDR = 0.058; Supplementary Table 2), consistent with a loss of adenosine and inosine from cardiac tissue. Also potentially contributing to purine loss, the purine salvage may be diminished, because xanthine and hypoxanthine are normally taken up by the heart, and this process appears to be blunted in HF (Fig. 2e)8. Consistent with this notion, we found protein expression of adenine phosphoribosyltransferase, which catalyzes adenine salvage to AMP, to be suppressed by 29% (FDR = 0.08) in failing hearts (Extended Data Fig. 3d). Finally, although a relatively slow process compared with the salvage pathway, de novo purine synthesis may also be affected, because expression of most genes of purine synthesis was suppressed (PPAT, GART, PFAS, PAICS, ADSL, ATIC; Extended Data Fig. 3d,e).
Defective FA transport and oxidation in HF.
Why is the energy charge low in DCM hearts? Cardiac tissue uses fatty acids (FAs) as its primary fuel source, via the fatty acid oxidation (FAO) pathway (Fig. 3a). FA content was decreased in DCM hearts (Fig. 3b and Extended Data Fig. 4a). In contrast, FA content in plasma was higher in patients with DCM (Extended Data Fig. 4b), demonstrating that the low tissue FA content is not a consequence of reduced availability. Similarly, acylcarnitines were almost all substantially reduced in hearts (Fig. 3c and Extended Data Fig. 4c), as we have previously reported19, while also being increased in plasma (Extended Data Fig. 4d) from patients with DCM. Acyl-CoA species have also been reported to be reduced in cardiac tissue from patients with end-stage HF and this was reversed by implantation of an LVAD20. Similarly, we find in the present study significant reductions in short-chain hexanoyl-CoA and butyryl-CoA, the almost end-products of FAO (Fig. 3h and Supplementary Table 5). Elevations of plasma acylcarnitines have been reported previously6,7 and are often interpreted as indicating a defect in cardiac FAO, leading to buildup of acylcarnitine intermediates. Our observed low tissue acylcarnitines and low FA levels strongly argue against this latter conclusion because a defect in FAO would be predicted to lead to a buildup of these intermediates in the cardiac tissue. Moreover, we have recently shown, using simultaneous blood sampling from arterial and coronary sinus catheters in patients undergoing elective percutaneous procedures, that neither the nonfailing nor the failing heart secretes acylcarnitines8. The data thus point instead to a possible defect of FA import in DCM. RNA-seq and proteomic analyses are consistent with this conclusion: although some genes of FAO are reduced in DCM hearts (Fig. 3d,e), the carnitine palmitoyl transport proteins (CPT1A, CPT1B and CPT2), which generate acylcarnitines and are considered the rate-limiting steps of FAO, are not suppressed (Fig. 3f,g) (despite some suppression of CPT1A gene expression, Fig. 3f). Moreover, levels of malonyl-CoA, a potent allosteric inhibitor of CPT1, are unaltered in failing hearts (Fig. 3h and Supplementary Table 5).
Fig. 3 |. Evidence of defective FA transport and FAO in failing hearts.
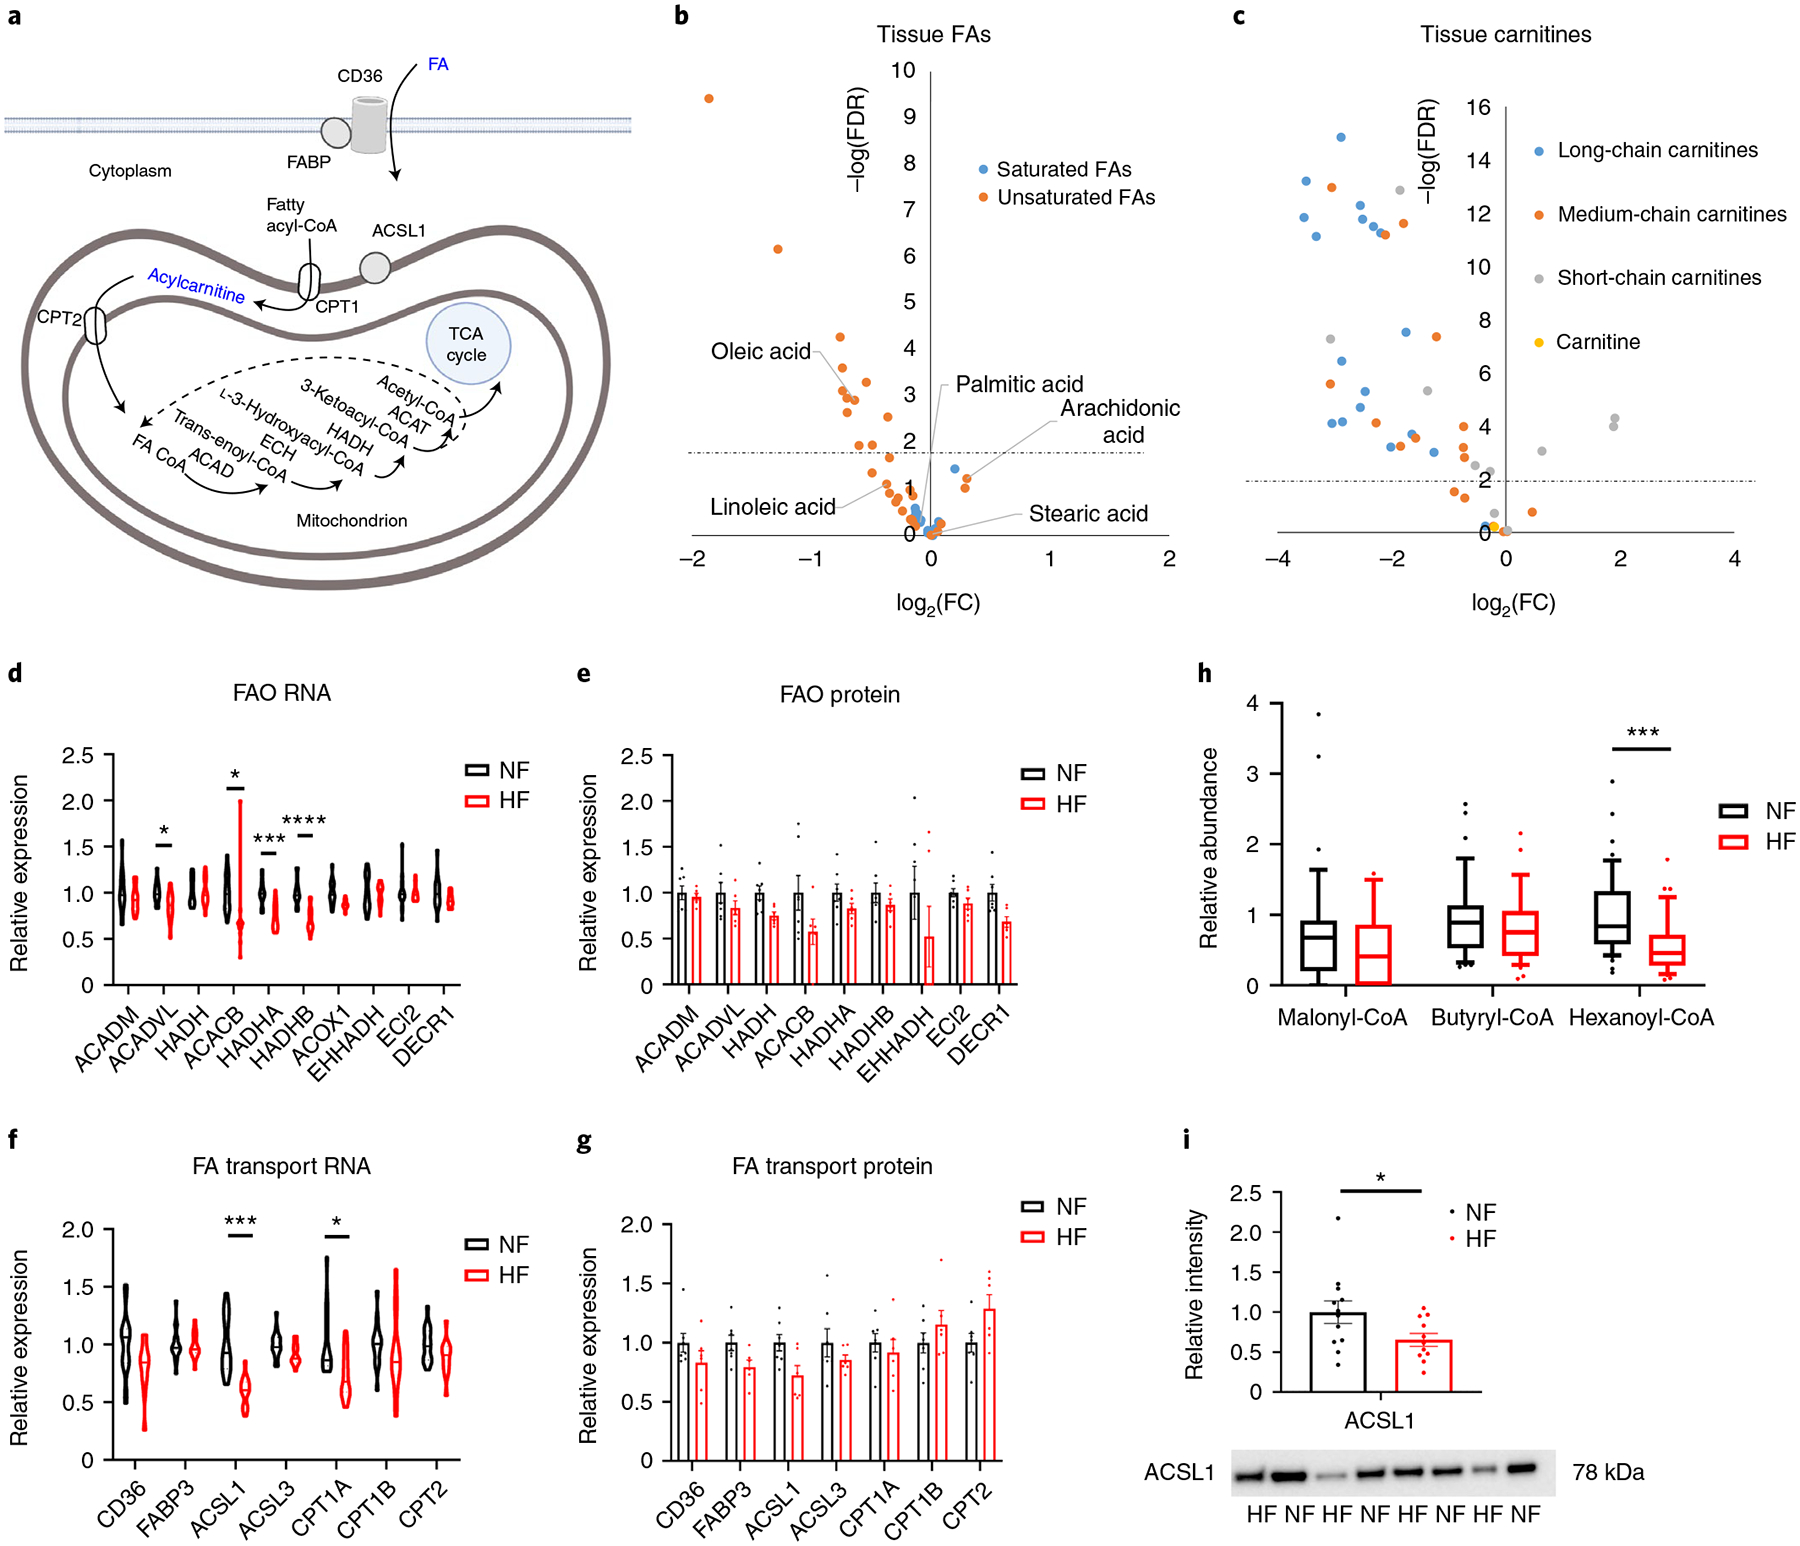
a, Schematic of FA import and FAO. Blue text indicates a molecule or family of molecules that is reduced in HF. Created with BioRender.com FABP, FA-binding protein. b,c, Volcano plot of differences in FA (b) or carnitine (c) abundance in cardiac tissue, comparing nonfailing (NF) with failing (HF) samples. d,e, Relative mRNA (d) and protein (e) expression of FAO genes. Bars represent mean and s.e.m. (n = 7 NF and n = 6 HF). Significant P values from d are as follows: ACADVL FDR = 0.0194; ACACB FDR = 0.0433; HADHA FDR = 0.000164; HADHB FDR = 4.2 × 10⁻⁵. f,g, Relative mRNA (f) and protein (g) expression of FA transport genes. Bars represent mean and s.e.m. (n = 7 NF and n = 6 HF). Significant P values for f are as follows: ACSL1 FDR = 0.000114; CPT1A FDR = 0.0194. h, Relative abundance of indicated coenzyme A species in tissue samples (n = 47 NF and n = 35 HF). The whiskers represent the 10th and 90th percentiles, the midline represents the median, the edges of boxes represent the first and third quartiles and the points represent data points outside the 10th–90th percentile range. Hexanoyl-CoA P = 0.000183. i, Quantification of ACSL1 protein by western blotting, with representative image of eight failing and NF tissues, shown below (see Extended Data Fig. 4 for full blot). Bars represent mean and s.e.m. (n = 12 NF and n = 11 HF). ACSL1 western blot P = 0.0475. *P < 0.05, **P < 0.01, ***P < 0.001, ****P < 0.0001. P values were determined by FDR-corrected, two-tailed Student’s t-test, except h, which uses a nominal P value.
In contrast, expression of acyl-CoA synthase 1 (ACSL1), probably a primary driver of FA import into cardiomyocytes21–23, is reduced 40% at the RNA level (P < 0.01) and the protein level (P < 0.05) (Fig. 3f–g,i and Extended Data Fig. 4f). Recent work in rodents has suggested that cardiac over-expression of ACLS1 can protect from hemodynamic stress-induced HF20. Reduced ACSL1 may thus in part explain lower consumption of FAs, but it would not explain the observed lower levels of free FAs. Thus, taken together, these data are most consistent with a defect in FA import, possibly in part at the level of ACLS1-mediated CoA ligation.
It is of interest that unsaturated FAs, including the abundant C16:1, C18:1 and C18:2 species, are more highly suppressed than are saturated FAs in DCM hearts (Fig. 3b and Extended Data Fig. 4a). This observation could reflect disproportional influx of some FA species over others, although blood sampling from the artery and coronary sinus in patients with HF does not indicate favored uptake of saturated FAs8. Altered desaturation of saturated FAs is also not likely to explain this observation, because linoleic acid (C18:2), for example, is an essential FA that cannot be derived from precursors in humans. Gene and protein expression of enzymes specifically required for unsaturated FAO (for example, ECI2, DECR1) also do not suggest higher oxidation of unsaturated FAs (Fig. 3d,e). The only relatively abundant FA species that is induced in DCM is arachidonic acid (C20:4) (Fig. 3b), precursor to prostaglandins and other eicosanoids, which has been linked to inflammation and coagulation. It is interesting that C20:4-CoA and C20:4-carnitine have previously been shown to be reduced, rather than increased, in HF samples19,20. Also of interest, long-chain acylcarnitines were markedly more suppressed in DCM hearts than were short-chain acylcarnitines (Fig. 3c and Extended Data Fig. 4c), probably reflecting that short-chain acylcarnitines are derived from sources other than FAO, for example, branched-chain amino acid (BCAA) oxidation (see below). Carnitine abundance itself was not different between nonfailing and DCM hearts (Fig. 3c).
Defects in glycolysis and increased lactate oxidation in HF.
Carbohydrates are the other major source of reducing equivalents in the heart (Fig. 4a). HF is widely thought to be accompanied by a partial shift from FAO to glucose uptake, although uncertainty exists on the extent to which glucose is oxidized in different stages and etiologies of HF24,25. Our data show that, at least in end-stage nonischemic HF, the abundance of detected intermediates of glycolysis, as well as offshoots of the glycolytic pathway including the pentose phosphate pathway, glycogen synthesis and serine/glycine synthesis, tended to be lower, with many reductions achieving statistical significance (Fig. 4b). This observation suggests that glycolytic flux in cardiomyocytes, whether or not increased, is not sufficient to maintain these intermediate pools normally filled. Such insufficiency could be caused by two situations that are not mutually exclusive: a block at the level of glucose influx into glycolysis (that is, a reduction of glycolytic flux) or a high consumption of pyruvate that outpaces the rate of glycolysis (that is, relative increase in glucose oxidation). We find circumstantial evidence for both processes in DCM. First, with respect to entry of glucose into glycolysis, we find evidence for a possible block at hexokinase (HK). Glucose enters cardiomyocytes primarily via GLUT1 (SLC2A1) and GLUT4 (SLC2A4) and possibly also SGLT1, and we find that, although gene expression of GLUT1 is suppressed in failing hearts (Extended Data Fig. 5a) and protein expression of GLUT1 has been noted previously to be reduced in failing human hearts26, neither GLUT1 nor GLUT4 protein was significantly altered in our DCM cohort (Extended Data Fig. 5b). Moreover, arguing against a block at the level of glucose import across the plasma membrane, we find that tissue levels of glucose, as well as sorbitol and fructose, which are derived from glucose via the polyol pathway, were increased in failing hearts (Fig. 4c). Expression of sorbitol dehydrogenase (AKRD1) and aldose reductase (AR) was not altered in DCM (Extended Data Fig. 5b). These data suggest instead a possible block immediately downstream, for example, at the level of hexokinase. Gene and protein expression of HK1 and HK2 were not altered in failing hearts (Fig. 4d,e and Extended Data Fig. 5b), but hexokinase is known to be regulated by subcellular localization27,28. Messenger RNA expression of the remaining glycolytic enzyme genes was at most only mildly suppressed (Fig. 4d), but, strikingly, the proteomic dataset revealed reduced protein levels of almost every glycolytic enzyme (Fig. 4e) (underscoring the frequent lack of correlation between mRNA and protein expression). Thus, there appears to be reduced capacity for glycolysis in DCM, perhaps at multiple levels. This interpretation is consistent with a previous report evaluating LV apical cores excised at the time of LVAD placement, in which cardiac improvement after LVAD placement was associated with increased glycolytic intermediates9, as well as numerous rodent studies that demonstrate dramatic amelioration of HF with transgenic over-expression of GLUT1 in cardiomyocytes29–31.
Fig. 4 |. Defects in glycolysis and evidence of increased lactate oxidation in failing hearts.
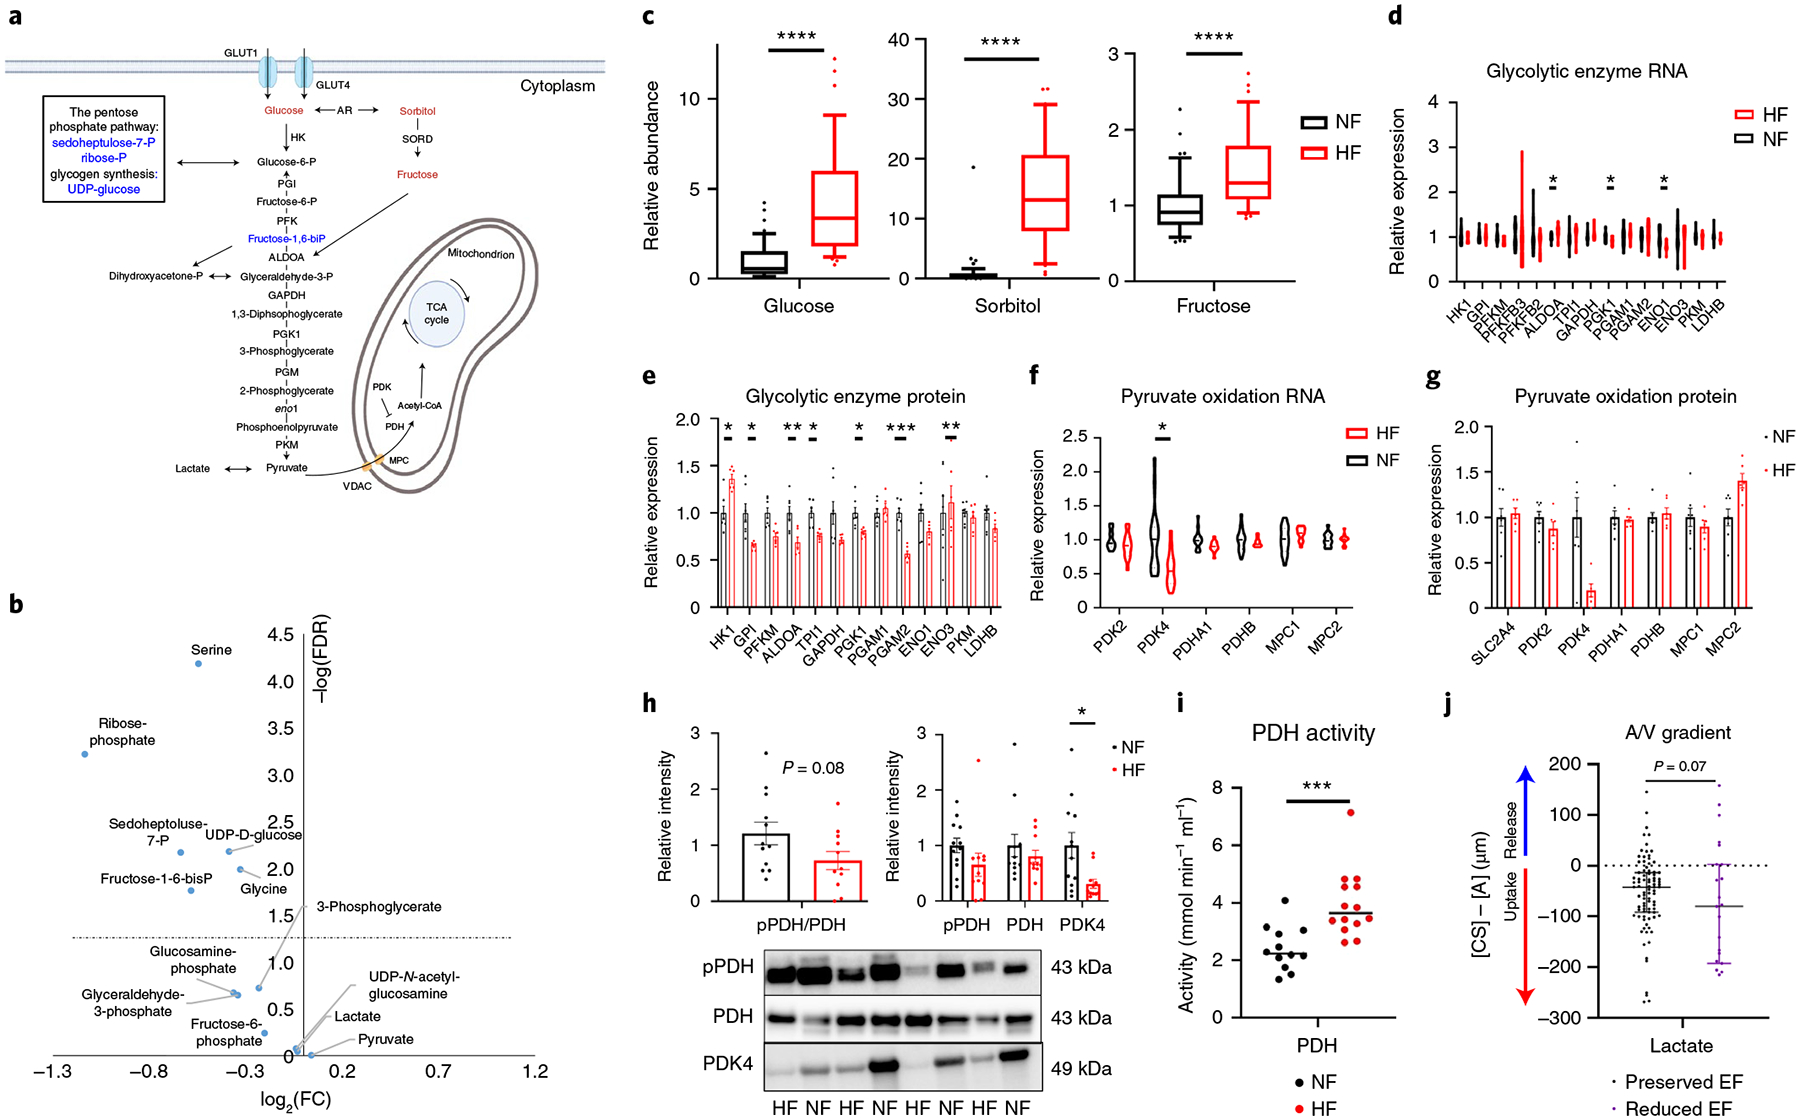
a, Schematic of glycolysis and the polyol pathway. Blue text indicates a metabolite that is significantly reduced in failing hearts and red one that is significantly increased. b, Volcano plot of differences in intermediates and products of glucose in cardiac tissue, comparing nonfailing with failing samples. c, Relative abundance of metabolic intermediates of the polyol pathway in tissue. The whiskers represent the 10th and 90th percentiles, the midline represents the median, the edges of boxes represent the first and third quartiles and points represent data points outside the 10th–90th percentile range (n = 48 NF and n = 39 HF samples; glucose FDR = 3.1 × 10⁻⁸, sorbitol FDR = 2.76 × 10⁻¹³; fructose FDR = 8.62 × 10⁻⁵). d,e, Relative mRNA (d) and protein (e) expression of glycolytic genes. Bars represent mean and s.e.m. (n = 7 NF and n = 6 HF). RNA: ALDOA FDR = 0.0328, PGK1 FDR = 0.0377, ENO1 FDR = 0.0125; protein: HK1 FDR = 0.0323, GPI FDR = 0.0180, ALDOA FDR = 0.00695, TPI1 FDR = 0.0308, PGK1 FDR = 0.0401, PGAM2 FDR = 0.000604, ENO3 FDR = 0.00695. f,g, Relative mRNA (f) and protein (g) expression of genes related to pyruvate oxidation. Bars represent mean and s.e.m. (n = 7 NF and n = 6 HF). PDK4 FDR = 0.0208. h, Quantification (top) of indicated proteins by western blotting, with a representative image of eight failing and nonfailing tissues shown below (see Extended Data Fig. 5 for full blot). Bars represent mean and s.e.m. (n = 12 NF and n = 11 HF); pPDH, phosphorylated PDH. PDK4 P = 0.0135. i, PDH activity in failing and nonfailing tissue. The midline represents median (n = 12 NF and n = 14 HF). P = 0.000716. j, Transcoronary gradient concentrations (artery to coronary sinus) of lactate in human patients with preserved (n = 81) versus reduced (n = 23) EF. Negative values indicate uptake of metabolite into the heart and positive values the release of metabolite from the heart. Lines represent median and IQR. Two outliers are not shown. *P < 0.05, **P < 0.01, ***P < 0.001, ****P < 0.0001. P values were determined by FDR-corrected, two-tailed Student’s t-test. Panel a created with BioRender.com
Second, our data suggest increased carbon flux from pyruvate into the tricarboxylic acid (TCA) cycle through pyruvate dehydrogenase (PDH). In contrast to glycolytic intermediates, levels of pyruvate are not suppressed in DCM hearts (Fig. 4b), reflecting the alternative source for pyruvate: lactate. The entry of pyruvate into mitochondria and the TCA cycle is mediated by the mitochondrial pyruvate carrier (MPC) and PDH, respectively. Subunits of PDH and MPC were generally not altered in either mRNA or protein expression in DCM in our dataset (Fig. 4f,g and Extended Data Fig. 5b) (previous studies have reported conflicting results on expression of MPC1 and −2 in failing human hearts, probably reflecting ischemic versus nonischemic etiologies and location of tissue sampling32,33). In contrast, the expression of PDH kinase 4 (PDK4), which suppresses PDH activity by inhibitory phosphorylation of the E1 subunit of PDH, was suppressed, at both mRNA (50%, FDR = 1.9 × 10⁻³) and protein (80%, P = 0.03, FDR = 0.18) levels (Fig. 4f–h). Consistent with these findings, phosphorylation of PDH appeared decreased by 40% (Fig. 4h) and PDH activity in tissue extract was nearly doubled (Fig. 4i). Finally, we recently reported an approximately threefold increase in lactate consumption in failing hearts, based on simultaneous arterial and coronary sinus sampling from patients undergoing elective percutaneous procedures (Fig. 4j)8, consistent with increased pyruvate oxidation supplied by circulating lactate. Thus, in aggregate, these data indicate that end-stage HF is marked by increased carbohydrate use, more lactate than glucose and a relative insufficiency of glycolysis to fill metabolite pools required for glycolysis and the pentose phosphate pathway.
Altered TCA cycle intermediate pools in HF.
FAO and carbohydrate oxidation converge on the production of acetyl-CoA, which then enters the TCA cycle by condensation with oxalic acid to form citrate (Fig. 5a). Levels of acetyl-CoA were not altered in DCM hearts (Fig. 5b). Strikingly, however, the abundance of all TCA cycle intermediates, except succinate and succinyl-CoA, was substantially decreased in DCM (Fig. 5b). At least three scenarios could explain this observation: decreased overall content of mitochondria in failing hearts, decreased anaplerotic flux of carbons into the TCA cycle or increased loss of TCA intermediates, that is, cataplerosis. RNA-seq evaluation of expression of genes composing the electron transport chain (ETC), 104 encoded by the nuclear genome and 13 by the mitochondrial genome, revealed relatively few significant alterations, with no bias for increased or decreased expression (Extended Data Fig. 6d,e and Supplementary Table 3). The 91 proteins encoded by these genes, 84 nucleus encoded and 7 mitochondria encoded, were detected in the proteomic analyses, again with no evidence of decreased overall ETC expression (Extended Data Fig. 6d,f and Supplementary Table 4). Of the enzymes in the TCA cycle itself, only 2-oxoglutarate dehydrogenase (OGDH) mRNA and IDH2 (isocitrate dehydrogenase 2) protein were suppressed (Fig. 5c,d). Together, these data thus suggest at most a mild reduction in mitochondrial content in DCM hearts. Reports on mitochondrial density in end-stage human HF are mixed, but in general report either no change or mild decrease, despite usually identifying reduced ETC activity34–36. Thus, decreased mitochondrial density is unlikely to be sufficient to explain the reduction in TCA cycle intermediates. Instead, these data suggest that a dysfunctional balance of anaplerosis and cataplerosis is probably occurring in DCM.
Fig. 5 |. Evidence of depressed cardiac anaplerosis and TCA cycle in failing hearts.
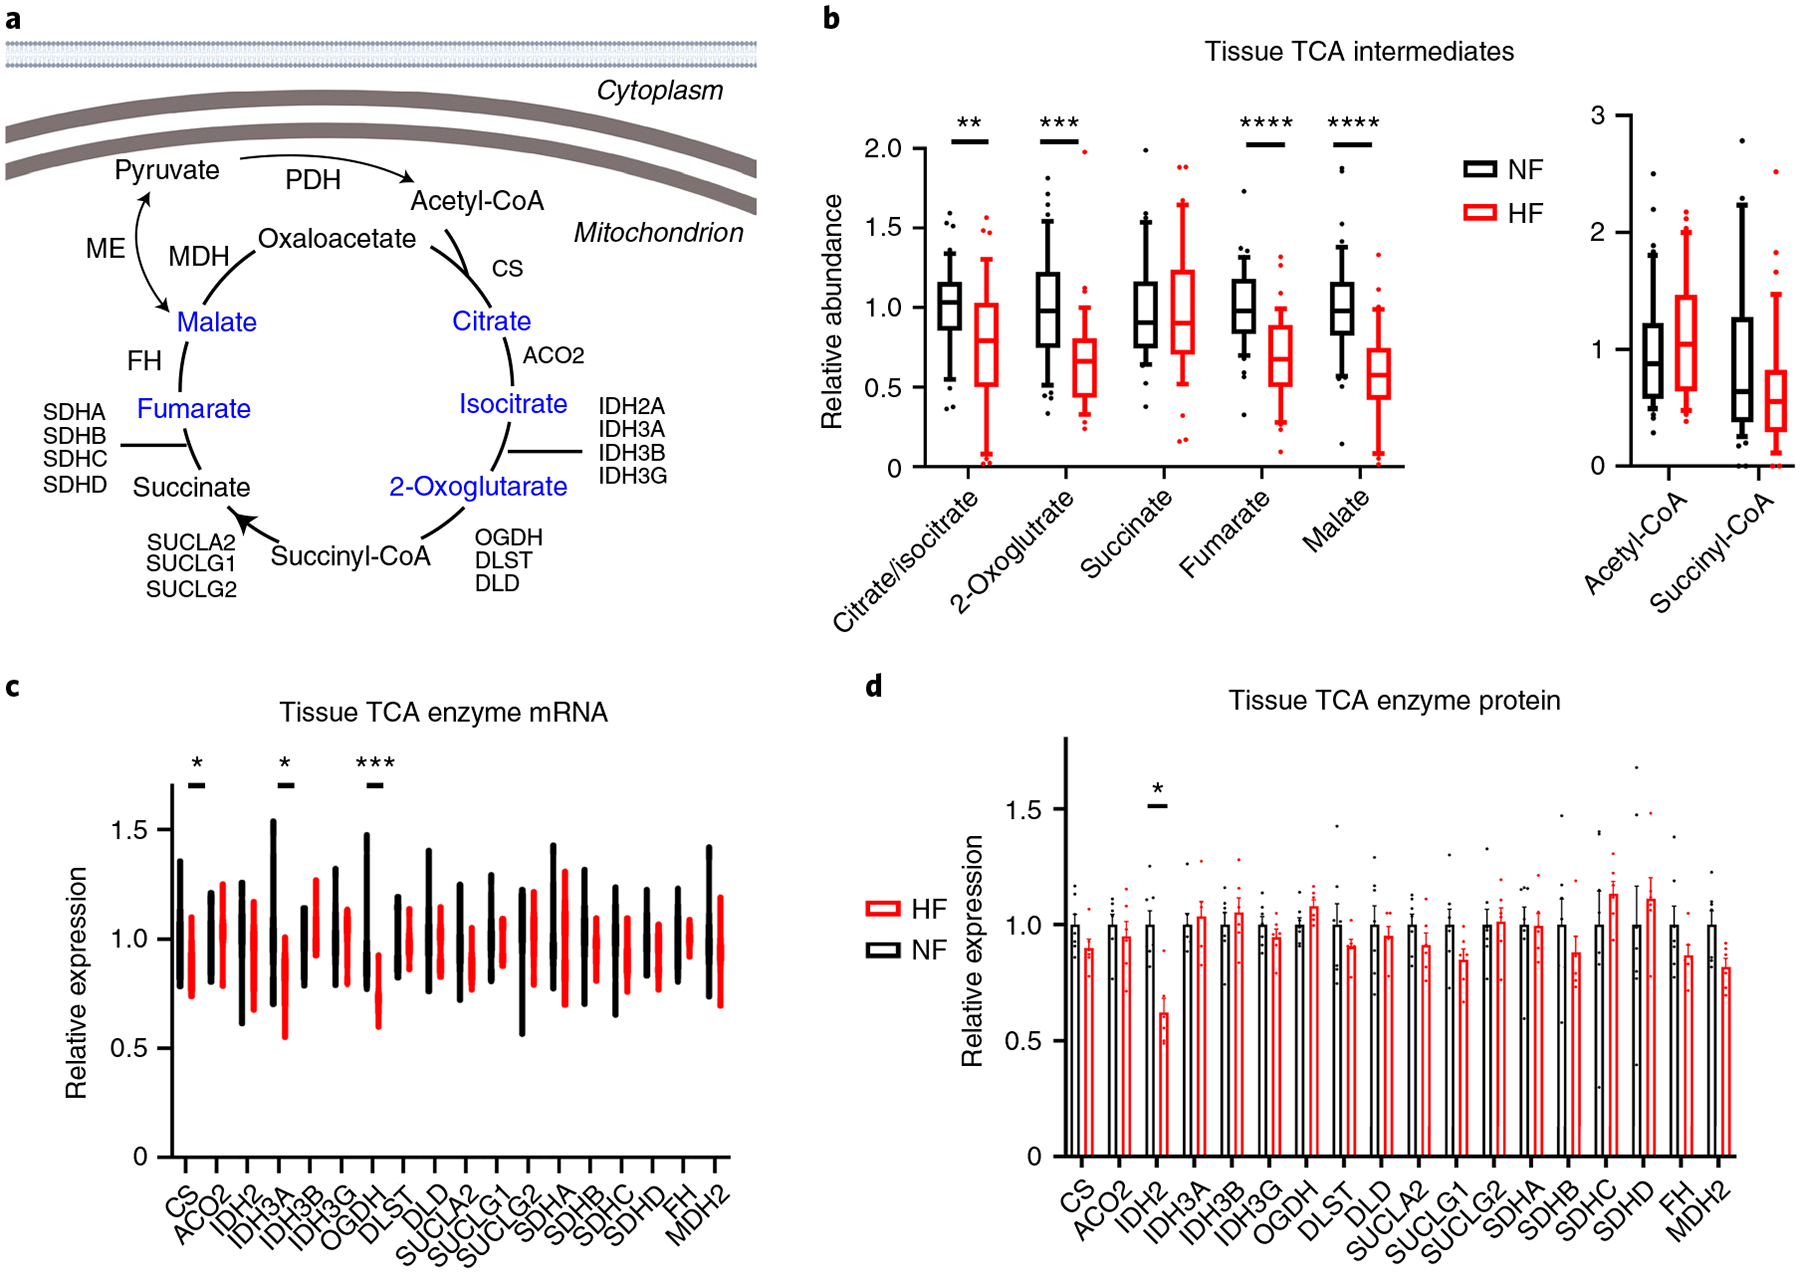
a, Schematic of the TCA cycle. Blue text indicates a metabolite that is significantly reduced in failing hearts. Created with BioRender.com b, Relative abundance of TCA intermediates and indicated coenzyme A species in cardiac tissues. The whiskers represent 10th and 90th percentiles, the midline represents the median, the edges of boxes represent the first and third quartiles and the points represent data points outside the 10th–90th percentile range (n = 48 NF and n = 39 HF samples for non-coenzyme A metabolites (left) and n = 47 NF and N = 35 HF for CoA metabolites (right)). Citrate/isocitrate FDR = 0.00671; 2-oxoglutarate FDR = 0.000179; fumarate FDR = 2.74 × 10⁻⁶; malate FDR = 2.66 × 10⁻⁷. c,d, Relative RNA (c) and protein (d) expression of TCA enzymes. Bars represent mean and s.e.m. (n = 7 NF and n = 6 HF). RNA: CS FDR = 0.0462; IDH3A FDR = 0.020; OGDH FDR = 0.000232. Protein: IDH2 FDR = 0.0217. *P < 0.05, **P < 0.01, ***P < 0.001, ****P < 0.0001. P values were determined by FDR-corrected, two-tailed Student’s t-test.
The sources of anaplerotic flux in human hearts remain unclear. Glutamine, a frequent anaplerotic source in other contexts, probably contributes minimally to heart TCA37 and is instead largely secreted by the human heart8. Nuclear magnetic resonance and MS studies with ex vivo rodent and in vivo pig hearts suggest that the other two major sources of anaplerotic flux, pyruvate carboxylation and the propionyl-CoA-succinate (PCS) pathway, are both active in the heart38–42. Carbons for the PCS pathway probably largely originate from amino acid breakdown8. Pyruvate carboxylation may occur largely via malic enzyme, as pyruvate carboxylase expression in the heart is low. Three isoforms of malic enzyme (ME) exist and are all expressed in the heart, all of which nonsignificantly trended to mildly lower protein expression in DCM hearts (Extended Data Fig. 6a–c). In rodents, ME1 is a contributor to anaplerosis43. In addition, in light of the increased capacity for PDH flux (see above), pyruvate carbons may be shunted away from anaplerosis and toward oxidation. Taken together, these data suggest that end-stage human HF may be accompanied by anaplerotic insufficiency, leading to negative impact on TCA cycle flux capacity, although it cannot be ruled out that the decreased levels of TCA intermediates reflect instead increased cataplerosis, such as ME flux in the direction of pyruvate to produce NAD(P)H or drainage of TCA intermediates into amino acid biosynthesis.
Aberrant ketone metabolism in HF.
Ketones have recently been suggested to be an alternative and favorable fuel source in HF19,44,45 (Fig. 6a). In the present study, we note an almost sevenfold increase of 3-hydroxybutyrate (FDR = 6.9 × 10⁻¹²) and a twofold increase of acetoacetate (FDR = 8.2 × 10⁻⁷) in DCM versus NF hearts (Fig. 6b), accompanied by a 70% increase in 3-hydroxybutyryl-CoA (Fig. 6b and Supplementary Table 5). These data suggest either an increased influx of ketones into failing hearts or a block in ketone use. In our previous arteriovenous metabolomic studies in which simultaneous arterial and coronary sinus samples were taken from patients undergoing elective percutaneous procedures, cardiac ketone consumption nearly tripled in HF patients versus NF patients8 (Fig. 6e), suggesting that the same is likely here. Protein and mRNA expression of monocarboxylate transporter 1 (SLC16A1, the cardiac transporter of ketones and lactate), 3- or β-hydroxybutyrate dehydrogenase (BDH1, first enzymatic step in ketone consumption)46 and ACAT1 and OXCT1 (subsequent enzymes of ketone consumption) are not significantly altered in DCM (Fig. 6c,d), suggesting little control of ketone consumption at this level. Instead, influx of ketones into the heart is probably controlled by mass action8,47 and reflects higher levels of plasma ketones (Fig. 6b) and slower myocardial blood flow, that is, longer residence time8, in DCM patients.
Fig. 6 |. Aberrant ketone metabolism in failing hearts.
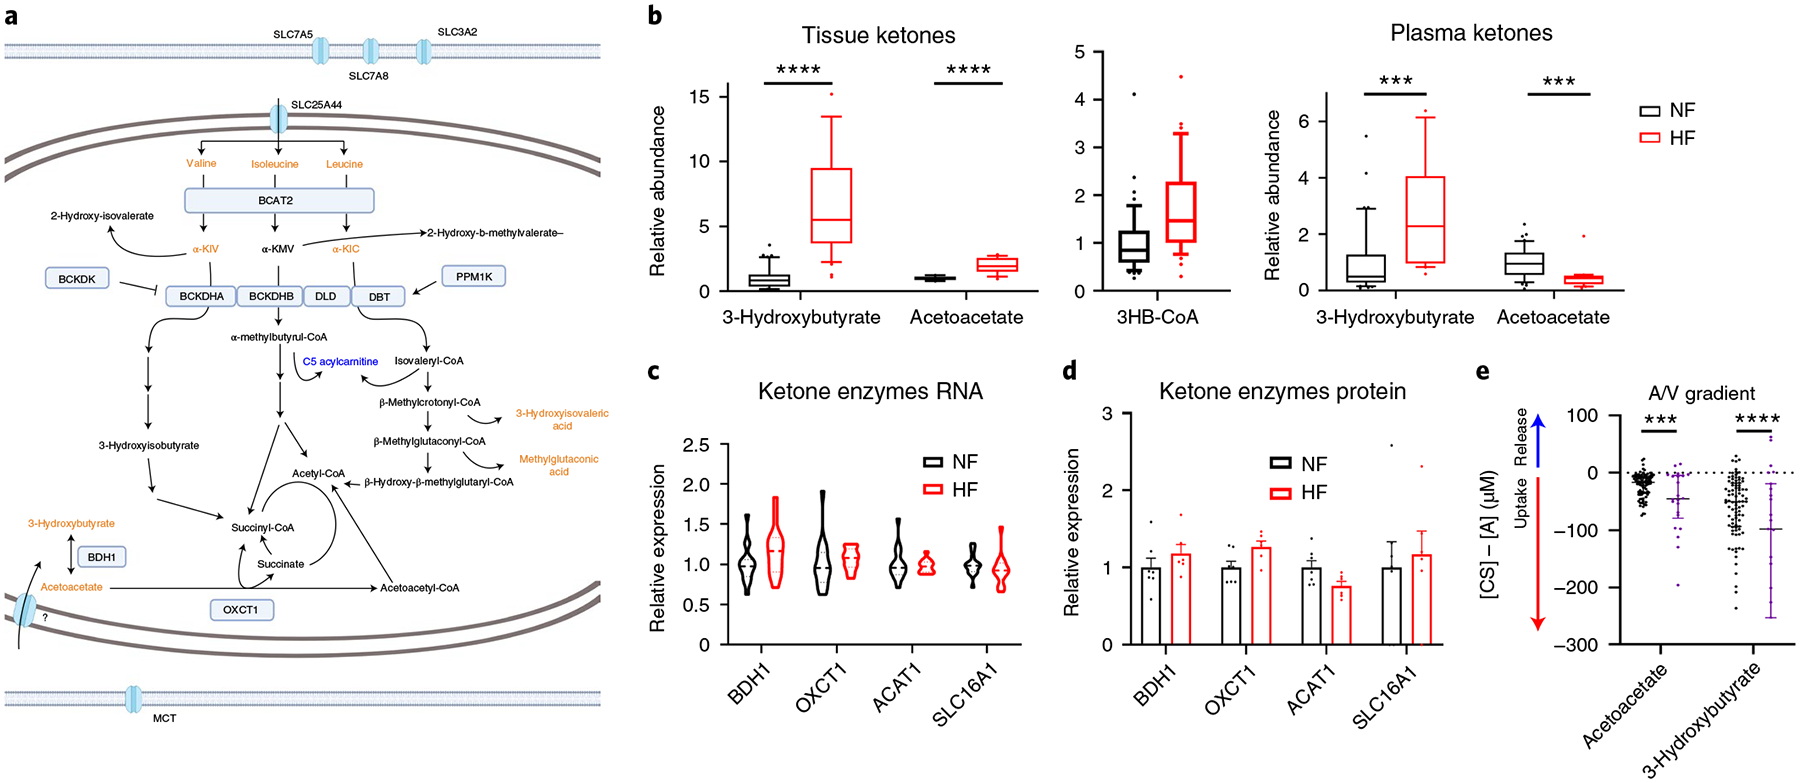
a, Schematic of BCAA and ketone metabolism. Blue text indicates a metabolite that is significantly reduced in failing hearts. Orange text indicates a metabolite that is significantly elevated in failing hearts. Created with BioRender.com b, Relative abundance of ketones (n = 48 NF and n = 39 HF) and 3-hydroxy-CoA (n = 47 NF and n = 35 HF) in cardiac tissues (left) and ketones in plasma (right; n = 42 NF and n = 23). The whiskers represent 10th and 90th percentiles, the midline represents the median, the edges of boxes represent the first and third quartiles and points represent data points outside the 10th–90th percentile range. Tissue: acetoacetate FDR = 8.15 × 10⁻⁷; 3HB FDR = 6.89 × 10⁻¹². Plasma: acetoacetate FDR = 0.000553; BHB FDR = 0.000589. c,d, Relative expression of mRNA (c) and protein (d) of ketone catabolic enzymes. Bars represent mean and s.e.m. (n = 7 NF and n = 6 HF). e, Transcoronary gradient concentrations (artery to coronary sinus) of ketones in human patients with preserved (n = 81) versus reduced (n = 23) EF. Negative values indicate uptake of metabolite into the heart and positive values the release of metabolite from the heart. The lines represent the median and IQR. Five outliers are not shown. Acetoacetate P = 0.000261; BHB P = 0.000058. *P < 0.05, **P < 0.01, ***P < 0.001, ****P < 0.0001. P values were determined by FDR-corrected, two-tailed Student’s t-test.
Aberrant amino acid metabolism in HF.
The abundance of nearly all amino acids is reduced in DCM hearts compared with NF hearts (Fig. 7a). Notably, BCAAs and keto acids (BCKAs) are, in contrast, uniformly elevated (Fig. 7a,b), in the absence of any changes in plasma levels (Supplementary Table 2). This observation has been noted before48,49 and interpreted as a defect in BCAA oxidation and is consistent with the almost tenfold decrease in isovaleryl-carnitine, a product of leucine oxidation (Fig. 7b), and with 30–40% reductions of propionyl-CoA, the end-product of valine oxidation, 2-methylpentenoyl-CoA, a product of propionyl-CoA and valeryl-CoA, an intermediate of leucine oxidation (Fig. 7c and Supplementary Table 5)50. However, other indicators of BCAA oxidation flux, methylglutaconic acid, 3-hydroxyisobutyrate-CoA and 3-hydroxyisobutyrate, are elevated threefold, fourfold and unchanged, respectively (Figs. 6b and 7b) (although other causes of elevated methylglutaconic acid do exist, for example, defects in cardiolipin51). The mRNA and protein expression of rate-limiting BCAA catabolic enzymes are grossly unchanged (Fig. 7d,e), despite reduced expression of KLF15 (Supplementary Table 3), which regulates expression of many of these genes52, and mRNA expression of BCAA importers is reduced (Fig. 7f; proteins were not detected). Our recent arterial/venous studies also did not reveal a suppression of BCAA consumption by the failing heart8 (Fig. 7g). Thus, despite elevated levels of BCAAs in DCM hearts, how the catabolic flux of BCAAs is altered remains unclear. We did not note evidence of mTOR (mammalian target of rapamycin) activation in DCM hearts, despite elevated levels of leucine, probably reflecting the complex regulation of mTOR (Extended Data Fig. 7).
Fig. 7 |. Aberrant amino acid metabolism in failing hearts.
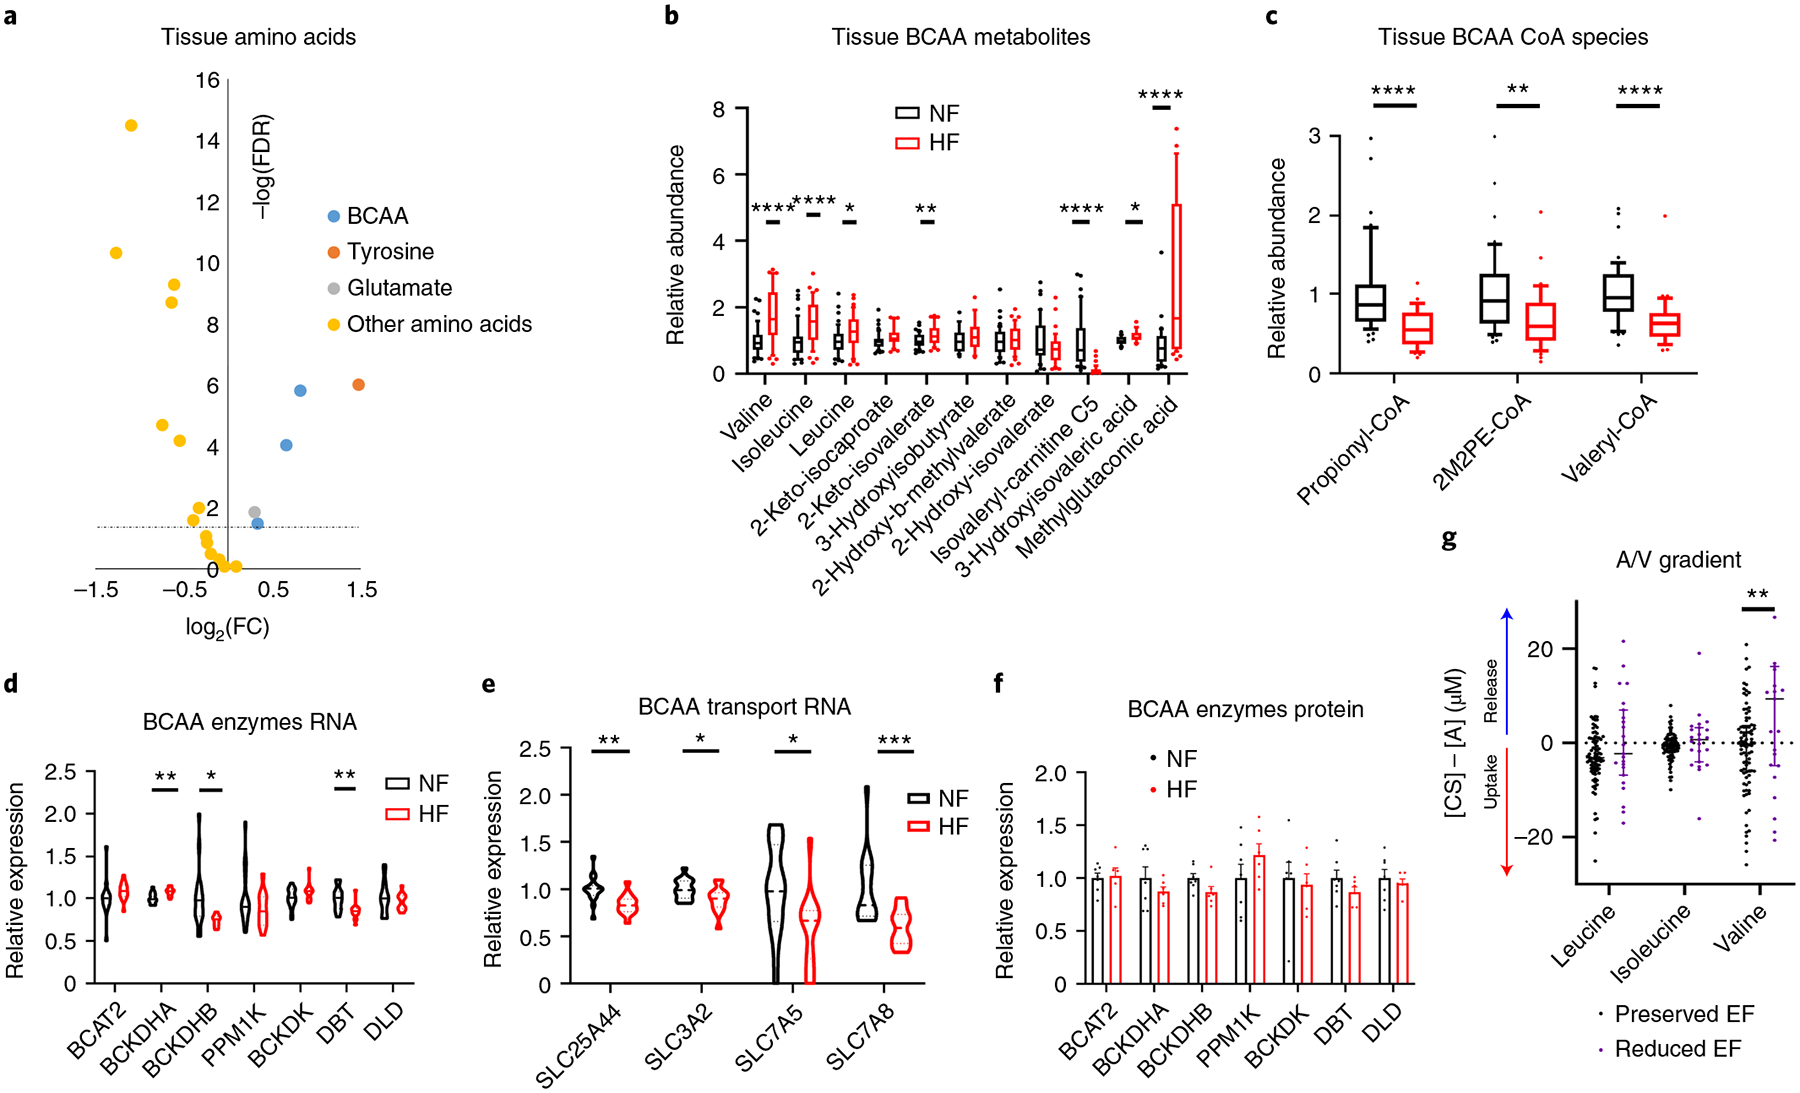
a, Volcano plot of differences in amino acid abundance in cardiac tissue, comparing nonfailing with failing samples. The dotted line represents the threshold of statistical significance (FDR corrected). b,c, Relative abundance of BCAAs and their catabolic intermediates (b; n = 48 NF and n = 39 HF) and CoA species (c; n = 47 NF and n = 35 HF) in cardiac tissues. The whisker plots represent 10th and 90th percentiles, the midline represents the median, the edges of boxes represent the first and third quartiles and points represent data points outside the 10th–90th percentile range. Valine FDR = 1.52 × 10⁻⁶; isoleucine FDR = 9.16 × 10⁻⁵; leucine FDR = 0.0334; 2-keto-isovalerate FDR = 0.00691; isovaleryl-carnitine FDR = 5.41 × 10⁻⁸; 3-hydroxyisovaleric acid FDR = 0.0388; methylglutaconic acid FDR = 0.0001; propionyl-CoA P = 3.71 × 10⁻⁵; 2M2PE-CoA P = 0.00267; valeryl-CoA P = 1.83 × 10⁻⁵. d,e, Relative expression of mRNA (d) and protein (e) of BCAA catabolic enzymes. Bars represent mean and s.e.m. (n = 7 NF and n = 6 HF). RNA: BCKDHA FDR = 0.00544; BCKDHB FDR = 0.0361; DBT FDR = 0.00599. f, Relative mRNA expression of BCAA transport genes. SLC25A44 FDR = 0.00778; SLC3A2 FDR = 0.0495; SLC7A5 FDR = 0.0480; SLC7A8 FDR = 0.00503. g, Transcoronary gradient concentrations (artery to coronary sinus) of BCAAs in human patients with preserved (n = 81) versus reduced (n = 23) EF. Negative values indicate uptake of metabolite into the heart and positive values indicate release of metabolite from the heart. The lines represent the median and IQR. Three outliers are not shown. Valine P = 0.00199. *P < 0.05, **P < 0.01, ***P < 0.001, ****P < 0.0001. P values were determined by FDR-corrected, two-tailed Student’s t-test.
Decreased ceramides and elevated lysophospholipids in HF.
Along with FA species and acylcarnitines as discussed above, ceramides are also strikingly suppressed in DCM (Fig. 8a and Supplementary Table 6). Ceramides derive from the condensation of palmitate and serine to a sphyngoid base (mediated by SPTLC1 and −2), followed by conjugation to various FAs by ceramide synthase (CERS1–6), and finally a dehydrogenation step (by DEGS1)53. Ceramides can also be re-derived from sphingosine through a salvage pathway, also requiring ceramide synthase. The observed reduced levels of ceramides in DCM may reflect reduced levels of substrate FA species described above. In addition, most of the synthetic genes above are significantly suppressed in DCM hearts (Fig. 8b). Ceramide excess in tissues, including cardiomyocytes, is often associated with cytotoxicity, including apoptosis, stress responses and insulin resistance54. Elevations of plasma ceramides have been associated with HF54–57 and, in contrast to our data, elevated cardiac tissue ceramides have been noted in biopsies at the time of LVAD placement in patients with ischemic cardiomyopathy58. These differences may reflect the different ischemic versus nonischemic etiology of disease or sampling location (LVAD cores come from the LV apex, whereas our samples are from the LV free wall).
Fig. 8 |. Decreased ceramides and elevated LPLs in failing hearts.
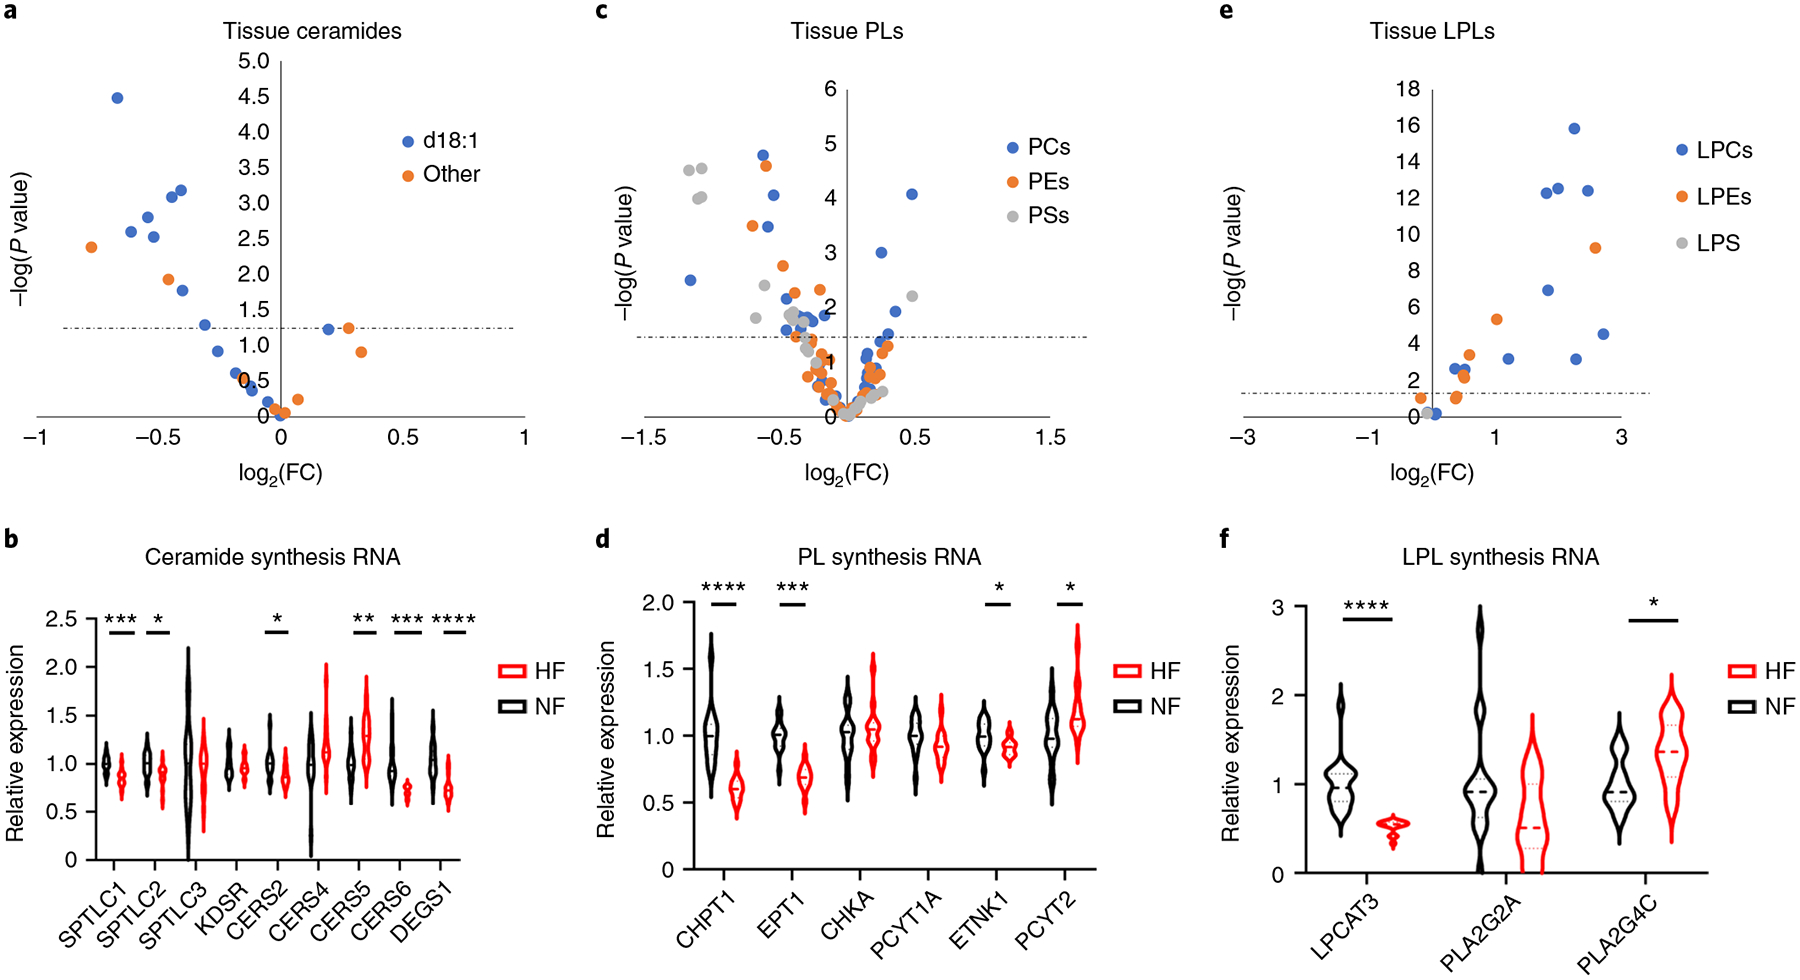
a, Volcano plot of differences in ceramide abundance in cardiac tissue, comparing nonfailing with failing samples. b, Relative mRNA expression of ceramide synthesis enzymes. SPTLC1 FDR = 0.000282; SPTLC2 FDR = 0.0228; CERS2 FDR = 0.0281; CERS5 FDR = 0.00122; CERS6 FDR = 0.000149; DEGS1 FDR = 5.70 × 10⁻⁵. c, Volcano plot of differences in PL abundance in cardiac tissue, comparing nonfailing with failing samples. d, Relative mRNA expression of PL synthesis enzymes. CHPT1 FDR = 1.17 × 10⁻⁵; EPT1 FDR = 5.41 × 10⁻⁷; ETNK1 FDR = 0.0467; PCYT2 FDR = 0.0308. e, Volcano plot of differences in LPL abundance in cardiac tissue, comparing nonfailing with failing samples. f, Relative mRNA expression of LPL synthesis enzymes. LPCAT3 FDR = 4.53 × 10⁻⁵; PLA2G4C FDR = 0.0159. The dotted line represents the threshold of statistical significance (FDR corrected). *P < 0.05, **P < 0.01, ***P < 0.001, ****P < 0.0001. P values were determined by FDR-corrected, two-tailed Student’s t-test.
Phospholipids (PLs) make up about 7% of the dry weight of the heart. We note a complex reprogramming of phosphatidylcholine (PC), phosphatidylethanolamine (PE) and phosphatidylserine (PS) content in DCM, with trends for more abundant saturated PCs and less abundant unsaturated PCs (Fig. 8c and Supplementary Table 6). There is also a significant reduction in expression of choline and ethanolamine phosphotransferases (Fig. 8d), the final steps in the Kennedy pathway to form PC and PE. Lysoglycerophospholipids, that is, PLs with one acyl chain removed, are increased in DCM hearts (Fig. 8e and Supplementary Table 6). Lysoglycerophospholipids are both structural and signaling molecules that have potent effects on inflammatory pathways and have been positively associated with cardiovascular disease, cardiac hypertrophy and cardioprotection during ischemia–reperfusion59,60. Their role in HF has, however, received little attention. Lysophospholipids (LPLs) are typically more abundant in interstitium and plasma than within cells, due to the intracellular expression of lysoactyltransferases, which convert LPC back to PC. It is of interest, however, that LPCAT3, the predominant cardiac lysoactyltransferase, is reduced by 50% in failing samples (Fig. 8f). LPLs are largely generated by the action of phospholipase A2 on PLs, and circulating LPLs are thought to originate predominantly from the action of secreted PLA2 or lipoprotein-associated PLA2 on circulating lipoprotein particles. Intracellular LPLs can be generated from cytosolic PLA2. It is interesting that the cardiac expression of secreted PLA2 (PLA2G2A) was reduced by 50% in DCM hearts, whereas the cardiac form of cytosolic PLA2 (PLA2G4C) is increased by 20% (Fig. 8f). In summary, LPLs are markedly elevated in DCM versus NF human hearts, but the mechanisms of these changes are not clear, and understanding their potential contributions to HF progression will require further studies.
In summary, we identified 678 metabolites in 87 failing and nonfailing human cardiac tissues, and integrated these data with plasma metabolite data, tissue RNA-seq and proteomics data, from a subset of the same subjects, to provide a comprehensive ‘multiomic’ landscape of advanced human HF. Our data are consistent with: (1) a notable decrease in energy charge in the failing hearts; (2) marked decreases in the total tissue adenylate purine pool; (3) reduced FAO, probably at the level of cellular uptake; (4) increased pyruvate and lactate oxidation; (5) glycolytic flux that may be insufficient to match disinhibited PDH activity; (6) accumulation of polyol intermediates; (7) anaplerotic imbalance, possibly from blunted pyruvate carboxylation; (8) increased use of ketones; and (9) marked increases in nearly all LPL species. Together, these profound changes paint a stark image of metabolic derangement and provide insight into mechanisms contributing to the bioenergetic defect of failing human hearts
Limitations
Metabolomic profiling provides a static snapshot of metabolite abundances and cannot be used, on its own, to reliably infer flux. Studies with labeled tracers will be required to confirm conjectured alterations in metabolite flux. Our patient population was restricted to nonischemic DCM; further studies will be needed to establish whether other forms of cardiomyopathy, such as ischemic, hypertrophic or HF with preserved EF, display similar metabolic alterations. Although care was taken to ensure consistent and metabolically protected tissue preparation, it remains possible that metabolic changes occurred during the preparation, although whether any such changes occur differentially in NF and HF hearts remains to be determined. Finally, our study necessarily focused on end-stage HF and conclusions about metabolic alterations occurring earlier during the development of cardiomyopathy merit future investigations.
Methods
Sample procurement.
Whole human hearts were explanted from either patients with late-stage HF undergoing transplantation at the Hospital of the University of Pennsylvania (HF) or from brain-dead organ donors from the Gift-of Life organ donor program (NF). We received informed consent from transplant recipients or next-of-kin of organ donors. Hearts were arrested in situ with ice-cold, high-potassium cardioplegia (UW formula: 125 mmol l−1 of K,+ 30 mmol l−1 of Na,+ 5 mmol l−1 of Mg,2+ 25 mmol l−1 of phosphate, 5 mmol l−1 of SO42−, 100 mmol l−1 of lactobionate, 30 mmol l−1 of raffinose, 1 mmol l−1 of allopurinol, 5 mmol l−1 of adenosine, 3 mmol l−1 of glutathione and 5% pentastarch), excised from the body and stored at 4 °C in Krebs–Henseleit buffer. Samples were taken from the LV free wall, flash frozen in liquid nitrogen and stored at −80 °C.
Blood samples were collected from donors and transplant recipients before administration of heparin and placed in collection tubes. Tubes were kept at 4 °C and spun in a centrifuge at 3,000 r.p.m. for 15 min to achieve phase separation. The plasma layer was collected, placed into tubes with lithium heparin coating, flash frozen in liquid nitrogen and stored at −80 °C.
Cohort selection.
We performed our studies in two cohorts. The first cohort of n = 18 end-stage failing and n = 18 nonfailing hearts was matched for age, gender and race. Nonfailing status was determined by EF ≥ 50% with no history of HF. All failing hearts were diagnosed as nonischemic cardiomyopathy or DCM with no coronary artery disease or sarcoidosis etiology. Patients with a history of diabetes or LVAD were excluded from both populations. The second cohort of 30 NF and 21 HF samples was chosen within the same criteria as the first, but without gender and race matching.
RNA-seq.
RNA-seq libraries were prepared using the Illumina TruSeq stranded mRNA kit followed by the Nugen Ovation amplification kit. To avoid confounding by batch effects, libraries were randomly selected into pools of 32 and pools were sequenced on a Hiseq2500 to a depth of ~30 million 100-bp paired-end reads per biological sample. Fastq files were aligned against a human reference (hg19/hGRC37) using the STAR aligner. Duplicate reads were removed using MarkDuplicates from Picard tools and per-gene read counts for Ensembl (v.75) gene annotations were computed. Expression levels in counts per million were normalized and transformed using the VOOM procedure in the LIMMA R package. Surrogate variables to account for sources of latent variation such as batch were calculated using the svaseq function from the SVA package. The data are publicly available in the National Center for Biotechnology Information (NCBI) Gene Expression Omnibus (GEO) repository with accession no. GSE14190.
Metabolite extraction.
Plasma (5 μl) was mixed with 150 μl of −20 °C 40:40:20 (v:v:v) methanol:acetonitrile:water (extraction solvent), vortexed and immediately centrifuged at 16,000g for 10 min at 4 °C. The supernatant was collected for LC–MS analysis. To extract metabolites from heart samples, frozen hearts were ground at liquid nitrogen temperature with a Cryomill (Retsch). The resulting tissue powder (~20 mg) was weighed and then extracted by adding −20 °C extraction solvent (as above), vortexed and immediately centrifuged at 16,000g for 10 min at 4 °C. The volume of the extraction solution (μl) was 40× the weight of tissue (mg) to make an extract of 25 mg of tissue per ml of solvent. The supernatant was collected for LC–MS analysis.
Metabolite measurement by LC–MS.
A quadrupole-orbitrap mass spectrometer (Q Exactive, Thermo Fisher Scientific) operating in negative or positive ion mode was coupled to a hydrophilic interaction chromatography via electrospray ionization and used to scan from m/z 70 to m/z 1,000 at 1 Hz and 140,000 resolution. LC separation was on a XBridge BEH Amide column (2.1 × 150 mm2, 2.5-μm particle size, 130-Å (13-nm) pore size; Waters) using a gradient of solvent A (20 mM ammonium acetate, 20 mM ammonium hydroxide in 95:5 water:acetonitrile, pH 9.45) and solvent B (acetonitrile). The flow rate was 150 μl min−1. The LC gradient was: 0 min, 85% B; 2 min, 85% B; 3 min, 80% B; 5 min, 80% B; 6 min, 75% B; 7 min, 75% B; 8 min, 70% B; 9 min, 70% B; 10 min, 50% B; 12 min, 50% B; 13 min, 25% B; 16 min, 25% B; 18 min, 0% B; 23 min, 0% B; 24 min, 85% B; 30 min, 85% B. Autosampler temperature was 5 °C and injection volume was 3 μl. Data were analyzed using the MAVEN software.
Lipid measurement by LC–MS.
Plasma (5 μl) and heart tissue powder (~20 mg) were mixed with −20 °C isopropanol (extraction solvent), vortexed and immediately centrifuged at 16,000g for 10 min at 4 °C. The volume of the extraction solution (μl) was 30× the volume of serum and 40× the weight of tissue (mg), respectively. The supernatant was collected for LC–MS analysis.
A quadrupole-orbitrap mass spectrometer (Q Exactive, Thermo Fisher Scientific) operating in positive ion mode was coupled via electrospray ionization and used to scan from m/z 290 to m/z 1,200 at 1 Hz and 140,000 resolution. LC separation was on a Atlantis T3 Column (2.1 × 150 mm2, 3-μm particle size, 100-Å pore size; Waters) using a gradient of solvent A (1 mM ammonium acetate, 35 mM acetic acid in 90:10 water:methanol) and solvent B (1 mM ammonium acetate, 35 mM acetic acid in 98:2 isopropanol:methanol). Flow rate was 150 μl min−1. The LC gradient was: 0 min, 25% B; 2 min, 25% B; 5.5 min, 65% B; 12.5 min, 100% B; 16.5 min, 100% B; 17 min, 25% B; 30 min, 25% B. Autosampler temperature was 4 °C and injection volume was 3 μl. Data were analyzed using the MAVEN software.
Acyl-CoA extraction and analysis.
Acyl-CoAs were measured by LC–high-resolution MS as previously described61. Briefly, aliquots of pre-weighed tissue (range 5.9–45.2 mg, average 19.7 mg) were spiked with 0.1 ml of [13C315N1]acyl-CoA internal standard prepared as previously described for yeast62 and 0.9 ml of 10% (w:v) trichloroacetic acid in water. Samples were homogenized by using a probe-tip sonicator in 0.5-s pulses 30× then centrifuged at 17,000g for 10 min at 4 °C. Calibration curves were prepared from commercially available acyl-CoA standards (Sigma-Aldrich). Calibration curve samples were also subjected to sonication and extraction in the same manner as the experimental samples to account for matrix effects, sample losses and analyte stability. Samples and standards were purified by solid phase extraction cartridges (Oasis HLB 10 mg) that were conditioned with 1 ml of methanol and 1 ml of water. Acid-extracted supernatants were loaded on to the cartridges and washed with 1 ml of water. Acyl-CoA metabolites were eluted with 1 ml of 25 mM ammonium acetate in methanol and dried under nitrogen. Samples were resuspended in 50 μl of 5% (w:v) 5-sulfosalicyilic acid and 10-μl injections were analyzed on an Ultimate 3000 UHPLC using a Waters HSS T3 2.1 × 100 mm2 3.5-μm column coupled to a Q Exactive Plus. The analysts were blinded to sample identity during processing and quantification.
Data normalization and analysis.
Normalization and analysis were done using R v.3.6.0 and Microsoft Excel v.2103. The two cohorts of metabolomics data were normalized as separate batches. Within each batch, positive and negative mode data were also normalized separately. First, statistical outlier data points were removed from each metabolite. Outliers were determined using the ‘boxplot()’ function in R. Next, metabolites for which count values were <10,000 for any sample were removed from analysis. Weak signals (for example, <10,000 counts) indicate low-integrity data that could confound analysis. Finally, data were normalized to the median value within each sample. Then, each data point for a metabolite was averaged to the average nonfailing value of that metabolite.
After separate normalization, positive and negative modes from both cohorts were combined to form one dataset. Fold-change of each metabolite was calculated as average failing value divided by average nonfailing value. Metabolites reaching a two-tailed Student’s t-test P value <0.05 (calculated in Excel using the ‘t.test’ parametric function) were considered significantly different between failing and nonfailing samples.
PCA plots were generated using the ‘ggfortify’ package in R.
Polar plots were generated using the ‘tidyverse’ and ‘plotrix’ packages in R.
Violin and bar graphs were generated in GraphPad Prism 8.3.0 and 9.1.1.
Sample procurement figure was generated using BioRender.com
Volcano plots were generated in Excel.
Similarity matrices were generated using Morpheus.
Western blots and molecular assays.
Protein for western blots was extracted from frozen LV powdered tissue as described previously63. Thiourea (TU) buffer (8 M urea, 2 M thiourea, 3% sodium dodecylsulfate, 75 mM dithiothreitol and 50 mM Tris, pH 7.5; also requires mixed-bed resin—BioRad, catalog no. 1426425) was added to tissue (40 μl of TU per mg of tissue) and mixed via a pipette to rapidly thaw the tissue. The mixture was transferred to a small glass tissue homogenizer and homogenized. Then 40 volumes of glycerol buffer (1:1 glycerol:water + 2× protease inhibitor (complete miniproteinase inhibitor cocktail, Roche)) was added and a few additional strokes were performed. Lysates were incubated at 37 °C for 30 min and spun in a centrifuge for 5 min at 10 °C and 20-kg speed. The supernatant was stored at −80 °C until use.
Protein lysates were loaded into a 4–20% gradient tris(glycine polyacrylamide) gel (BioRad) and electrophoresed. Samples were transferred to a poly(vinylidene fluoride) membrane (Millipore Sigma) and incubated for 15 min with Ponceau S solution (Sigma-Aldrich, catalog no P7170) to expose total protein. The membrane was washed twice with double-distilled water (ddH2O) for 5 min each and imaged. Protein for each well was quantified using Fiji imaging software and relative values were used to normalize protein loading for future blots. Subsequent western blots were performed as described above, including Ponceau staining and imaging. Membranes were then blocked with 5% in tris-buffered saline–Tween 20 (TBS-T) for 30 min and incubated overnight in primary antibodies at 4 °C. The next day, membranes were washed with TBS-T and incubated with species-appropriate horseradish peroxidase (HRP)-conjugated secondary antibodies in 5% milk in TBS-T for 1 h. Membranes were imaged using the ImageQuant LAS 4000 (GE Healthcare Life Sciences) and quantified using Fiji software. Blots were normalized to total protein via Ponceau stain.
The following primary antibodies were used: Acsl1 (Cell Signaling Technology, catalog no. 4047S), PDK4 (Abcam, catalog no. ab 110336), AKR1B1 (Thermo Fisher Scientific, catalog no. 15439–1-AP), ME1 (Abcam, catalog no. ab97445), ME3 (Abcam, catalog no. ab172972), HK1 (Cell Signaling Technology, catalog no. 2024S), HK2 (Cell Signaling Technology, catalog no. 2867S), MPC1 (Cell Signaling Technology, catalog no. 14462S), MPC2 (Cell Signaling Technology, catalog no. 46141S), total PDH (Cell Signaling Technology, catalog no. 3205S), phosphoPDH E1 alpha S293 (Abcam, catalog no. ab92696), GLUT1 (Abcam, catalog no. ab 115730), GLUT4 (Abcam, catalog no. ab33780), total AKT (Cell Signaling Technology, catalog no. 4961), phospho-AKT (Cell Signaling Technology, catalog no. 4058S), total S6 (Cell Signaling Technology, catalog no. 2217S) and phospho-S6 Ser235/236 (Cell Signaling Technology, catalog no. 2211).
The following secondary antibodies were used: anti-mouse immunoglobulin (Ig)G HRP-linked (Cell Signaling Technology, catalog no. 7076S) and anti-rabbit IgG HRP-linked (Cell Signaling Technology, catalog no. 7074S). All primary antibodies were used at a dilution of 1:1,000 and all secondary antibodies were used at a dilution of 1:10,000.
PDH activity was determined using a colorimetric assay kit (Millipore Sigma, catalog no. MAK183) as described in the kit protocol using frozen LV tissue.
Reporting summary.
Further information on research design is available in the Nature Research Reporting Summary linked to this article.
Extended Data
Extended Data Fig. 1 |.
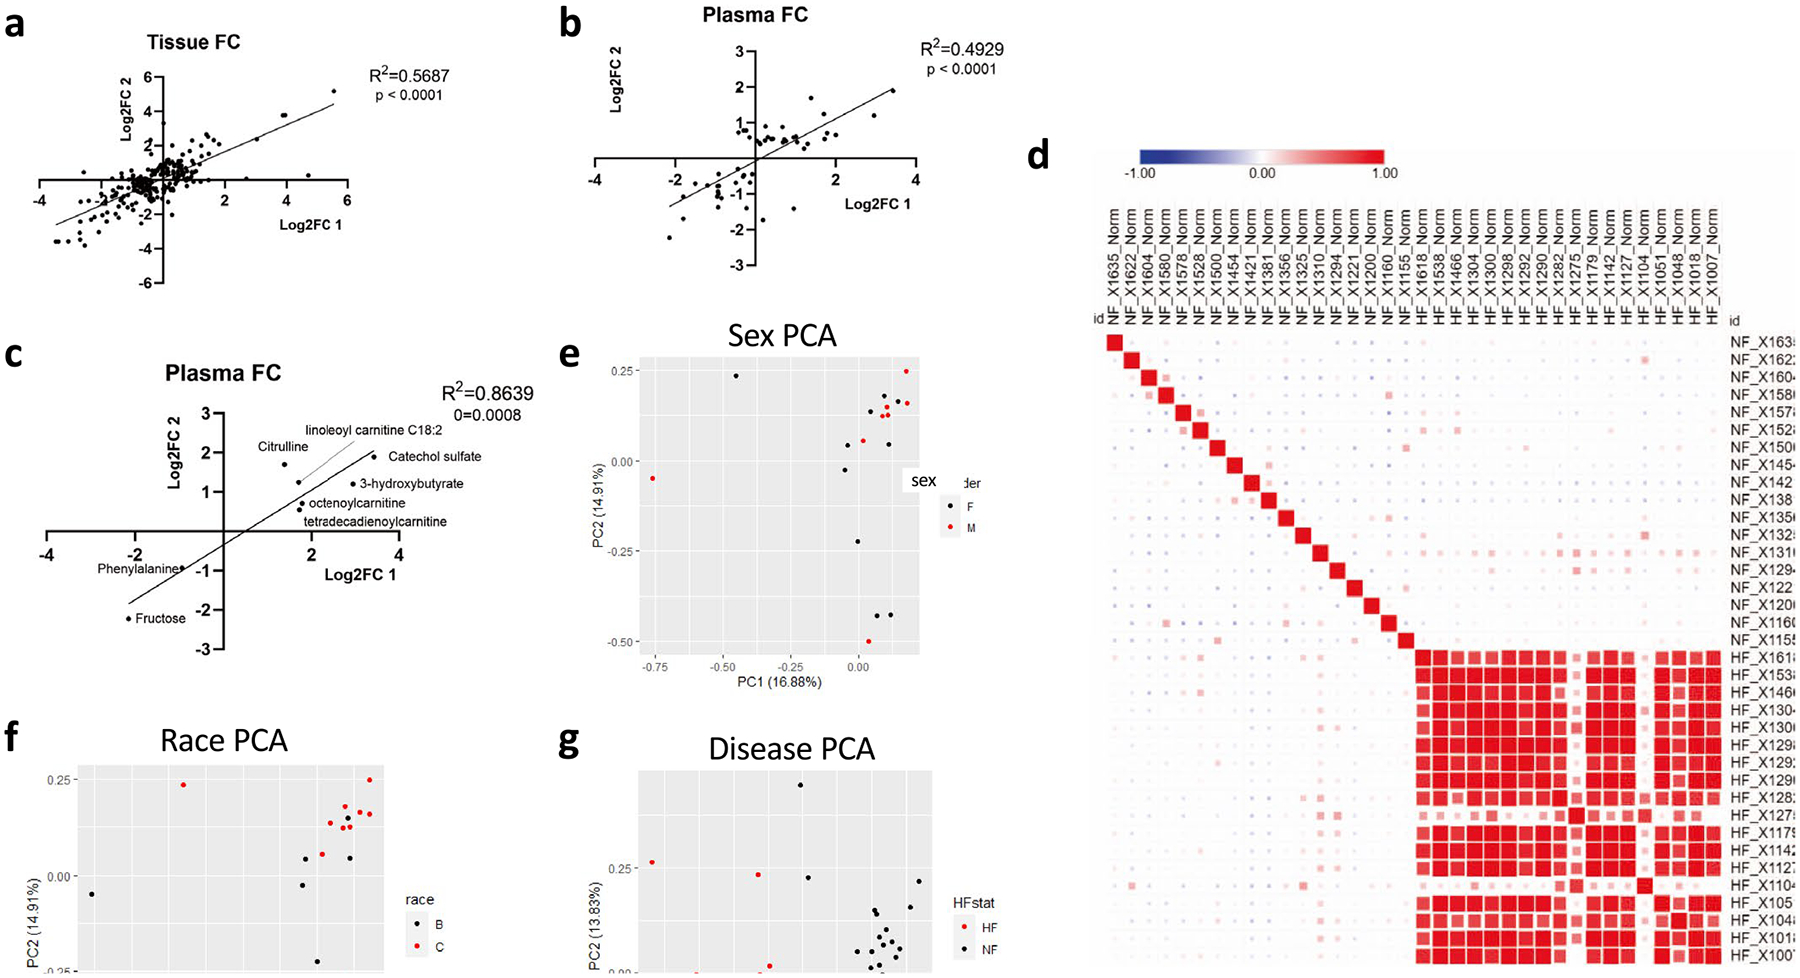
a, b) Correlation between cohort 1 and 2 tissue (a) or plasma (b) of fold-changes (FC) between non-failing and failing samples of metabolites significantly altered (FDR < 0.05) in at least one cohort. One outlier was removed from analysis in figure b. c) Correlation between cohorts 1 and 2 of plasma fold-change of metabolites significantly altered in both cohorts (FDR < 0.05). d) Similarity matrix of samples from cohort 1 based on metabolomics data. Size of square is proportional to Pearson correlation coefficient. e) Principal component analysis (PCA) of non-failing tissue samples from cohort 1. Data points represent patients and are pseudo-colored to reflect sex of donor. f) PCA of non-failing tissue samples from cohort 1. Data points represent patients and are pseudo-colored to reflect race of donor. g) PCA plot of all tissue samples from cohort 1. Data points represent patients and are pseudo-colored to reflect heart failure (HF) vs nonfailing (NF).
Extended Data Fig. 2 |.
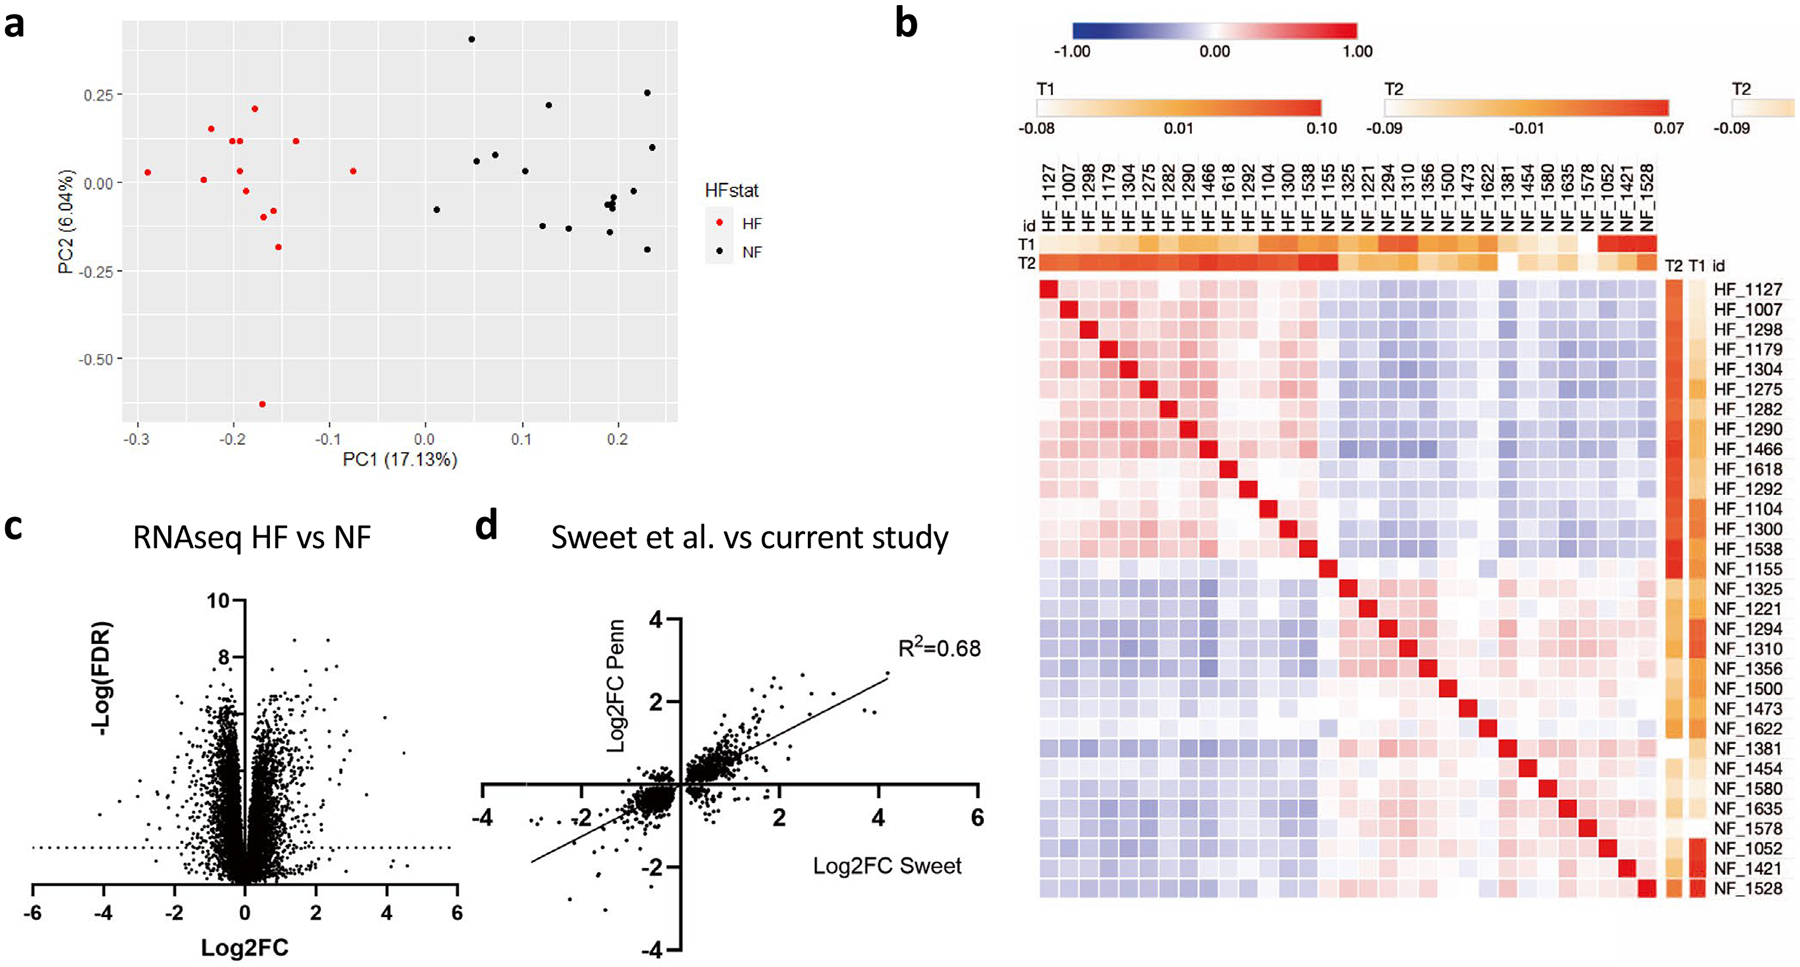
a) PCA plot of mRNA expression from all tissue samples. Data points represent patients and are pseudo-colored to reflect heart failure (HF) vs nonfailing (NF). b) Similarity matrix of RNA-seq data between individual samples. c) Volcano plot of RNA-seq data from tissue samples. d) Correlation between the current cohort (combined 1 and 2) and a previously published data set (Sweet et al.) of significant fold-changes (FC; nominal p-val < 0.05 by two-sided t-test) in mRNA expression between non-failing vs failing cardiac samples.
Extended Data Fig. 3 |.
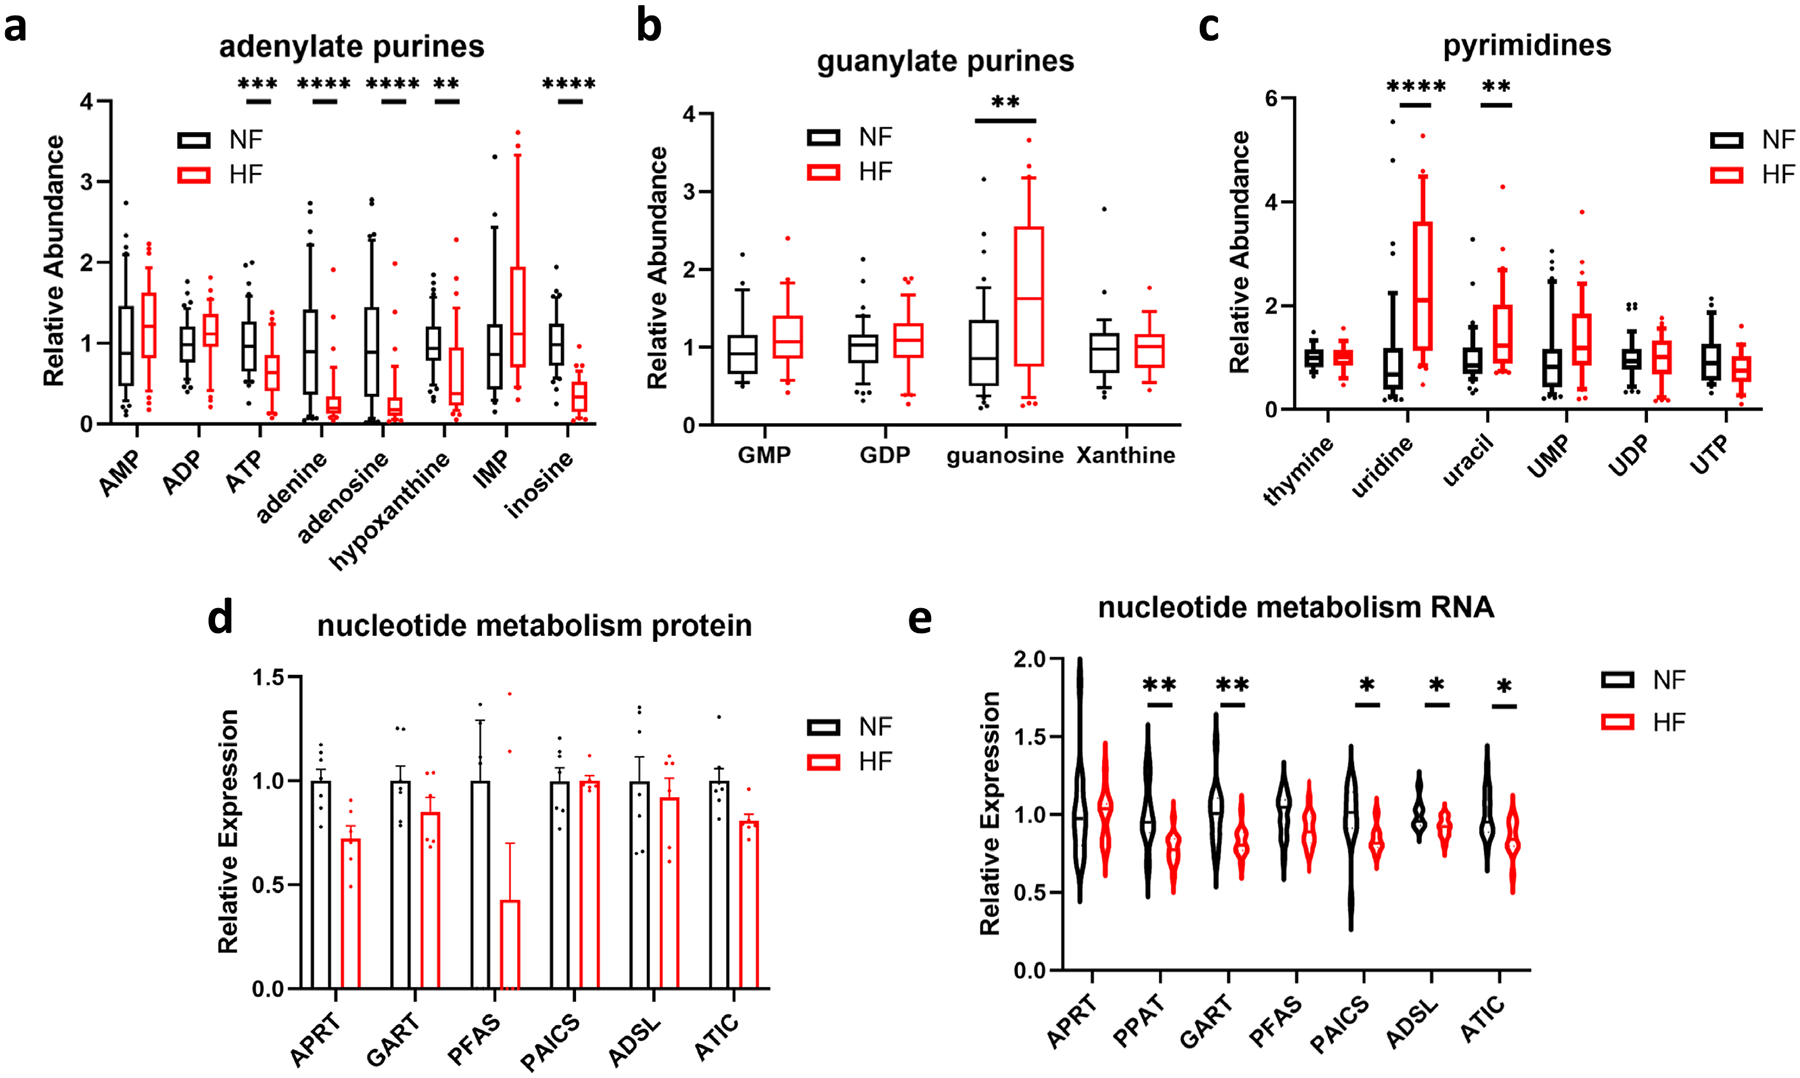
a-c) Relative abundance of metabolites involved in adenylate (a), guanylate (b), or pyrimidine (c) metabolism in cardiac tissue from nonfailing donors (NF) or subjects with heart failure (HF). Whiskers represent 10th and 90th percentiles, midline represents median, edges of boxes represent first and third quartiles, and points represent data points outside the 10th-90th percentile range. N = 48 NF and N = 39 HF samples. ATP FDR = 0.000904; adenine FDR = 1.09E-05; adenosine FDR = 1.4E-05; hypoxanthine FDR = 0.00126; inosine FDR = 3.02E-13; guanosine FDR = 0.00227; uracil FDR = 0.00202; uridine FDR = 1.09E-05. d-e) Relative protein (d) and mRNA (e) expression of enzymes involved in nucleotide metabolism. Bars represent mean and standard error (N = 7 NF and N = 6 HF). RNA: PPAT FDR = 0.00425; GART FDR = 0.00967; PAICS FDR = 0.0292; ADSL FDR = 0.0204; ATIC FDR = 0.0144. *P < 0.05, **P < 0.01, ***P < 0.001, ****P < 0.0001. P-values were determined by FDR-corrected two-tailed t-test.
Extended Data Fig. 4 |.
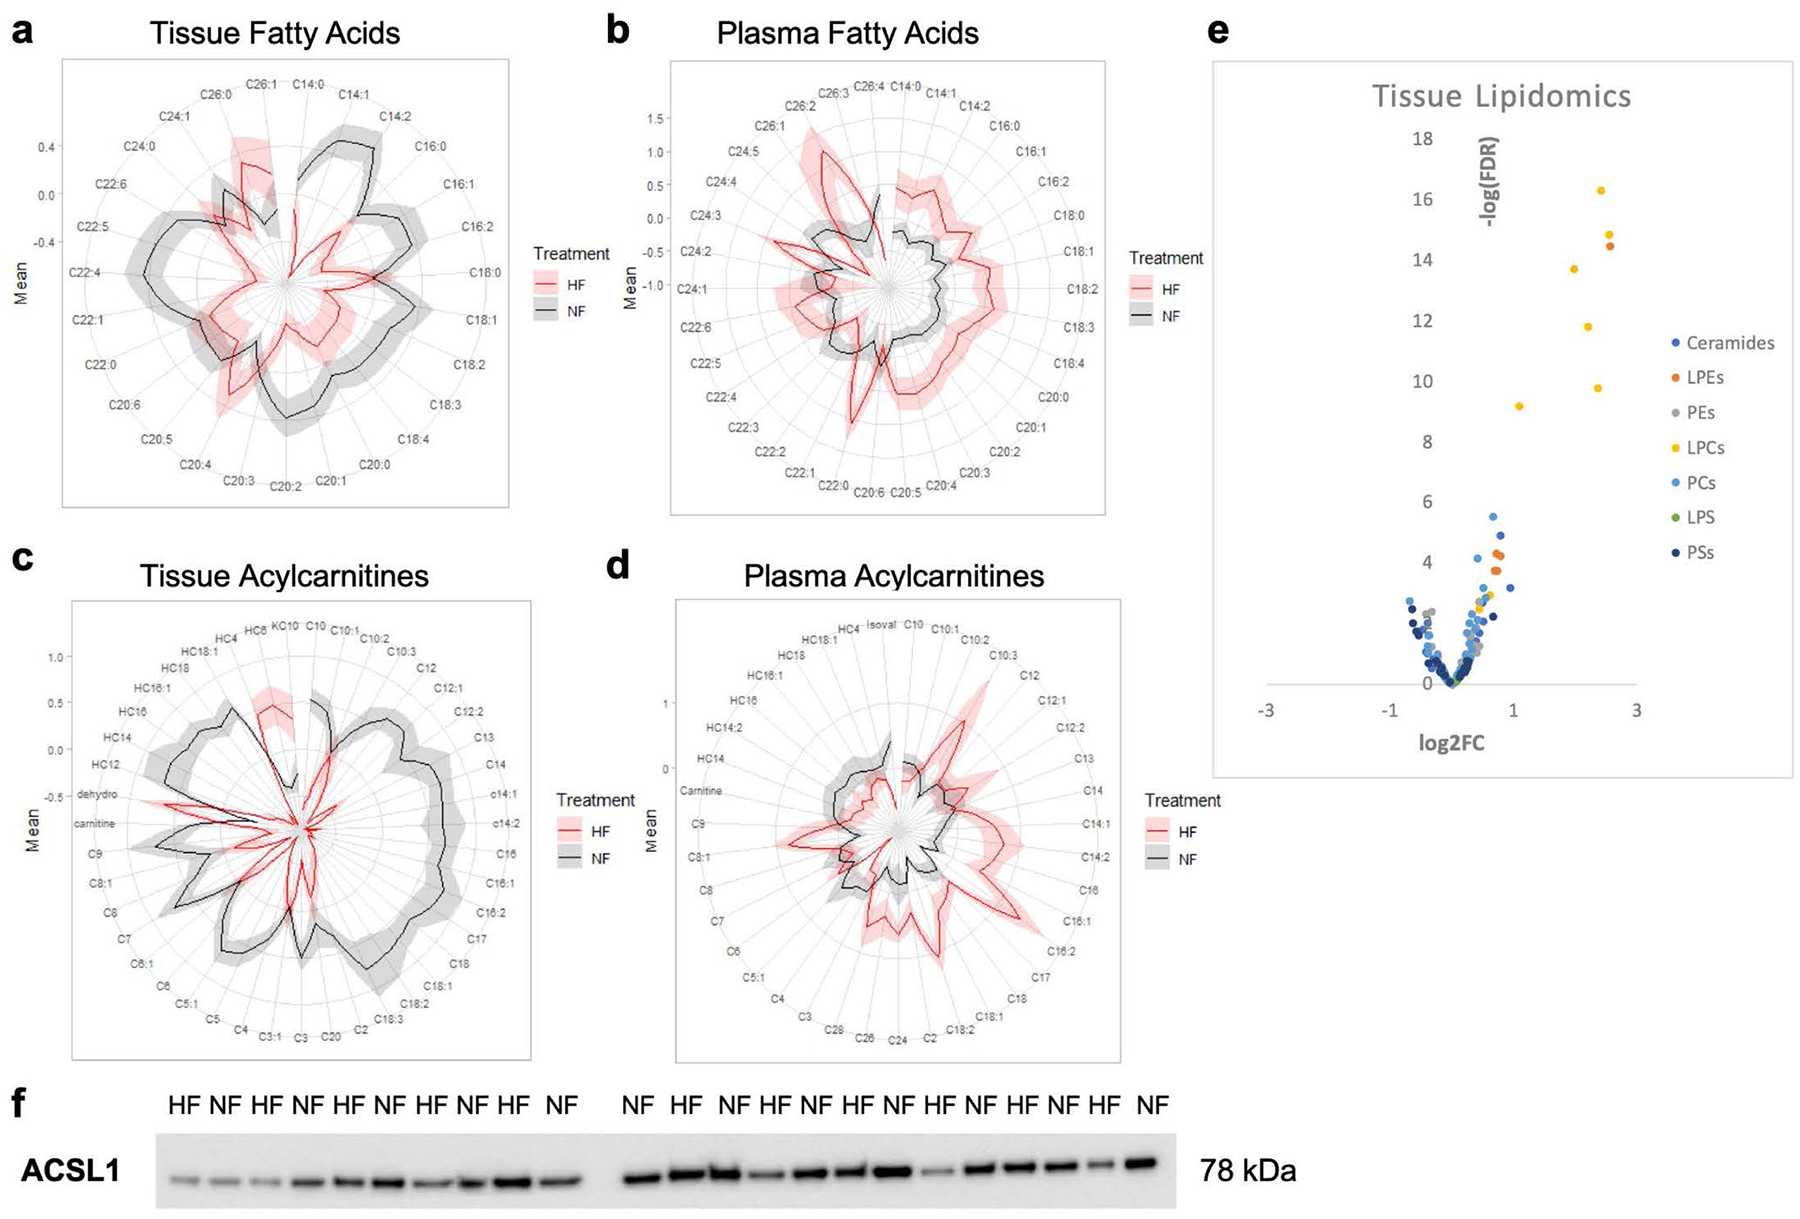
a, b) Polar plots showing average relative abundance of tissue (a) and plasma (b) fatty acids between failing and non-failing subjects. Fold-change increases with distance from the origin, and shaded extended borders indicate standard error. c-d) Polar plots showing average relative abundance of carnitine species in tissue (c) and plasma (d) between failing and non-failing subjects. e) Volcano plots of differences in metabolite abundance in cardiac tissue after lipid extraction. f) Full western blot of ACSL1 protein (see Fig. 3 for quantification).
Extended Data Fig. 5 |.
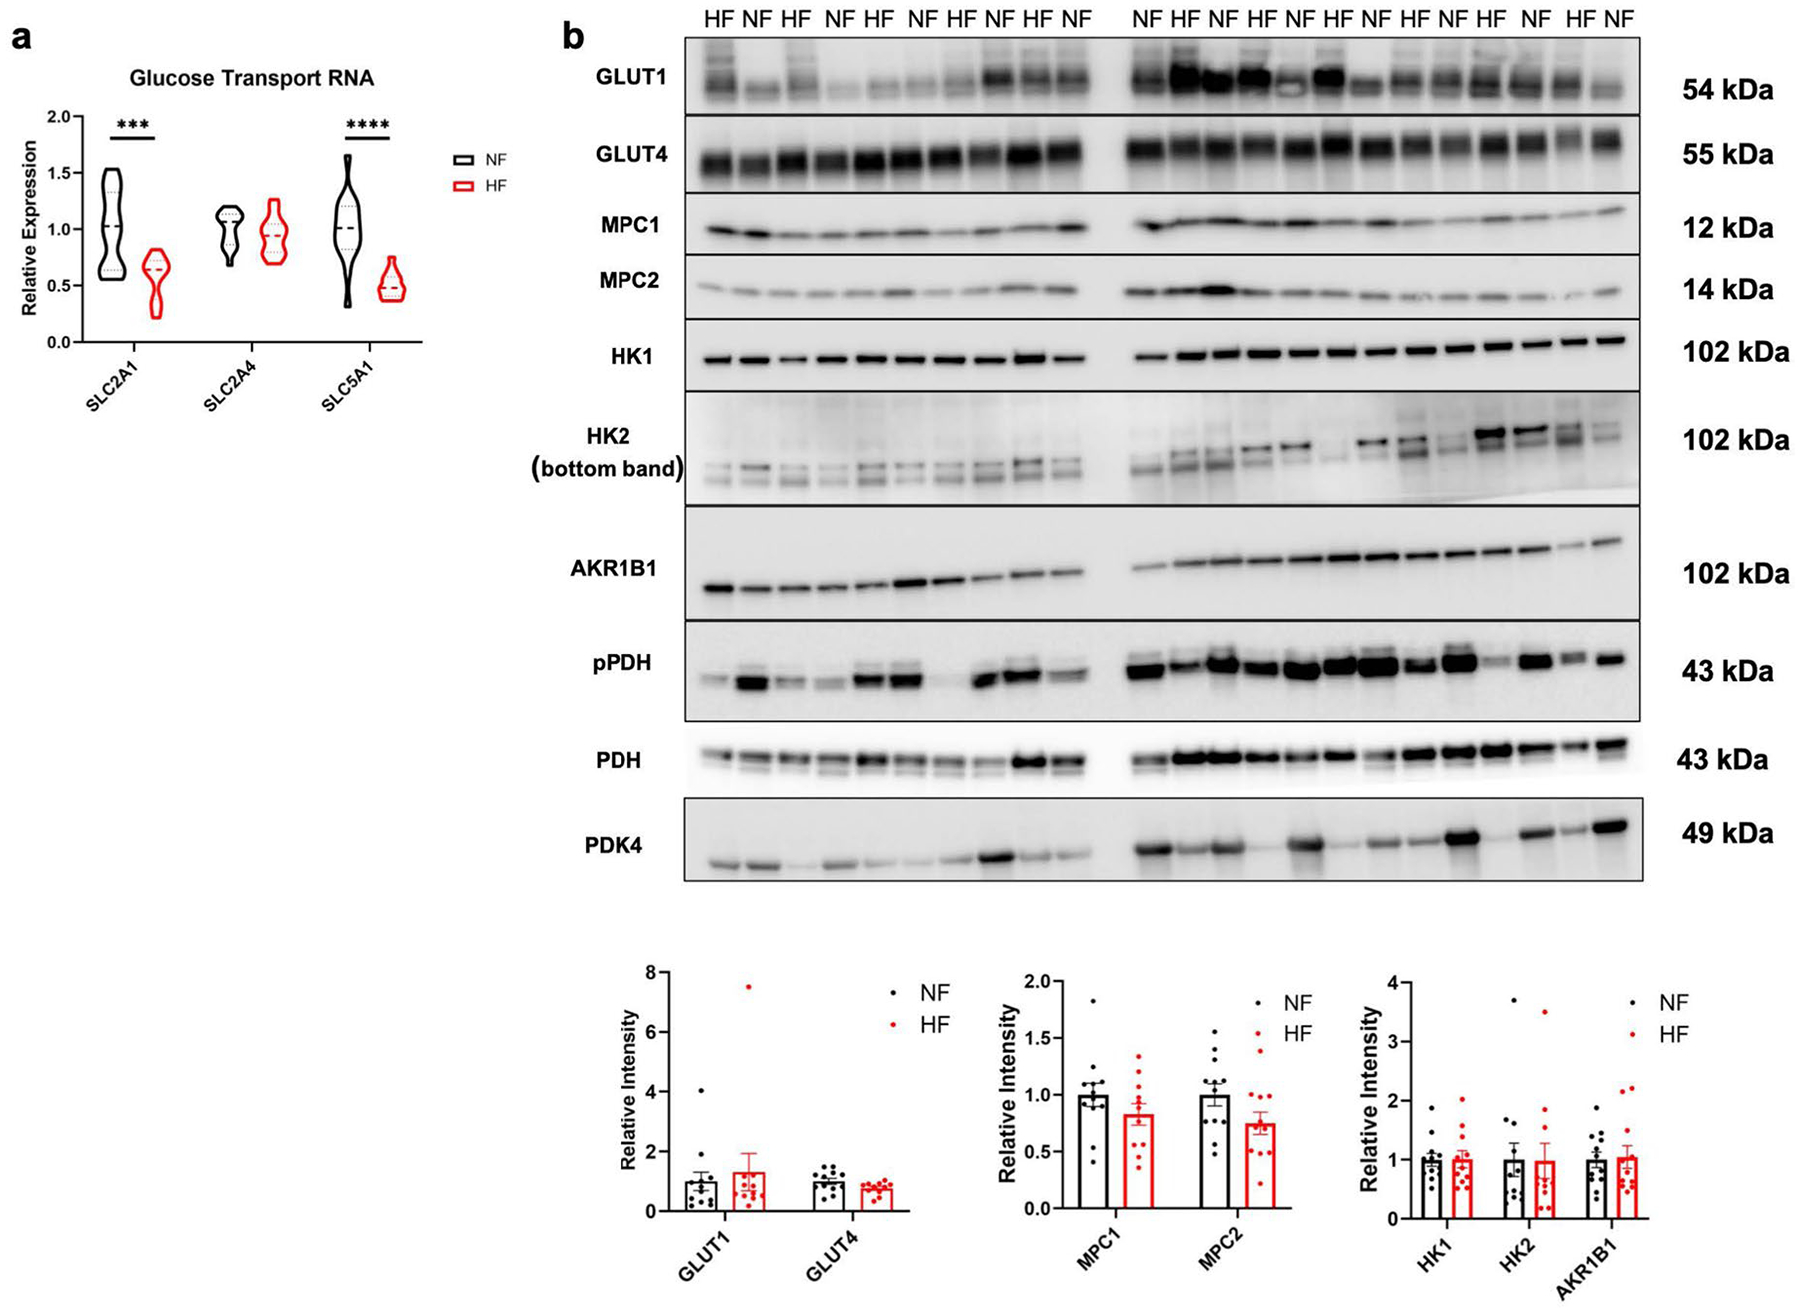
a) Relative mRNA expression of glucose transport genes. SLC2A1 FDR = 0.00196; SLC51A FDR = 5.88E-05. b) Western blots and quantification of various proteins from failing and non-failing tissues. Bars represent mean and standard error (N = 12 NF and N = 11 HF). ***P < 0.001, ****P < 0.0001. P-values were determined by FDR-corrected two-tailed t-test.
Extended Data Fig. 6 |.
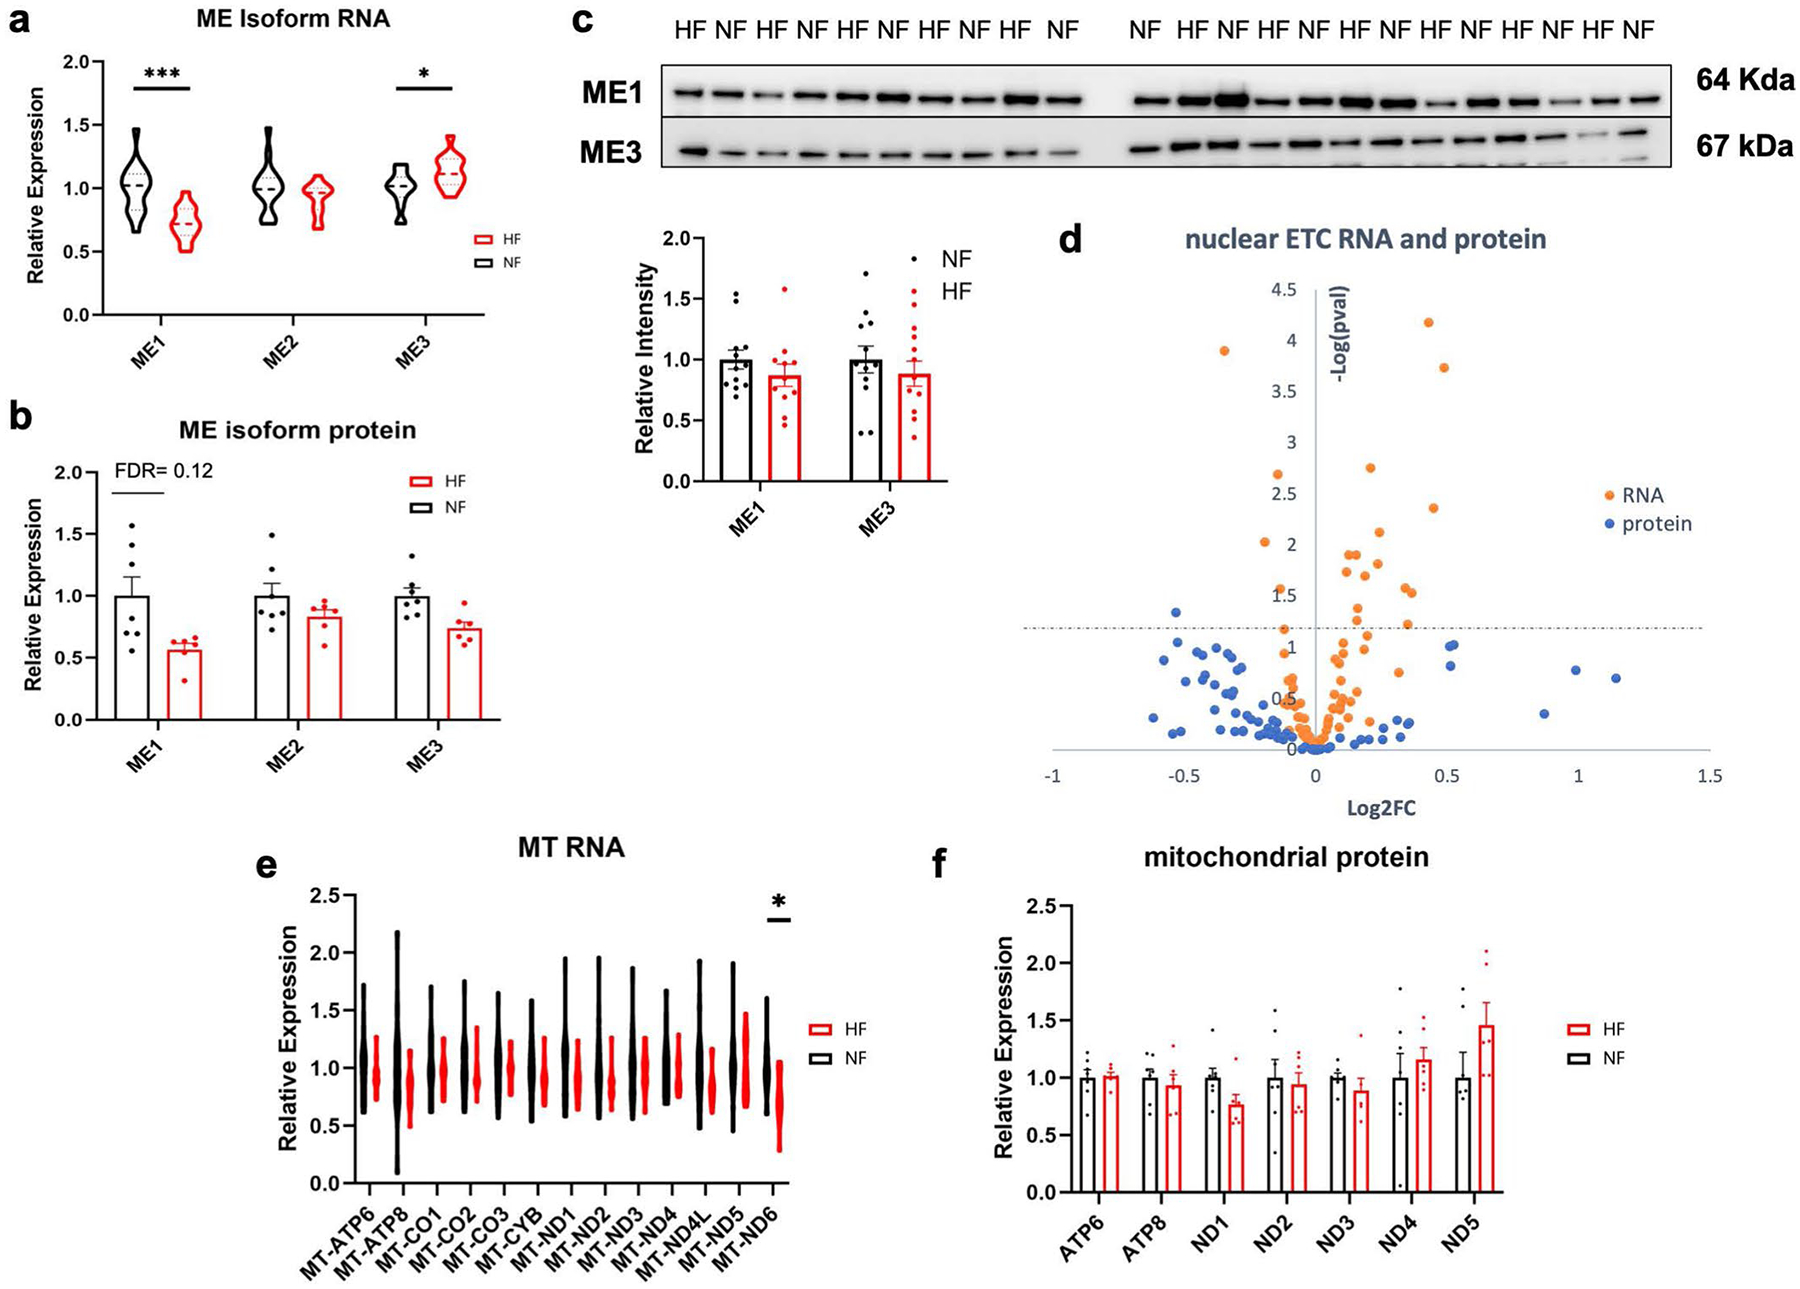
a, b) Relative mRNA (a) and protein (b) expression of malic enzyme isoforms. RNA: ME1 FDR = 0.000973; ME3 FDR = 0.0324. Bars represent mean and standard error (N = 7 NF and N = 6 HF). *P < 0.05, **P < 0.01, ***P < 0.001, ****P < 0.0001. P-values were determined by FDR-corrected two-tailed t-test. c) Western blots and quantification of ME1 and ME3 protein in failing and non-failing tissue. Bars represent mean and standard error (N = 12 NF and N = 11 HF). d) Volcano plot of differences in nuclear-encoded mRNAs (orange) and proteins (blue) composing the electron transport chain in cardiac tissue, comparing non-failing to failing samples. Y-axis represents FDR-corrected two-sided t-test between failing and non-failing samples. e, f) Relative expression of RNA (e) and protein (f) encoded by the mitochondrial genome. Bars represent mean and standard error (N = 7 NF and N = 6 HF). RNA: MT-ND6 FDR = 0.0296.
Extended Data Fig. 7 |.
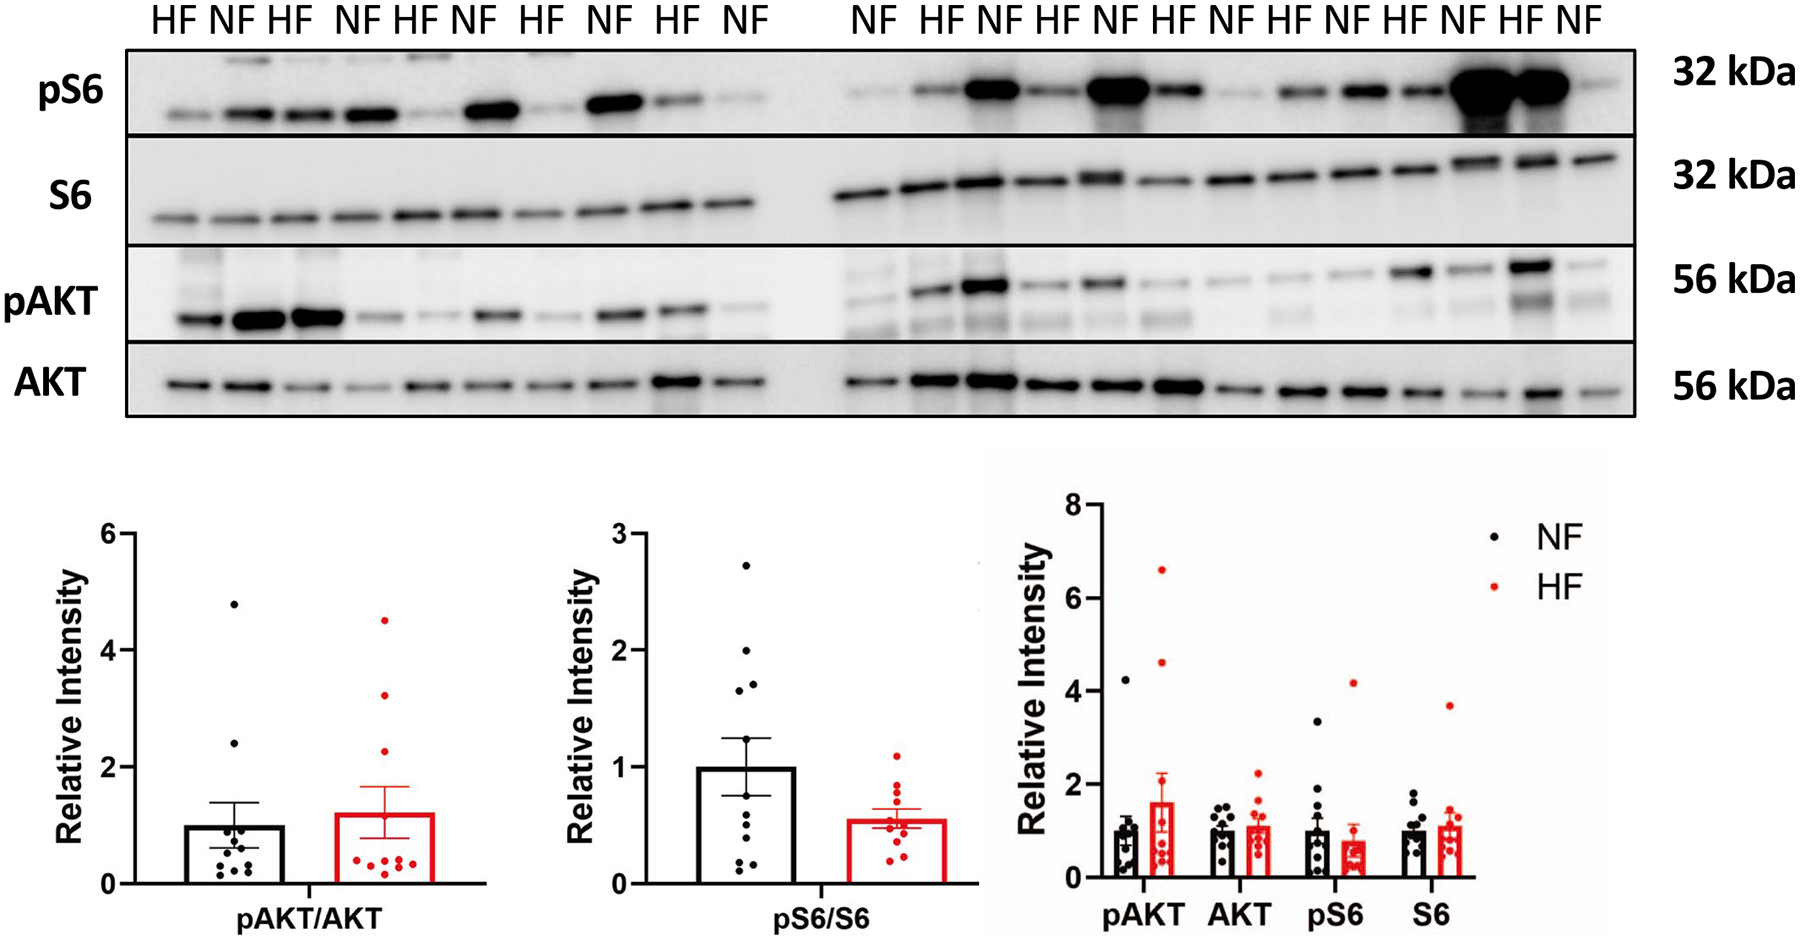
a) Western blots and quantification below of mTOR-related proteins from failing and non-failing tissues. Bars represent mean and standard error (N = 12 NF and N = 11 HF).
Extended Data Table 1 |.
Patient demographics and clinical information for cohort 1 (left), cohort 2 (middle) and combined cohorts (right).
| Cohort 1 NF (N=18) | Cohort 1 DCM (N=18) | Cohort 1 p-val | Cohort 2 NF (N=30) | Cohort 2 DCM (N=21) | Cohort 2 p-val | Combined NF (N=48) | Combined DCM (N=39) | Combine d p-val | |
|---|---|---|---|---|---|---|---|---|---|
| Age (yrs) | 51.0 ± 9.7 | 52.1 ± 10.9 | 0.76 | 56.3 ± 11.5 | 50.9 ± 11.6 | 0.11 | 54.3 ± 11.1 | 51.5 ± 11.3 | 0.2 |
| Male (%) | 8(44) | 10(55) | 15(48) | 12(57) | 23(48) | 22(56) | |||
| Caucasian (%) | 10(56) | 9(50) | 27(87) | 14(67) | 37(77) | 23(59) | |||
| Weight (kg) | 81.8 ± 19.4 | 80.8 ± 15.0 | 0.87 | 82.0 ± 20.0 | 82.0 ± 19.0 | 1.0 | 81.9 ± 19.8 | 81.5 ± 17.3 | 0.9 |
| Height (cm) | 167.1 ± 9.3 | 173.3 ± 10.3 | 0.071 | 170.9 ± 10.0 | 169.7 ± 9.3 | 0.7 | 169.5 ± 9.9 | 171.4 ± 10.0 | 0.4 |
| BMI (kg/m2) | 29.2 ± 6.1 | 26.8 ± 3.6 | 0.17 | 28.2 ± 7.5 | 28.2 ± 5.0 | 1.0 | 28.6 ± 7.0 | 27.6 ± 4.5 | 0.4 |
| Heart Weight (g) | 377.3 ± 80.8 | 475.9 ± 106.1 | 0.0044 | 365.5 ± 98.0 | 475.7 ± 139.9 | 0.009 | 369.9 ± 91.2 | 466.1 ± 125.8 | 0.0001 |
| LV Mass (g) | 216.2 ± 46.5 | 301.8 ± 81.4 | 0.0072 | 216.7 ± 51.7 | 297.6 ± 97.2 | 0.00044 | 216.6 ± 50.1 | 298.8 ± 93.1 | 8.1E-06 |
| LVMI | 107.5 ± 15.6 | 154.3 ± 43.8 | 0.0026 | 110.2 ± 19.8 | 150.9 ± 39.6 | 1.9E-05 | 109.4 ± 18.6 | 151.8 ± 40.8 | 9.8E-08 |
| LVEF (%) | 65.7 ± 8.2 | 10.5 ± 3.7 | 1.15E-23 | 64.3 ± 7.0 | 15.9 ± 6.1 | IE-29 | 64.8 ± 7.5 | 13.4 ± 5.8 | 5E-52 |
| LVEDD (cm) | 4.3 ± 0.2 | 7.6 ± 1.3 | 0.0015 | 4.2 ± 0.6 | 7.0 ± 1.1 | 2E-12 | 4.2 ± 0.6 | 7.2 ± 1.2 | 4E-16 |
| LVESD (cm) | 2.4 ± 0.4 | 7.0 ± 1.2 | 4.5E-05 | 2.7 ± 0.8 | 6.4 ± 1.2 | 2E-14 | 2.7 ± 0.5 | 6.6 ± 1.3 | 1E-20 |
| PW Thickness (cm) | 1.1 ± 0.2 | 0.86 + 0.2 | 0.10 | 1.0 ± 0.2 | 0.9 ± 0.2 | 0.01 | 1.0 ± 0.2 | 0.9 ± 0.2 | 0.001 |
| h/o VT/VF (%) | 0(0) | 11(61) | 0(0) | 14(67) | 0(0) | 25(64) | |||
| h/o ChrAfib (%) | 0(0) | 4(22) | 4(13) | 15(71) | 4(9) | 19(49) | |||
| h/o Htn (%) | 8(44) | 4(22) | 14(45) | 20(95) | 22(46) | 24(62) | |||
| Creatinine | 1.9 ± 2.3 | 1.5 ± 0.8 | 0.60 | 1.5 ± 1.2 | 1.0 ± 0.2 | 0.09 | 1.6 ± 1.7 | 1.2 ± 0.5 | 0.1 |
P values determined by two-sided Student’s t-test between combined cohort failing and nonfailing samples. LVMI, left ventricular mass index; LVEF, left ventricular ejection fraction; LVEDD, left ventricular end-diastolic diameter; LVESD, left ventricular end-systolic diameter; PW, posterior wall; h/o, history of; VT/VF, ventricular tachycardia/ventricular fibrillation; ChrAfib, chronic atrial fibrillation; Htn, hypertension.
Supplementary Material
Acknowledgements
We thank the Gift-of-Life Donor Program, Philadelphia, PA, who helped provide nonfailing heart tissue from unused donor hearts for this research. This work was supported by funding from National Heart, Lung, and Blood Institute (NHLBI; grant nos. R01-HL152446 to Z.A., T32 HL 7954-20 to E.F.), the Gund Family Fund to K.B.M., Department of Defense (grant no. W81XWH18-1-0503 to Z.A.), Edward Mallinckrodt Jr. Foundation to C.J., NHLBI (grant no. F30 HL142186-01A1) and the Blavatnik Family Foundation to D.M., grant no. R01GM132261 to N.W.S. and National Institutes of Health Diabetes Research Center (grant no. P30 DK019525). Human heart tissue was procured via support from the following grants: nos. R01 AG17022, R01 HL089847 and R01 HL105993 to K.B.M.
Footnotes
Competing interests
The authors declare no competing interests.
Supplementary information The online version contains supplementary material available at https://doi.org/10.1038/s44161-022-00117-6.
Data availability
The analyzed metabolomics data are available in the supplementary information files. The raw metabolomics data generated in the present study are available from the corresponding author upon reasonable request. The RNA-seq data are publicly available in the NCBI GEO repository with accession no. GSE14190. The proteomics data are available in the ProteomeXchange Consortium with the dataset accession no. PXD008934. Source data are provided with this paper.
References
- 1.Benjamin EJ et al. Heart Disease and Stroke Statistics. 2019 update: a report from the American Heart Association. Circulation 10.1161/CIR.0000000000000659 (2019). [DOI] [PubMed] [Google Scholar]
- 2.Shah KS et al. Heart failure with preserved, borderline, and reduced ejection fraction: 5-year outcomes. J. Am. Coll. Cardiol 70, 2476–2486 (2017). [DOI] [PubMed] [Google Scholar]
- 3.Jones NR, Roalfe AK, Adoki I, Hobbs FDR & Taylor CJ Survival of patients with chronic heart failure in the community: a systematic review and meta-analysis. Eur. J. Heart Fail 21, 1306–1325 (2019). [DOI] [PMC free article] [PubMed] [Google Scholar]
- 4.Ingwall JS & Weiss RG Is the failing heart energy starved? On using chemical energy to support cardiac function. Circ. Res 95, 135–145 (2004). [DOI] [PubMed] [Google Scholar]
- 5.Neubauer S The failing heart—an engine out of fuel. N. Engl. J. Med 356, 1140–1151 (2007). [DOI] [PubMed] [Google Scholar]
- 6.Hunter WG et al. Metabolomic profiling identifies novel circulating biomarkers of mitochondrial dysfunction differentially elevated in heart failure with preserved versus reduced ejection fraction: evidence for shared metabolic impairments in clinical heart failure. J. Am. Heart Assoc 5, e003190 (2016). [DOI] [PMC free article] [PubMed] [Google Scholar]
- 7.Ruiz M et al. Circulating acylcarnitine profile in human heart failure: a surrogate of fatty acid metabolic dysregulation in mitochondria and beyond. Am. J. Physiol. Heart. Circ. Physiol 313, H768–H781 (2017). [DOI] [PubMed] [Google Scholar]
- 8.Murashige D et al. Comprehensive quantification of fuel use by the failing and nonfailing human heart. Science 370, 364–368 (2020). [DOI] [PMC free article] [PubMed] [Google Scholar]
- 9.Diakos NA et al. Evidence of glycolysis up-regulation and pyruvate mitochondrial oxidation mismatch during mechanical unloading of the failing human heart: implications for cardiac reloading and conditioning. JACC Basic Transl. Sci 1, 432–444 (2016). [DOI] [PMC free article] [PubMed] [Google Scholar]
- 10.Chokshi A et al. Ventricular assist device implantation corrects myocardial lipotoxicity, reverses insulin resistance, and normalizes cardiac metabolism in patients with advanced heart failure. Circulation 125, 2844–2853 (2012). [DOI] [PMC free article] [PubMed] [Google Scholar]
- 11.Gupte AA et al. Mechanical unloading promotes myocardial energy recovery in human heart failure. Circ. Cardiovasc. Genet 7, 266–276 (2014). [DOI] [PMC free article] [PubMed] [Google Scholar]
- 12.Chen CY et al. Suppression of detyrosinated microtubules improves cardiomyocyte function in human heart failure. Nat. Med 24, 1225–1233 (2018). [DOI] [PMC free article] [PubMed] [Google Scholar]
- 13.Sweet ME et al. Transcriptome analysis of human heart failure reveals dysregulated cell adhesion in dilated cardiomyopathy and activated immune pathways in ischemic heart failure. BMC Genom. 19, 812 (2018). [DOI] [PMC free article] [PubMed] [Google Scholar]
- 14.Herrmann G & Decherd GM The chemical nature of heart failure. Ann. Intern. Med 12, 1233–1244 (1939). [Google Scholar]
- 15.Ingwall JS ATP and the Heart (Springer; New York, 2002). 10.1007/978-1-4615-1093-2 [DOI] [Google Scholar]
- 16.Neubauer S et al. Myocardial phosphocreatine-to-ATP ratio is a predictor of mortality in patients with dilated cardiomyopathy. Circulation 96, 2190–2196 (1997). [DOI] [PubMed] [Google Scholar]
- 17.Beer M et al. Absolute concentrations of high-energy phosphate metabolites in normal, hypertrophied, and failing human myocardium measured noninvasively with 31P-SLOOP magnetic resonance spectroscopy. J. Am. Coll. Cardiol 40, 1267–1274 (2002). [DOI] [PubMed] [Google Scholar]
- 18.Shen W et al. Progressive loss of myocardial ATP due to a loss of total purines during the development of heart failure in dogs: a compensatory role for the parallel loss of creatine. Circulation 100, 2113–2118 (1999). [DOI] [PubMed] [Google Scholar]
- 19.Bedi KC et al. Evidence for intramyocardial disruption of lipid metabolism and increased myocardial ketone utilization in advanced human heart failure. Circulation 133, 706–716 (2016). [DOI] [PMC free article] [PubMed] [Google Scholar]
- 20.Goldenberg JR et al. Preservation of acyl coenzyme a attenuates pathological and metabolic cardiac remodeling through selective lipid trafficking. Circulation 139, 2765–2777 (2019). [DOI] [PMC free article] [PubMed] [Google Scholar]
- 21.Chiu HC et al. A novel mouse model of lipotoxic cardiomyopathy. J. Clin. Invest 107, 813–822 (2001). [DOI] [PMC free article] [PubMed] [Google Scholar]
- 22.Pascual F, Schisler JC, Grevengoed TJ, Willis MS & Coleman RA Modeling the transition from decompensated to pathological hypertrophy. J. Am. Heart Assoc 7, e008293 (2018). [DOI] [PMC free article] [PubMed] [Google Scholar]
- 23.Ellis JM et al. Mouse cardiac acyl coenzyme a synthetase 1 deficiency impairs fatty acid oxidation and induces cardiac hypertrophy. Mol. Cell. Biol 31, 1252–1262 (2011). [DOI] [PMC free article] [PubMed] [Google Scholar]
- 24.Doenst T, Nguyen TD & Abel ED Cardiac metabolism in heart failure: implications beyond ATP production. Circ. Res 113, 709–724 (2013). [DOI] [PMC free article] [PubMed] [Google Scholar]
- 25.Lopaschuk GD, Karwi QG, Tian R, Wende AR & Abel ED Cardiac energy metabolism in heart failure. Circ. Res 128, 1487–1513 (2021). [DOI] [PMC free article] [PubMed] [Google Scholar]
- 26.Razeghi P et al. Metabolic gene expression in fetal and failing human heart. Circulation 104, 2923–2931 (2001). [DOI] [PubMed] [Google Scholar]
- 27.John S, Weiss JN & Ribalet B Subcellular localization of hexokinases I and II directs the metabolic fate of glucose. PLoS ONE 6, e17674 (2011). [DOI] [PMC free article] [PubMed] [Google Scholar]
- 28.Jesus AD et al. Hexokinase 1 cellular localization regulates the metabolic fate of glucose. Mol. Cell 82, 1261–1277.e9 (2022). [DOI] [PMC free article] [PubMed] [Google Scholar]
- 29.Liao R et al. Cardiac-specific overexpression of GLUT1 prevents the development of heart failure attributable to pressure overload in mice. Circulation 106, 2125–2131 (2002). [DOI] [PubMed] [Google Scholar]
- 30.Luptak I et al. Decreased contractile and metabolic reserve in peroxisome proliferator-activated receptor-alpha-null hearts can be rescued by increasing glucose transport and utilization. Circulation 112, 2339–2346 (2005). [DOI] [PubMed] [Google Scholar]
- 31.Li T et al. Defective branched-chain amino acid catabolism disrupts glucose metabolism and sensitizes the heart to ischemia–reperfusion injury. Cell Metab. 25, 374–385 (2017). [DOI] [PMC free article] [PubMed] [Google Scholar]
- 32.McCommis KS et al. Nutritional modulation of heart failure in mitochondrial pyruvate carrier-deficient mice. Nat. Metab 2, 1232–1247 (2020). [DOI] [PMC free article] [PubMed] [Google Scholar]
- 33.Fernández-Caggiano M et al. Analysis of mitochondrial proteins in the surviving myocardium after ischemia identifies mitochondrial pyruvate carrier expression as possible mediator of tissue viability. Mol. Cell. Proteom 15, 246–255 (2016). [DOI] [PMC free article] [PubMed] [Google Scholar]
- 34.Buchwald A et al. Alterations of the mitochondrial respiratory chain in human dilated cardiomyopathy. Eur. Heart J 11, 509–516 (1990). [DOI] [PubMed] [Google Scholar]
- 35.Karamanlidis G et al. Defective DNA replication impairs mitochondrial biogenesis in human failing hearts. Circ. Res 106, 1541–1548 (2010). [DOI] [PMC free article] [PubMed] [Google Scholar]
- 36.Jarreta D et al. Mitochondrial function in heart muscle from patients with idiopathic dilated cardiomyopathy. Cardiovasc. Res 45, 860–865 (2000). [DOI] [PubMed] [Google Scholar]
- 37.Lauzier B et al. Metabolic effects of glutamine on the heart: anaplerosis versus the hexosamine biosynthetic pathway. J. Mol. Cell. Cardiol 55, 92–100 (2013). [DOI] [PMC free article] [PubMed] [Google Scholar]
- 38.Li W et al. Delineation of substrate selection and anaplerosis in tricarboxylic acid cycle of the heart by 13C NMR spectroscopy and mass spectrometry. NMR Biomed. 24, 176–187 (2011). [DOI] [PMC free article] [PubMed] [Google Scholar]
- 39.Kasumov T et al. Mass isotopomer study of anaplerosis from propionate in the perfused rat heart. Arch. Biochem. Biophys 463, 110–117 (2007). [DOI] [PMC free article] [PubMed] [Google Scholar]
- 40.Martini WZ et al. Quantitative assessment of anaplerosis from propionate in pig heart in vivo. Am. J. Physiol. Endocrinol. Metab 284, E351–E356 (2003). [DOI] [PubMed] [Google Scholar]
- 41.Panchal AR et al. Partitioning of pyruvate between oxidation and anaplerosis in swine hearts. Am. J. Physiol. Heart. Circ. Physiol 279, H2390–H2398 (2000). [DOI] [PubMed] [Google Scholar]
- 42.B C et al. A 13C mass isotopomer study of anaplerotic pyruvate carboxylation in perfused rat hearts. J. Biol. Chem 272, 26125–26131 (1997). [DOI] [PubMed] [Google Scholar]
- 43.Lahey R et al. Enhanced redox state and efficiency of glucose oxidation with miR based suppression of maladaptive NADPH-dependent malic enzyme 1 expression in hypertrophied hearts. Circ. Res 122, 836–845 (2018). [DOI] [PMC free article] [PubMed] [Google Scholar]
- 44.Horton JL et al. The failing heart utilizes 3-hydroxybutyrate as a metabolic stress defense. JCI Insight 4, e124079 (2019). [DOI] [PMC free article] [PubMed] [Google Scholar]
- 45.Aubert G et al. The failing heart relies on ketone bodies as a fuel. Circulation 133, 698–705 (2016). [DOI] [PMC free article] [PubMed] [Google Scholar]
- 46.Carley AN et al. Short-chain fatty acids outpace ketone oxidation in the failing heart. Circulation 143, 1797–1808 (2021). [DOI] [PMC free article] [PubMed] [Google Scholar]
- 47.Li X et al. Circulating metabolite homeostasis achieved through mass action. Nat. Metab 4, 141–152 (2022). [DOI] [PMC free article] [PubMed] [Google Scholar]
- 48.Uddin GM et al. Impaired branched chain amino acid oxidation contributes to cardiac insulin resistance in heart failure. Cardiovasc. Diabetol 18, 86 (2019). [DOI] [PMC free article] [PubMed] [Google Scholar]
- 49.Sun H et al. Catabolic defect of branched-chain amino acids promotes heart failure. Circulation 133, 2038–2049 (2016). [DOI] [PMC free article] [PubMed] [Google Scholar]
- 50.Neinast M, Murashige D & Arany Z Branched chain amino acids. Annu. Rev. Physiol 81, 139–164 (2019). [DOI] [PMC free article] [PubMed] [Google Scholar]
- 51.Su B & Ryan RO Metabolic biology of 3-methylglutaconic acid-uria: a new perspective. J. Inherit. Metab. Dis 37, 359–368 (2014). [DOI] [PMC free article] [PubMed] [Google Scholar]
- 52.Fan L, Hsieh PN, Sweet DR & Jain MK Krüppel-like factor 15: regulator of BCAA metabolism and circadian protein rhythmicity. Pharmacol. Res 130, 123–126 (2018). [DOI] [PubMed] [Google Scholar]
- 53.Chaurasia B & Summers SA Ceramides—lipotoxic inducers of metabolic disorders. Trends Endocrinol. Metab 26, 538–550 (2015). [DOI] [PubMed] [Google Scholar]
- 54.Choi RH, Tatum SM, Symons JD, Summers SA & Holland WL Ceramides and other sphingolipids as drivers of cardiovascular disease. Nat. Rev. Cardiol 18, 701–711 (2021). [DOI] [PMC free article] [PubMed] [Google Scholar]
- 55.Yu J et al. Ceramide is upregulated and associated with mortality in patients with chronic heart failure. Can. J. Cardiol 31, 357–363 (2015). [DOI] [PubMed] [Google Scholar]
- 56.Yin W et al. Plasma ceramides and cardiovascular events in hypertensive patients at high cardiovascular risk. Am. J. Hypertens 10.1093/ajh/hpab105 (2021). [DOI] [PubMed] [Google Scholar]
- 57.Wittenbecher C et al. Lipid profiles and heart failure risk: results from two prospective studies. Circ. Res 128, 309–320 (2021). [DOI] [PMC free article] [PubMed] [Google Scholar]
- 58.Ji R et al. Increased de novo ceramide synthesis and accumulation in failing myocardium. JCI Insight 2, 82922 (2017). [DOI] [PMC free article] [PubMed] [Google Scholar]
- 59.Karliner JS Lysophospholipids and the cardiovascular system. Biochim. Biophys. Acta Mol. Cell Biol. Lipids 1582, 216–221 (2002). [DOI] [PubMed] [Google Scholar]
- 60.Law S-H et al. An updated review of lysophosphatidylcholine metabolism in human diseases. Int. J. Mol. Sci 20, 1149 (2019). [DOI] [PMC free article] [PubMed] [Google Scholar]
- 61.Frey AJ et al. LC-quadrupole/Orbitrap high-resolution mass spectrometry enables stable isotope-resolved simultaneous quantification and 13C-isotopic labeling of acyl-coenzyme A thioesters. Anal. Bioanal. Chem 408, 3651–3658 (2016). [DOI] [PMC free article] [PubMed] [Google Scholar]
- 62.Snyder NW et al. Production of stable isotope-labeled acyl-coenzyme A thioesters by yeast stable isotope labeling by essential nutrients in cell culture. Anal. Biochem 474, 59–65 (2015). [DOI] [PMC free article] [PubMed] [Google Scholar]
- 63.Zhu C & Guo W Detection and quantification of the giant protein titin by SDS-agarose gel electrophoresis. MethodsX 4, 320–327 (2017). [DOI] [PMC free article] [PubMed] [Google Scholar]
Associated Data
This section collects any data citations, data availability statements, or supplementary materials included in this article.
Supplementary Materials
Data Availability Statement
The analyzed metabolomics data are available in the supplementary information files. The raw metabolomics data generated in the present study are available from the corresponding author upon reasonable request. The RNA-seq data are publicly available in the NCBI GEO repository with accession no. GSE14190. The proteomics data are available in the ProteomeXchange Consortium with the dataset accession no. PXD008934. Source data are provided with this paper.


