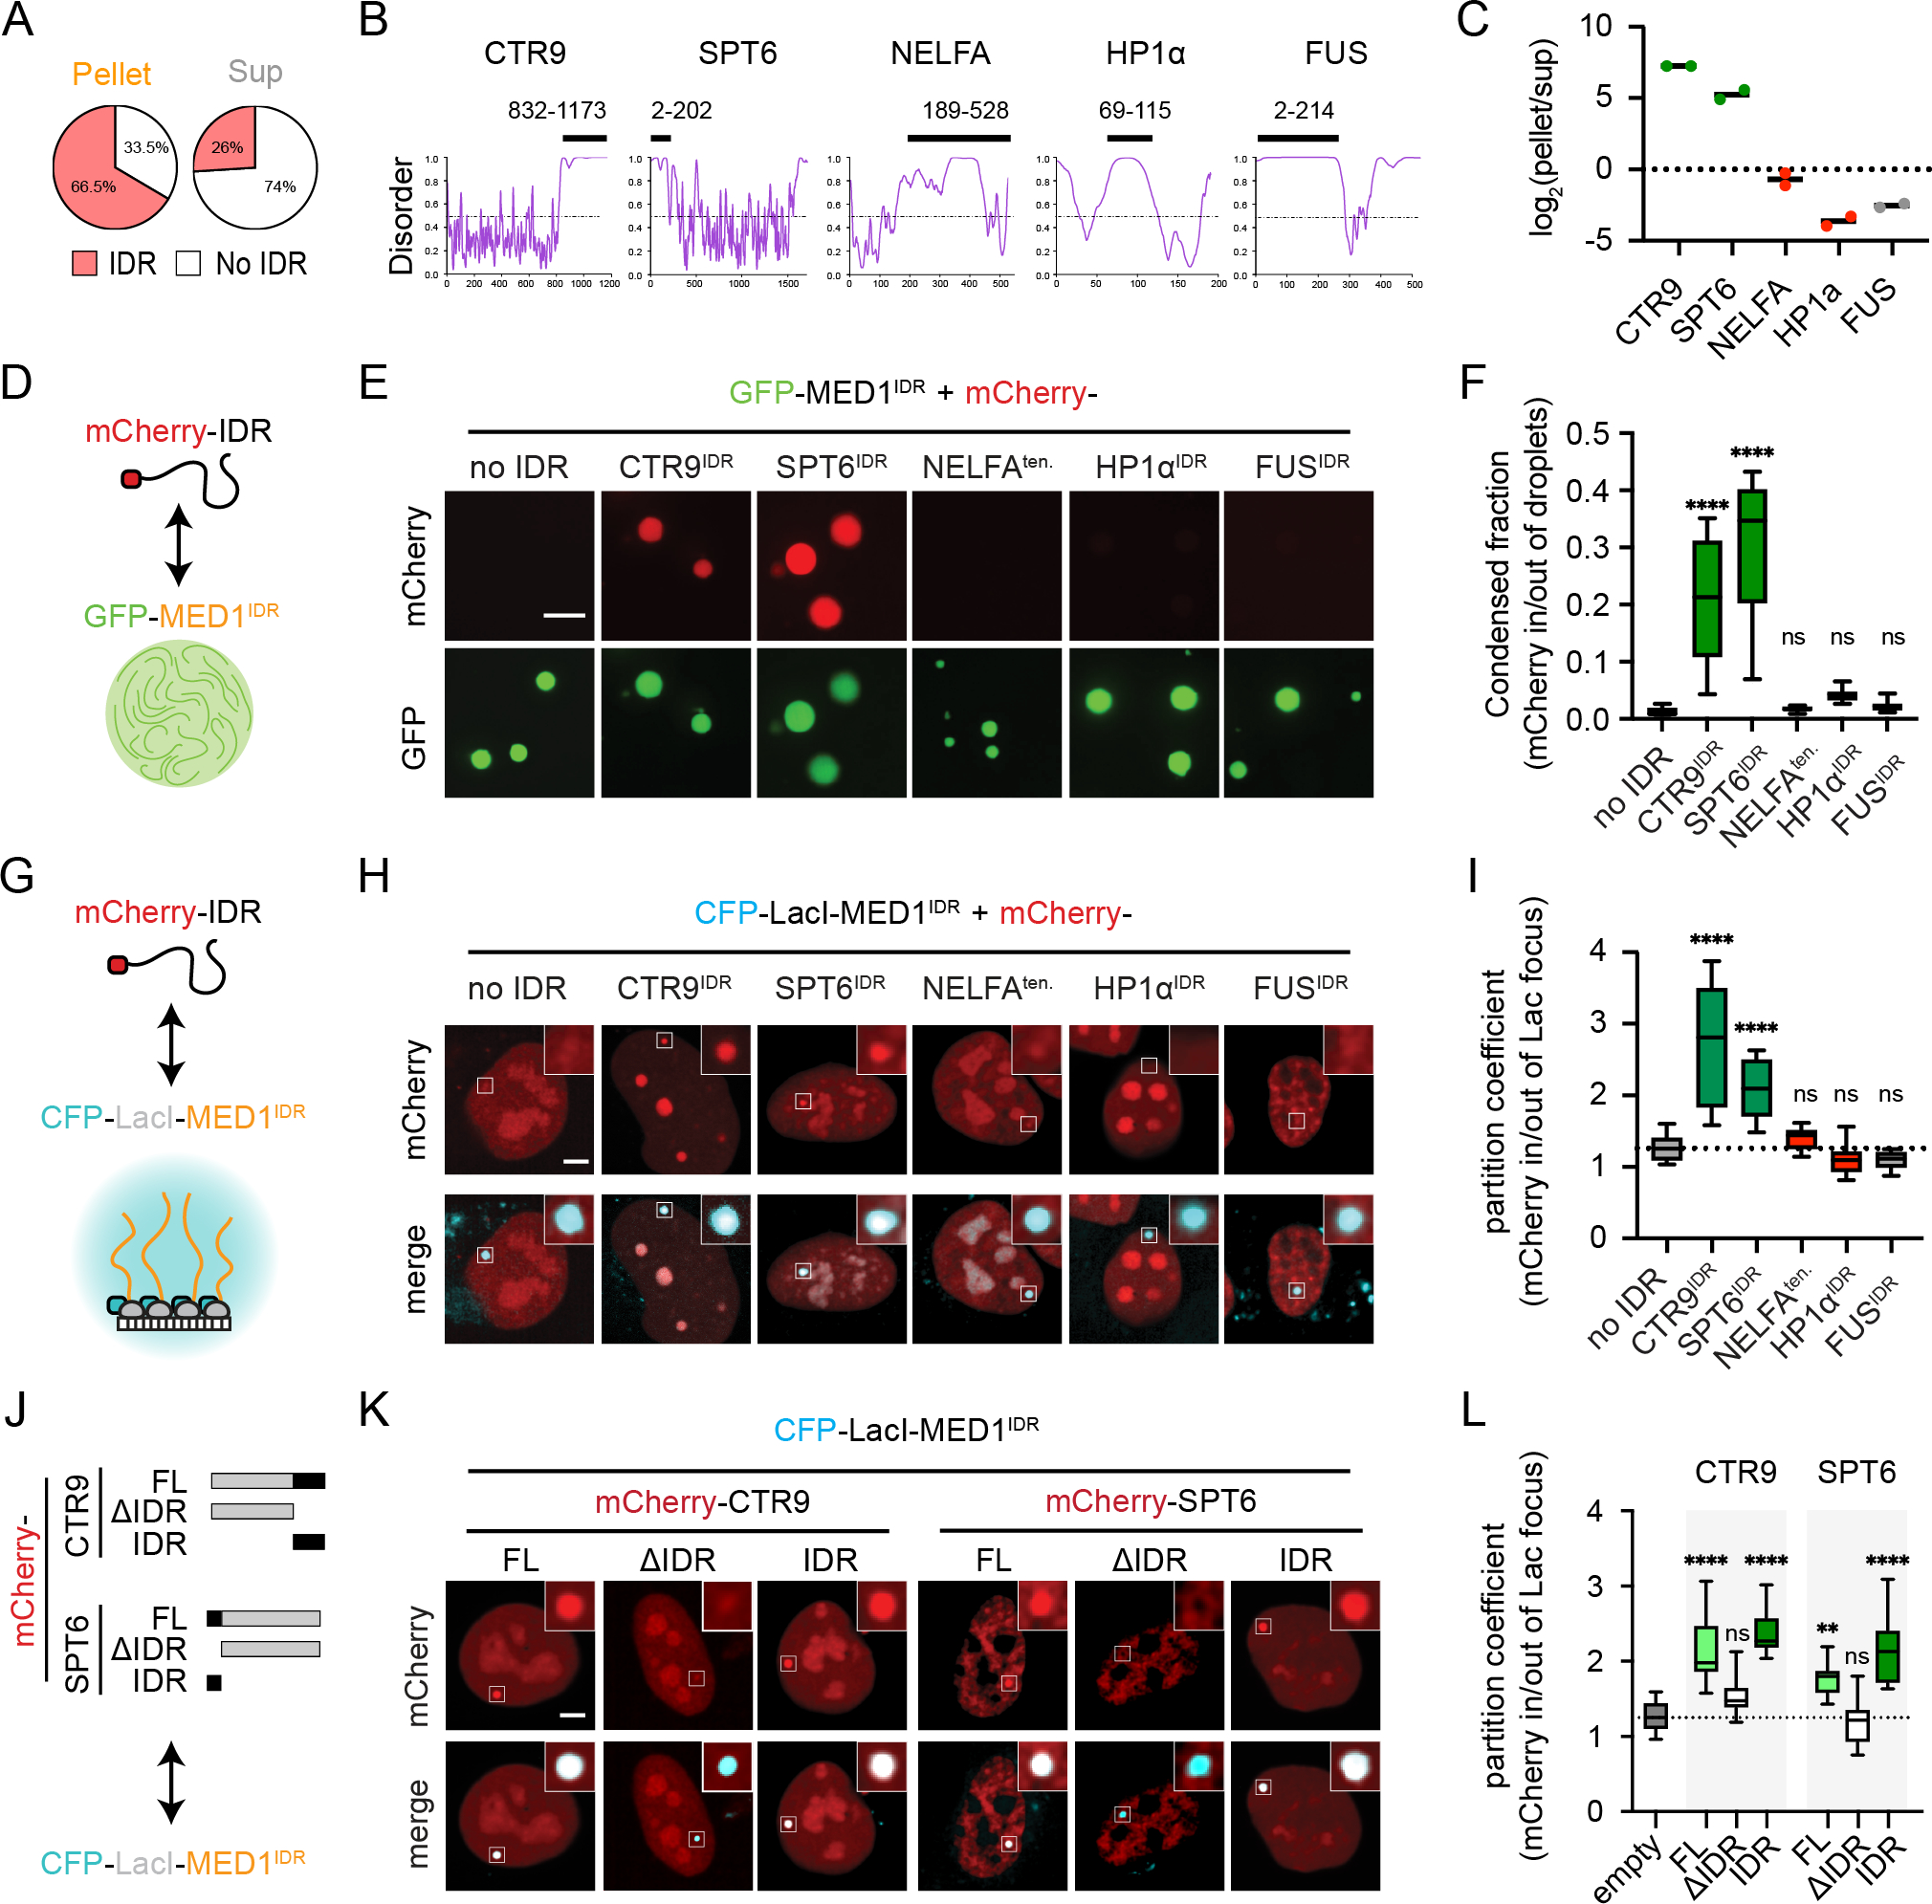
Figure 4. IDRs of partitioned factors are sufficient and necessary to recapitulate selective partitioning.

A) MED1IDR partitioned proteins are themselves enriched for IDRs.
B) PONDR plots (VSL2). Black bar highlights IDR purified as an mCherry fusion.
C) Proteomics data from MEDIDR pelleting experiments showing replicate log2(pellet/sup) values for each protein.
D) Cartoon depiction of purified mCherry-IDRs tested. See also Figure S4A.
E) Images of indicated mCherry-IDR partitioning into mEGFP-MED1IDR droplets in total RNA. Scale, 5μm. See also Figure S4B.
F) Boxplot(10–90%) of condensed fraction. p-values, one-way ANOVA vs no IDR control.
G) Cartoon depiction of experimental setup.
H) Images of mCherry-IDRs (top row) tested for partitioning into CFP-LacI-MED1IDR foci (bottom row). Scale, 5μm.
I) Boxplot(min-max) of partition coefficients for experiments in 4H. p-values, one-way ANOVA vs no IDR control.
J) Diagram of CTR9 and SPT6 truncations as mCherry fusions tested for partitioning into CFP-LacI-MED1IDR in Lac array cells.
K) Same as 4H, but for indicated mCherry fusions.
L) Same as 4I, but for indicated mCherry fusions.
See also Figure S4.
