

Abstract
Oxygen and carbon stable isotope ratios (18O/16O, 13C/12C, and 17O/16O) of CO2 have been crucial in helping us understand Earth and planetary systems. These ratios have also been used in medicine for the noninvasive diagnosis of diseases from exhaled breath and for quantifying biochemical or metabolic reactions and in determining the production area of agricultural products. The current method for measuring the stable isotope ratios of CO2 is primarily gas-source isotope ratio mass spectroscopy (IRMS). Due to the recent demand for isotopic microanalysis of carbonates and organic compounds, the sample size required for isotopic measurements has been reduced to approximately 2 nmol CO2 (equivalent to 0.2 μg CaCO3 and 24 ng carbon) by using high-precision IRMS. We report a novel method using tunable mid-infrared laser direct absorption spectroscopy (TILDAS) for sensitive measurements of 18O/16O and 13C/12C in subnanomolar CO2. This method can accurately measure 18O/16O and 13C/12C in CO2 with a repeatability of less than 0.03‰ (n = 28) in a range of 0.3 nmol (equivalent to 0.03 μg CaCO3 and 3.8 ng carbon) to 30 nmol. This is a sample size 1 order of magnitude smaller than currently available sensitive analytical techniques. In addition, the TILDAS system measures 17O/16O simultaneously with a repeatability of less than 0.06‰ (n = 28). Our method is a major advance in supersensitive CO2 stable isotopic analyses for various fields.
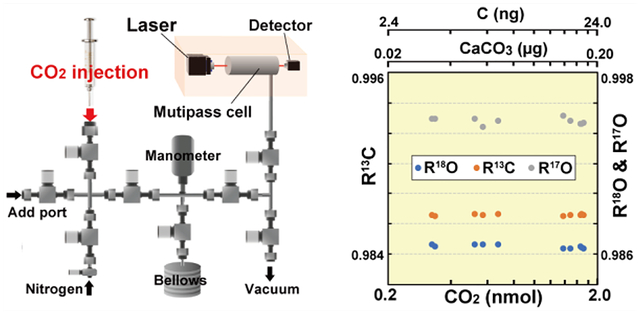
Graphical Abstract
INTRODUCTION
Light-element stable isotope ratios have contributed substantially to advancements in a wide range of research fields, such as Earth and planetary sciences, medical sciences, and food traceability. In particular, the stable isotope ratios of oxygen and carbon (δ18O and δ13C) in carbonates have been used to reconstruct detailed climate histories for Earth.1 The 17O-excess, based on the measurement of δ17O, in carbonates has recently been identified as having great potential as a new environmental proxy.2 The stable isotope ratios of CO2 in exhaled breath have also been used in medicine for the noninvasive diagnosis of diseases, such as H. pylori infection, and studying metabolic alterations in pathophysiology, as well as in metabolism research as tracers to quantify biochemical or metabolic reactions.3,4 Also, CO2 isotopes have been used for tracing the geographical origin of agricultural products, especially rice, beef, and honey, and of food materials to protect the brand names and intellectual property rights of these products.5 Gas-source isotope ratio mass spectroscopy (IRMS) has been the dominant method for measuring δ18O, δ13C, and δ17O in CO2 for decades. In response to the demand for isotopic microanalysis of carbonates and organic compounds, research has focused on achieving δ18O and δ13C measurements in submilligram samples using the modified continuous-flow IRMS system.6,7 Consequently, the IRMS detection limit has been reduced to approximately 2 nmol CO2 (equivalent to 0.2 μg CaCO3 and 24 ng carbon) with standard deviations of 0.1‰ for δ13C and 0.18‰ for δ18O.7 However, the IRMS systems have appeared to reach a limit of the signal/noise balance for high-sensitivity isotopic detection. Furthermore, there are operational difficulties, such as mass overlap of multiple CO2 isotopologues and contaminants, arduous sample preparation and purification, and the requirement for dedicated laboratory space and a high power requirements.
Laser spectroscopy has increasingly been used as an alternative to conventional IRMS for measuring isotopic ratios in atmospheric CO2, CO2 derived from carbonates, and exhaled CO2.8–12 Laser systems use the mid-IR spectral region, which allows highly sensitive isotopic measurements owing to the characteristic rotational–vibrational bands of the strong fundamental vibrations in this region. In addition, laser spectroscopy does not suffer from the mass overlap of multiple CO2 isotopologues because each CO2 isotopologue has specific absorption peaks. Laser isotope analysis systems are also cheaper, have lower power requirements, have a benchtop-sized footprint, and do not require high-purity gases or high-vacuum systems. Sakai et al. (2017)13 demonstrated the potential for high-sensitivity and high-precision detection of 18O/16O, 13C/12C, and 17O/16O of CO2 with sample sizes as low as 20 nmol CO2 (equivalent to 2 μg CaCO3 and 240 ng carbon) using a tunable mid-infrared laser direct absorption spectroscopy (TILDAS) system coupled with a high-precision CO2 preparation system.14
Herein, we report 18O/16O, 13C/12C, and 17O/16O analyses for subnanomolar levels of CO2 (nanogram quantities of CaCO3/carbon) by TILDAS coupled with a new high-precision CO2 gas preparation system, which provides a sensitivity of 1 order of magnitude higher than currently available analytical techniques.7,13,14 Our method is a major advance in supersensitive CO2 stable isotopic analyses for various fields.
EXPERIMENTAL SECTION
TILDAS.
Spectroscopic measurements were performed with a TILDAS (Aerodyne Research Inc.) system13 (Figure 1). The instrument used a quantum cascade laser (QCL) tuned to 2310 cm−1 to measure the absorption spectrum of the four CO2 isotopologues, 12C16O2, 12C17C16O, 12C18O16O, and 13C16O2 (Figure 2).
Figure 1.

Schematic of the subnanomolar CO2 measurement system. (a) The system, consisting of a CO2 injection unit, CO2 volume adjustment unit, and TILDAS system. (b) Detail of the leak-tight CO2 injection unit.
Figure 2.

Example of absorption spectrum for 1.7 nmol CO2 obtained by the TILDAS system with a 36 m absorption path at a total multipass absorption cell pressure of 15 Torr (2000 Pa). Background noise (designated by the blue range in the figure) had a transmittance of 6.59 × 10⁻⁴ on average and very stable noise spectrum shapes, which allowed for high-sensitivity analyses even when the dimensionality of the absorption spectra is low. The QCL scans the laser frequency range using 800 channels (point number) at a rate of 1.4 kHz, as shown on the horizontal axis.
In our modified instrument, the multipass absorption cell is miniaturized (approximately 200 mL in volume) and vacuum-tight (0.018 Torr/h; 2.4 Pa/h), allowing CO2 gas to be introduced into the pre-evacuated cell and isolated at a low pressure for highly stable and repeatable measurements. The optical path length in the multipass cell is 36 m long. The detector is a thermoelectrically cooled photovoltaic detector. The optical bench is thermally insulated and the temperatures of the bench and multipass absorption cell are regulated using air–liquid heat exchangers and cooling liquid supplied by a recirculating chiller. The inside of the optical bench housing is purged with N2 gas to prevent laser light absorption by ambient CO2 outside of the multipass cell. The careful stabilization of cell temperature and sample pressure allows samples to be measured at high precision and with high repeatability. Laser control, data acquisition, and real-time signal processing are performed by dedicated software. The output for each of the isotopologues is calculated by nonlinear least-squares fitting of its absorption spectrum, yielding a peak area that can be used to calculate the ratio with other peaks.
CO2 Preparation System for Measuring Stable Isotopes.
Our CO2 preparation system is divided into a CO2 injection unit and a CO2 gas volume adjustment unit, which enables us to deliver quantitative amounts of CO2 gas precisely to the TILDAS multipass cell (Figure 1). The CO2 preparation system consists of a stainless-steel vacuum-tight line with electromagnetic valves (Series 99, Parker Hannifin), a capacitance manometer (722B, MKS Instruments, Inc.), metering valves for N2 purging (SS-2MA, Seagelok), an actuator-driven bellows (14 to 98 mL), all of which are connected to a dry pump (DeoDry 15E, Kashiyama Industries Ltd.). All inner surfaces of the stainless-steel vacuum-tight line are mirror polished to eliminate gas adsorption (arithmetic mean roughness is approximately 0.04 μm). All components are controlled by custom-built LabView-based software.
The CO2 samples in glass vials are injected with a 5 μL leak-tight plunger-in-needle syringe (5BR-7, SGE Inc.) through the injection port (Figure 1b). The syringe needle is inserted through the top rubber lid of the sealed glass vial filled with 0.25 MPa CO2 (>99.9995%, Takachiho Chemical Co.) to collect the sample gas. The injection port, through which CO2 samples are injected into the preparation system, is sealed and isolated from room air via an 8 mm septum (Thermolite Septa, Restek), which is embedded in a stainless threaded closure that can maintain leak-tight conditions (0.003 Torr (0.39 Pa)/h). The amount of injected CO2 sample gas is measured with a capacitance manometer and expanded into the adjustable volume bellows, which allows the CO2 gas pressure to be controlled within ±0.001 Torr (0.13 Pa), if needed. The target amount of CO2 gas can then be expanded into the TILDAS multipass cell for stable isotopic analysis.
Steps in Spectroscopic Gas Measurement.
Each measurement is processed as follows. First, the multipass cell and the whole preparation line is flushed with N2 gas supplied from the metering valve (Figure 1), followed by vacuum pumping the cell and lines to 0.1 Torr using a dry pump. After flushing and vacuuming, the baseline signals are measured for 1 min. Then, the measured quantity of CO2 is introduced into the multipass cell, and introduced N2 through the capacitance manometer adjusts the total pressure (15 Torr) in the cell to obtain the pressure broadening condition (broadening of the absorption peaks) that enhances precision and stability of the absorption peaks calculation by increasing the number of laser scanning data points for each peak.13 After 3 min delay to allow complete mixing, the CO2 sample is measured at 1.4 kHz and integrated for 5 min resolution. After the measurement, the multipass absorption cell is again flushed with N2 from the metering valve and evacuated.
RESULTS AND DISCUSSION
Spectroscopic measurements were performed with a TILDAS system13 connected to our high-precision CO2 preparation system (Figure 1). The instrument used a QCL tuned to 2310 cm−1 to measure the absorption spectrum of the four CO2 isotopologues, 12C16O2, 12C17O16O, 12C18O16O, and 13C16O2 (Figure 2). The sensitivity and repeatability (the standard error) of the measurements were evaluated for various amounts of CO2 gas, from 0.3 to 30 nmol (equivalent to 0.03 to 3 μg of CaCO3 and 3.8 to 240 ng carbon) over 4 days; no measurements of the standard CO2 materials for instrumental and analytical calibrations were performed (Figure 3). We obtained the absorption peaks ratios for R18O (12C18O16O/12C16O2), R13C (13C16O2/12C16O2), and R17O (12C17O16O/12C16O2) that were normalized using the linear relationships between the pressure/temperature changes and the spectral absorption, as previously reported13 (Figure 3). All results were highly reproducible for all CO2 concentrations used in this study (0.3 to 30 nmol CO2) for the 4-day measurements. The repeatability of the isotopic ratios was 5.8 × 10⁻⁵ for R18O, 3.1 × 10⁻⁵ for R13C, and 1.8 × 10⁻⁴ for R17O (n = 28). We found slight residues of the linear temperature dependencies of R18O, R13C, and R17O after calibration13 (R2 values of the linear regression lines were all 0.998). The calibration of the residual temperature dependency improved the repeatability by about 2-fold (2.8 × 10⁻⁵ for R18O, 1.7 × 10⁻⁵ for R13C, and 5.5 × 10⁻⁵ for R17O (greater than 3-fold); n = 28). The standard errors of R18O and R13C decreased as the amount of CO2 decreased (Figure 3b), and were all better than approximately 0.001. In contrast, although the standard errors of R17O showed the same trend, they were much larger than those of R18O and R13C because the amplitude of the 12C17O16O absorption peak was much smaller than those of the 12C16O2, 12C18O16O, and 13C16O2 peaks (Figure 2). The small 12C17O16O peak could still be detected, suggesting that even smaller samples could be analyzed for R18O and R13C isotopologues. Therefore, our TILDAS with the high-precision CO2 preparation system could be used to determine R18O, R13C, and R17O for as low as 0.3 nmol CO2 (equivalent to 0.03 μg CaCO3 and 3.8 ng carbon) without calibration with standard materials, which is a sample size that is 1 order of magnitude smaller than that in the sensitive IRMS systems. Furthermore, because of this apparent repeatability over different days, it is possible to apply post- or preanalysis calculations that correlate the isotopic results to isotopic standards (VPDB scale), which is an important advance compared with IRMS CO2 isotope analyses.
Figure 3.

(a) R18O (12C18O16O/12C16O2), R13C (13C16O2/12C16O2), and R17O (12C17O16O/12C16O2) from the TILDAS system. Note these isotopic mixing ratios are using line strengths of high-resolution transmission molecular absorption database (HITRAN), which are scaled by standard isotopic abundances. The repeatabilities of R18O, R13C, and R17O between 0.3 and 3 nmol CO2 (equivalent to 0.03 to 3 μg CaCO3 and 3.4 to 240 ng carbon) are better than 0.028‰ for R18O, 0.017‰ for R13C, and 0.055‰ for R17O (n = 28) after normalization (24.5 °C and 10 Torr). All analyses were done in 4 days with no standard gas for scaling the isotopic values. (b) Standard errors of R18O, R13C, and R17O for a 5 min measurement at a total cell pressure of 15 Torr (2000 Pa) are <0.001 for R18O and R13C and <0.01 for R17O.
To evaluate whether a consistent isotope ratio offset is measurable between different CO2 gases with different isotope ratios, we measured an international CaCO3 standard (LSVEC) and two CaCO3 calibrated by the international scale (JNOC-86 and Bio-Std). CaCO3 was converted to CO2 gas by the cryogen-free CO2 preparation system as described in Sakai et al. (2017), then the CO2 gas was introduced from the add port (Figure 1) of our CO2 preparation system to TILDAS. All CO2 gases were derived from less than 3 μg of CaCO3 at 15.0 Torr total cell pressure measurement condition. The results showed a highly linear relationship between the accepted δ13CPDB and δ18OPDB values of the standards and R13C and R18O values measured by TILDAS (Figure 4 and Table 1). Regarding R17O, there are no international scale that can be used for the comparison but we observed a repeatability of ~0.05 (Table 1).
Figure 4.

Accepted δ18O and δ13C by IRMS values plotted against R18O and R13C by TILDAS.
Table 1.
R18O (12C18O16O/12C16O2), R13C (13C16O2/12C16O2), and R17O (12C17O16O/12C16O2) from the TILDAS Systema
| standard | n | CaCO3 (μg) | R18O | R18O ± 1S.E | R13C | R13C ± 1S.E | R17O | R17O ± 1S.E | cell pressure (Torr) | cell temp (K) | accepted δ18OVPDB | accepted δ13CVPDB |
|---|---|---|---|---|---|---|---|---|---|---|---|---|
| JNOC-86 | 2 | 2.1 | 0.9848 | 0.0015 | 1.0061 | 0.0016 | 1.1604 | 0.0507 | 15.11 | 297.614 | 0.538 | 2.595 |
| Bio-Std | 2 | 3.3 | 0.9794 | 0.0010 | 0.9972 | 0.0004 | 1.1441 | 0.0140 | 15.09 | 297.622 | −5.56 | −2.91 |
| LSVEC | 2 | 2.3 | 0.9596 | 0.0019 | 0.9651 | 0.0033 | 1.0536 | 0.0205 | 15.08 | 297.661 | −26.7 | −46.6 |
Cell pressure (Torr), cell temperature (K), and calculated isotopic values obtained from the TILDAS system are also shown. Accepted d values are reported by IRMS. R18O, R13C, and R17O are normalized at 15.0 Torr in total pressure and 297.65 K (24.5 °C) conditions.
Our method removes the analytical limitation for various high-resolution and high-sensitivity isotopic microanalyses. Coupled with microsampling using a high-resolution micro-milling system, which can achieve a spatial milling resolution of 1 μm,15 this method allowed us to perform micrometer-order special isotopic analyses of samples such as marine organisms, speleothems, meteorites, and crystal structures of rocks, which currently can only be performed by secondary ion mass spectrometry with a beam spot diameter of ~10 μm.16 Moreover, 17O/16O analysis is difficult by IRMS because the 12C17O16O isotopologue (~760 ppm) is masked by the much more abundant 13C16O2 isotopologue (~11000 ppm), which has the same nominal mass. However, conversion of CO2 to O2 for measuring O2, which has no natural interfering isobars, requires a complicated preparation process.17 Therefore, the direct measurement of 17O/16O ratios in nanomolar CO2 samples by our TILDAS system could be used as a new analytical strategy for samples such as meteorites that have limited quantities of material and large anomalies in 17O content compared with terrestrial materials.18 Furthermore, our method for subnanomolar detection of CO2 allows us to handle smaller sample sizes easily, offering an high-sensitivity alternative to CO2 isotopic analyses widely used for organic compounds, such as natural materials from Earth or other planets, agricultural products, and human cells, which are commonly measured by gas chromatography/IRMS and elemental analyzer/IRMS.5,19–21
CONCLUSIONS
In conclusion, there is a value in examining the weak absorption signals for the isotope detection based on precise sample gas handling. TILDAS, with a high-precision CO2 preparation system, provides a major advance in supersensitive CO2 stable isotope measurements in a number of fields.
ACKNOWLEDGMENTS
We gratefully acknowledge Asahiko Taira, Naohiko Ohkouchi (JAMSTEC), Masahiro Kawasaki (RIHN), Yutaka Matsumi (Nagoya University), David Nelson (Aerodyne Inc.), David Dettman (University of Arizona), Hitoshi Yanagida (Sanyu Plant Service Co., Ltd.), Akio Shimono, Toshihide Hikida (Shoreline Science Research Inc.), and Haruhisa Yano (Address Service Co., Ltd.) for their support in developing this system. Partial funding of this work was provided by grants-in-aid for scientific research by MEXT/JSPS (Nos. 23681006, 15H03756, and 15KK0179 to S.S., 20H00191 to A.K.), the National Institutes of Health U01CA240346 and R01CA177585 to D.Y. and P30CA023168 (Purdue Center for Cancer Research).
Footnotes
Complete contact information is available at: https://pubs.acs.org/10.1021/acs.analchem.1c05458
The authors declare no competing financial interest.
Contributor Information
Saburo Sakai, Biogeochemistry Research Center, Japan Agency for Marine-Earth Science and Technology, Yokosuka, Kanagawa 237-0061, Japan; Department of Medical Chemistry and Molecular Pharmacology, College of Pharmacy, Purdue University, West Lafayette, Indiana 47907, United States.
Taiga Otsuka, HORIBA Techno Service Co., Ltd., Kyoto 601-8510, Japan.
Shinichi Matsuda, Izumo Web., Ltd., Izumo, Shimane 693-0002, Japan.
Yoshiyuki Sakairi, Measurement Agency Co., Ltd., Kawaguchi-shi, Saitama 334-0013, Japan.
Ryoma Uchida, Measurement Agency Co., Ltd., Kawaguchi-shi, Saitama 334-0013, Japan.
Kazunori Sugahara, Kyoei Denko Co., Ltd., Okaya-shi, Nagano 394-0048, Japan.
Akihiro Kano, Department of Earth and Planetary Science, The University of Tokyo, Tokyo 113-0033, Japan.
Danzhou Yang, Department of Medical Chemistry and Molecular Pharmacology, College of Pharmacy, Purdue University, West Lafayette, Indiana 47907, United States.
REFERENCES
- (1).Zachos J; Pagani M; Sloan L; Thomas E; Billups K Science 2001, 292, 686–693. [DOI] [PubMed] [Google Scholar]
- (2).Passey BH; Hu H; Ji H; Montanari S; Li S; Henkes GA; Levin NE Geochim. Cosmochim. Acta 2014, 141, 1–25. [Google Scholar]
- (3).Gatta L; Ricci C; Tampieri A; Osborn J; Perna F; Bernabucci V; Vaira D Gut 2006, 55, 457–462. [DOI] [PMC free article] [PubMed] [Google Scholar]
- (4).Bütz DE; Casperson SL; Whigham LD J. Anal. At. Spectrom 2014, 29, 594. [Google Scholar]
- (5).Suzuki Y Anal. Sci 2021, 37, 189–199. [DOI] [PubMed] [Google Scholar]
- (6).Vonhof HB; de Graaf S; Spero HJ; Schiebel R; Verdegaal SJA; Metcalfe B; Haug GH Rapid Commun. Mass Spectrum 2020, 34, 34. [DOI] [PubMed] [Google Scholar]
- (7).Ishimura T; Tsunogai U; Gamo T Rapid Commun. Mass Spectram 2004, 18, 2883–2888. [DOI] [PubMed] [Google Scholar]
- (8).McManus JB; Nelson DD; Shorter JH; Jimenez R; Herndon S; Saleska S; Zahniser MJ Mod. Opt 2005, 52, 2309–2321. [Google Scholar]
- (9).Tuzson B; Mohn J; Zeeman MJ; Werner RA; Eugster W; Zahniser MS; Nelson DD; McManus JB; Emmenegger L Appl. Phys. B: Laser Opt 2008, 92, 451–458. [Google Scholar]
- (10).van Geldern R; Nowak ME; Zimmer M; Szizybalski A; Myrttinen A; Barth JAC; Jost HJ Anal. Chem 2014, 86, 12191–12198. [DOI] [PubMed] [Google Scholar]
- (11).Ghosh C; Banik GD; Maity A; Som S; Chakraborty A; Selvan C; Ghosh S; Chowdhury S; Pradhan M Sci. Rep 2015, 5, 8137. [DOI] [PMC free article] [PubMed] [Google Scholar]
- (12).Barker SL; Dipple GM; Dong F; Baer DD Anal. Chem 2011, 83, 2220–2226. [DOI] [PubMed] [Google Scholar]
- (13).Sakai S; Matsuda S; Hikida T; Shimono A; McManus JB; Zahniser M; Nelson D; Dettman DL; Yang D; Ohkouchi N Anal. Chem 2017, 89, 11846–11852. [DOI] [PMC free article] [PubMed] [Google Scholar]
- (14).Sakai S; Matsuda S Anal. Chem 2017, 89, 4409. [DOI] [PubMed] [Google Scholar]
- (15).Sakai S JAMSTEC-Reports 2009, 2009, 35–38. [Google Scholar]
- (16).Helser TT; Kastelle CR; Mckay JL; Orland IJ; Kozdon R; Valley JW Rapid Commun. Mass Spectram 2018, 32, 1781–1790. [DOI] [PubMed] [Google Scholar]
- (17).Barkan E; Luz B Rapid Commun. Mass Spectrum 2012, 26, 2733–2738. [DOI] [PubMed] [Google Scholar]
- (18).Clayton RN; Mayeda TK Earth Planet. Sci. Lett 1984, 67, 151–161. [Google Scholar]
- (19).Baczynski AA; Polissar PJ; Juchelka D; Schwieters J; Hilkert TA; Summons RE; Freeman KH Rapid Commun. Mass Spectram 2018, 32, 730–738. [DOI] [PubMed] [Google Scholar]
- (20).Ogawa NO; Nagata T; Kitazato H; Ohkouchi N Ultra-sensitive elemental analyzer/isotope ratio mass spectrometer for stable nitrogen and carbon isotope analyse. In Earth, Life, and Isotopes; Ohkouchi N, Tayasu I, Koba K, Eds.; Kyoto University Press: Kyoto, 2010; pp 339–353. [Google Scholar]
- (21).Tea I; Martineau E; Antheaume I; Lalande J; Mauve C; Gilard F; Barillé-Nion S; Blackburn AC; Tcherkez G Scientific Rep 2016, 6, 34251. [DOI] [PMC free article] [PubMed] [Google Scholar]