

Abstract
Differences in income between male and female academic physicians are well known, but differences for community physicians and career differences in income have not been quantified. We used earnings data from 80,342 full-time US physicians to estimate career differences in income between men and women. The differences in annual income between male and female physicians that we observed in our simulations increased most rapidly during the initial years of practice. Over the course of a simulated forty-year career, male physicians earned an average adjusted gross income of $8,307,327 compared with an average of $6,263,446 for female physicians—an absolute adjusted difference of $2,043,881 and relative difference of 24.6 percent. Gender differences in career earnings were largest for surgical specialists ($2.5 million difference), followed by nonsurgical specialists ($1.6 million difference) and primary care physicians ($0.9 million difference). These findings imply that over the course of a career, female US physicians were estimated to earn, on average, more than $2 million less than male US physicians after adjustment for factors that may otherwise explain observed differences in income, such as hours worked, clinical revenue, practice type, and specialty.
Women account for approximately half of all US medical school graduates and hold nearly 40 percent of US medical school faculty appointments, yet large differences in income between male and female physicians persist.1,2 Many studies using income data from surveys or administrative records and conducted in various settings, but most often in academic settings, have found that female physicians earn significantly less than their male counterparts even after gender differences in specialty, hours worked, years of experience, age, marital status, family structure, and research and clinical productivity are accounted for.3–15
The evolution of these gender differences in income over the course of physicians’ careers and among physicians who practice in community settings has not been investigated. Existing studies have documented gender differences in physicians’ starting salaries4 and have found that gaps may grow over time16 but have not quantified the absolute and relative career differences in earnings. The lack of income data at specific points along physicians’ careers has also precluded estimates of cumulative career differences in income between male and female physicians, both among physicians overall and within individual specialties.
Using income survey data from 80,342 physicians in the United States who practice in a variety of settings—including academic medical centers and community settings—and across specialties between 2014 and 2019, we analyzed how gender differences in income changed across physicians’ careers. We then estimated simulated cumulative career differences in income between male and female physicians after detailed adjustment for several factors that may influence income, including specialty, years of experience, hours worked, practice type and location, and measures of patient volume and clinical revenue. These factors were chosen to represent observable differences due to physician choice, gender discrimination, or both.
Study Data And Methods
DATA ON PHYSICIAN CHARACTERISTICS AND INCOME
We obtained data on physician characteristics from Doximity, an online professional network for physicians. The Doximity platform includes information about more than 70 percent of US physicians.17 Doximity has collected information on physician characteristics for both registered members and nonregistered physicians through multiple sources and data partnerships, including the National Plan and Provider Enumeration System, National Provider Identifier (NPI) Registry, American Board of Medical Specialties, state licensing boards, specialty societies, and collaborating medical schools and hospitals. The database includes information on physician age, gender, specialty, medical school attended (name and type of training—that is, allopathic or osteopathic), years in practice, and practice location. Details and validation of the database have been described elsewhere.14,18–22
Annual income data were obtained from Doximity, which has conducted an ongoing survey of physician income since 2014.23 Between 2014 and 2019, 80,342 US-based physicians completed the compensation survey, providing detailed information on total annual income, practice type (for example, hospital or group practice), and average hours worked per week. Physicians completed the survey to participate in the Doximity Career Navigator service, which provides physicians with salary comparisons. Importantly, although many prior studies of the gender difference in physician income have studied physicians in academic settings, the Doximity survey includes physicians in both community and academic settings (although the majority are in community settings) and across specialties.
Income was reported in categories with increments of $5,000 between $40,000 and $250,000 and increments of $25,000 between $250,000 and $1,000,000. Income was linked to data on physician characteristics, using each physician’s NPI. Analyses were limited to physicians reporting full-time practice. In all analyses, income was modeled as a continuous variable, in which the specific income for a physician was the top value within each income category. Details of the survey have been published elsewhere.24
Differences in income between male and female physicians may reflect not only differences in specialty, practice type, and hours worked but also the number of patients treated and the composition of services provided. Survey data were therefore linked, by physician NPI, to a 100 percent sample of Medicare claims data. For each NPI we calculated the annual total number of Medicare beneficiaries for whom the physician had billed any service, the total number of services performed by the physician for the Medicare fee-for-service population, and total Medicare billing. These measures were used as a proxy to adjust for potential gender differences in patient volume.
ANALYSIS
We compared characteristics of physicians in the study population with those in the general US physician workforce to assess the national representativeness of physicians responding to the income survey.
We then calculated both unadjusted and adjusted differences in income between male and female physicians by year of practice. Although the adjusted comparisons accounted for the fact that several factors that influence physician income may also be correlated with physician gender, we also provided unadjusted comparisons of income, as some of these factors—for example, specialty choice, type of practice, procedural mix, and clinical volume—might not be confounders but instead mediators through which gender biases in physician income develop (for example, social expectations may lead women to pick lower-paying specialties).5,7,25,26 In that sense, the adjusted comparison reflects a conservative estimate of wage differences.
To calculate adjusted differences in income between male and female physicians by year of practice, we estimated a multivariable generalized linear model with a log-link and gamma-distributed error term in which the dependent variable was physician income. The model included physician-level covariates including number of hours worked per week and annual amount billed to Medicare (proxy for clinical volume), physician specialty, Metropolitan Statistical Area indicator variables to adjust for time-invariant geographic factors that may be associated with gender differences in physician income, practice type (for example, solo practice, multispecialty practice, or hospital-based practice), year of survey completion (to account for trends in average income over time), and number of years since the completion of the last clinical training (residency or fellowship). The model estimated the average adjusted difference in income between male and female physicians by year of practice since the completion of clinical training. Absolute adjusted differences in income between male and female physicians were calculated for each year of practice, using the marginal standardization form of predictive margins.27 Log-link models were chosen to account for known skewness in income.28
Discounted cumulative career differences in income between male and female physicians were calculated by summing the difference in income at each year of practice. This approach to computing career differences in income relied on cross-sectional rather than longitudinal data on individual physicians’ salaries, an analogous approach to estimating life expectancy tables based on current or “period” cross-sectional mortality by age. We used a practice length of forty years and applied an annual discount rate of 3 percent.29 Career differences were estimated for physicians overall and according to three specialty groupings (primary care specialties, surgical specialties, and nonsurgical specialties; see online appendix exhibit A1 for categorization of specialties).30 Specialty-specific adjusted differences in career income were calculated by first estimating multivariable regression models with the covariates described above and variable interactions between the three specialty indicator variables and indicator variables for each year in practice, allowing for a formal test of interactions.
ADDITIONAL ANALYSES
In a series of sensitivity analyses, we first estimated similar multivariable regression models separately for each of the ten most common physician specialties in the study sample (anesthesiology, cardiology, emergency medicine, family medicine, internal medicine, obstetrics and gynecology, orthopedic surgery, pediatrics, psychiatry, and radiology). Second, to account for potential differences in how male and female physicians completed the survey, we set each given physician’s income as the midpoint, rather than top value, of each income category. Third, we estimated models using multivariable linear regression rather than a generalized linear model. Fourth, because the physician income surveys were geographically diverse but not nationally representative, we weighted the sample to be representative of the US physician workforce, allowing for nationally representative estimates of career differences in income between male and female physicians.
Fifth, we estimated regression models that only adjusted for physician specialty (that is, that excluded other covariates) to examine potential bias due to unmeasured confounders. That is, among full-time physicians, a similar-size income gender gap when additional covariates are not accounted for might suggest, although it does not prove, that those and other unobserved factors do not significantly explain income differences between male and female physicians. Sixth, physicians with lower Medicare patient workloads, whom our adjustment approach would identify as being less clinically active physicians, may have higher commercially insured patient workloads, which would be associated with higher, not lower, income. To address this concern, we conducted a sensitivity analysis that excluded the Medicare workload covariate from the multivariable regression. Finally, we estimated separate models for physicians employed by academic and nonacademic institutions to assess the possibility that gender differences in income may be smaller for academic physicians if there is greater salary standardization.
Analysis was performed using Stata, version 16. The study was approved by the Institutional Review Board at the RAND Corporation.
LIMITATIONS
This study had limitations. First, we used a cross-sectional or “period”-based approach to estimate simulated career differences in income, which may lead to different estimates than a longitudinal “cohort”-based approach that followed the same group of physicians over many years. If women were more likely to exit active medical practice, as suggested by other studies,31,32 our reported results may also underestimate the actual magnitude of the gender income gap. We were unable to observe the actual duration of practice between male and female physicians. Second, we used survey data on physician income. Physicians selected into the study sample, but the number of physicians surveyed was large, the sample was geographically diverse, and no meaningful differences were observed in a broad range of characteristics between surveyed physicians and the general US physician workforce. Moreover, the survey was used in a prior published study,24 and the estimated overall differences in income between male and female physicians in the current study were similar to those found in several prior studies using different physician income data.4,14,15 Our findings may be conservative if male physicians earn more than female physicians in the same income category. Comparable findings were also obtained when we reweighted results to be nationally representative.
Third, our survey included self-reported income data from practicing physicians. Fourth, our study was observational, and despite adjustment for several detailed factors that may explain gender differences in income, including self-reported hours worked, specialty, clinical revenue, and practice type, other confounders may remain. For example, other studies have found that female physicians receive fewer patient referrals or referrals for less profitable patients.33 We also were not able to adjust for cohort-specific differences, which other studies have found contribute to differences in income between male and female physicians.4,15 Although adjusting for Medicare billing has limitations, including underestimating the productivity of female physicians,26 we were unable to adjust for billing to commercial or other public payers or patient profitability, and the sensitivity analysis excluding the Medicare adjustment had similar results. Relatedly, prior studies have suggested that female physicians spend more time with patients, on average, than male physicians, with some evidence of improved communication and quality.26,34,35 These differences would not, however, explain gender differences in income in our study to the extent that measures of clinical revenue and patient volume were accounted for in our analysis. Finally, we were unable to examine physicians identifying as nonbinary or the intersectionality between race and gender, given data limitations.
Study Results
STUDY POPULATION
The study population from Doximity included 80,342 US physicians surveyed during 2014–19 (appendix exhibit A2).30 Of these, 60,075 (74.8 percent) were men and 20,267 (25.2 percent) were women. The mean and median numbers of years since completion of clinical training were 18.7 years and 17 years, respectively (range: 0–40). Overall, 30,784 (38.3 percent) physicians worked in group-based practices, and 22,183 (27.6 percent) worked in hospital-based practices. The mean and median numbers of hours worked per week were 57.5 and 59, respectively. The mean and median reported annual incomes were $345,936 and $299,999, respectively, with significant variation across specialties. Similar characteristics were observed between the study population and the general US physician workforce, including in the distribution of physician specialties analyzed (appendix exhibits A4 and A5) and in terms of patient and other physician characteristics (appendix exhibit A6).30
Compared with male physicians, female physicians had fewer years of experience (men, 19.5 years; women, 16.5 years), were slightly less likely to practice in hospital-based practices (27.9 percent versus 26.7 percent), and worked 2.5 fewer hours per week (58.2 versus 55.7). Female physicians also had lower unadjusted annual income ($371,370 versus $270,547), had lower adjusted annual income ($355,336 versus $312,799), had lower annual Medicare reimbursement ($261,766 versus $125,807), and billed services for fewer Medicare patients per year (413.8 versus 216.1) (appendix exhibit A2).30 (For all of these reported findings, p < 0:001 for difference.)
GENDER DIFFERENCES IN INCOME
▸ BY YEARS OF PRACTICE:
Male physicians had, on average, higher incomes than female physicians in the first year of practice (men, $169,716; women, $127,262; unadjusted difference, $42,454). This difference increased in absolute terms during the first ten years of practice and remained stable thereafter (exhibit 1). In the tenth year of practice, male physicians earned $90,298 more per year, on average.
EXHIBIT 1. Differences in income between male and female physicians in the US, by years of practice.

SOURCE Authors’ analysis of Doximity physician compensation survey data, 2014–19. NOTES The figure shows unadjusted and regression-adjusted yearly income differences across a forty-year career between male and female physicians, without regression adjustment. Each point represents mean differences in income for that year of practice, and the bars display 95% confidence intervals. Regression-adjusted differences adjust for differences in number of hours worked per week, Medicare billing, specialty, Metropolitan Statistical Area, practice type, year of survey completion, and number of years since last clinical training.
Differences in income between male and female physicians from early to later years of practice decreased after multivariable adjustment but remained large and statistically significant (exhibit 1). For example, after multivariable adjustment, female physicians earned, on average, $19,731 less per year than male physicians in the first year of practice (adjusted income for men, $168,687; women, $136,377). The absolute adjusted difference in income between male and female physicians increased by the tenth of year of practice ($41,062) and remained stable.
▸ BY SPECIALTY AND YEARS OF PRACTICE:
The income trajectories of US male and female physicians differed by specialty (appendix exhibit A3).30 For example, in the first year of practice, income differences between male and female physicians were similar in magnitude for primary care and other specialties (adjusted income difference between male and female physicians: $18,245 for primary care, $19,150 for nonsurgical specialties, and $21,999 for surgical specialties). However, by the tenth year of practice, the difference in income between male and female physicians was larger in surgical specialties (adjusted income difference, $54,777) than in nonsurgical specialties (adjusted income difference, $38,611) and primary care specialties (adjusted income difference, $30,245).
GENDER DIFFERENCES IN CAREER INCOME
Large career differences in income were observed between male and female physicians (exhibit 2). Among physicians overall, the simulated discounted net present value of career income for male physicians was $8,307,327, and for female physicians it was $6,263,446, after multivariable adjustment, for a career difference in adjusted income of $2,043,881. Simulated career income and differences in income between male and female physicians were lowest for primary care physicians (adjusted income for men, $6,004,188; women, $5,086,337; adjusted career difference, $917,851). Adjusted career income for nonsurgical specialists ranged from $6,702,641 for female physicians to $8,310,239 for male physicians, for a career difference in adjusted income of $1,607,598. Adjusted career incomes and differences in income between male and female physicians were largest for surgical specialists (adjusted income for men, $10,589,648; women, $8,108,026; adjusted career difference, $2,481,622).
EXHIBIT 2. Simulated career differences in income between male and female physicians in the US, by specialty.
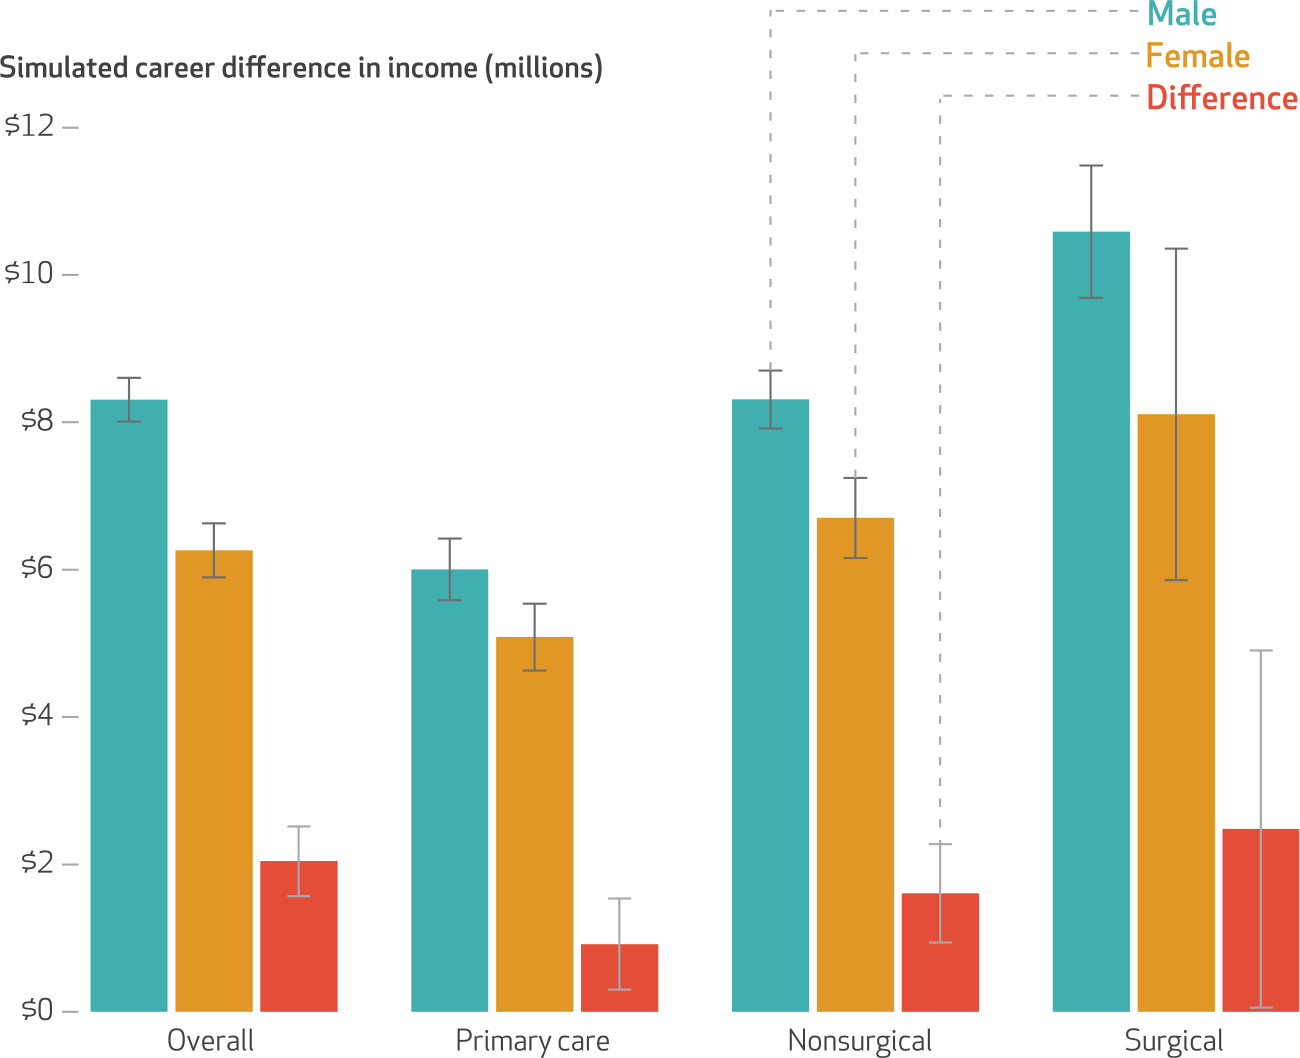
SOURCE Authors’ analysis of Doximity physician compensation survey data, 2014–19. NOTES The figure shows forty-year cumulative career income for male and female physicians and the difference between them for physicians overall and among three specialty categories. The bars display regression-adjusted incomes or regression-adjusted mean differences for male and female physicians, with associated 95% confidence intervals.
Simulated career differences in income between male and female physicians varied significantly across specialties (exhibit 3). For example, among the ten most common specialties that were separately considered, career differences in adjusted income between male and female physicians were smallest for emergency medicine physicians ($621,952) and largest for orthopedic surgeons ($1,530,006).
EXHIBIT 3. Simulated career differences in income between male and female physicians in the US for the ten most common specialties.

SOURCE Authors’ analysis of Doximity physician compensation survey data. NOTES The figure shows cumulative career differences in income between male and female physicians for the ten most common physician specialties in the study sample. The bars display the regression-adjusted mean difference in cumulative earnings between male and female physicians, with associated 95% confidence intervals.
ADDITIONAL ANALYSES
Similar findings were observed when multivariable linear models were estimated (appendix exhibit A8), when midpoint values instead of top values within income categories were used, when results were weighted to be representative of the US physician population (appendix exhibit A9), when unadjusted and adjusted income differences between male and female physicians income were compared—an analysis intended to examine potential bias due to unmeasured confounders (appendix exhibit A10), when the Medicare clinical workload covariate was excluded (appendix exhibit A11), when academic versus nonacademic physicians were compared (appendix exhibit A12), and when alternative discount rates were used (appendix exhibit A13).30
Discussion
Using income survey data from 80,342 full-time, US-based clinical physicians between 2014 and 2019, we analyzed career differences in income between male and female physicians. We found that over the course of a simulated career, male physicians earned approximately $2 million more than female physicians, even after detailed adjustment for factors that may otherwise explain gender differences in income, including specialty, years of experience, hours worked, practice type and location, and measures of patient volume and clinical revenue. In primary care specialties, male physicians earned approximately $900,000 more over their careers compared with female physicians, and in surgical specialties, male physicians earned approximately $2.5 million more than female physicians.
We further found that annual income differences accelerated during the initial years of practice and did not recover, which suggests that any potential reductions in nonclinical responsibilities that may occur later in women’s careers are not associated with recovery in annual income. Moreover, our findings suggest that later in their careers, despite working full time and having accumulated years of experience, women do not “catch up” in terms of income; early income disparities persist. Although we did find differences in hours worked, a commonly held reason for differences in compensation, these differences were small (a difference of 2.5 hours per week), and thus unlikely to contribute to the entirety of the observed differences in income.
To our knowledge, this study is the largest analysis of differences in income between male and female physicians and the first to calculate the cumulative career differences in income between these groups. In addition, although many prior studies of the gender difference in physician earnings have focused on academic settings, the majority of physicians surveyed in this study were community based and more representative of the overall US physician population. Although other data resources (for example, the Current Population Survey) allow for comparisons of salaries for community-based physicians, these data resources have relatively small sample sizes, do not include information on physician specialty, and do not report earnings for physicians whose earnings levels are above survey “top-coded” amounts. More detailed data, such as IRS tax record data, are not commonly available to researchers.36
These findings extend a deep literature from academic medicine that highlights differences in salary, professional advancement, and workplace treatment of male and female physicians, including receipt of large grants, start-up packages, mentor involvement, and leadership opportunities.18,37–39 Importantly, however, our analysis focused on full-time clinical physicians, the majority of whom were not in academic practice and for whom less extensive data exist on gender differences in income, particularly over a career. Among these full-time clinicians, gender bias on the part of employers, structural sexism, compensation models that disadvantage female practice styles, and different expectations of female physicians may be important drivers of the gender differences in income that were observed to start early in women’s careers and remain elevated over time.26 In addition to these more traditional explanations, other explanations may be needed to account for the fact that the gap in salary between male and female physicians widens in the first decade of practice. One possibility is that female physicians are less willing or able to change jobs or practices, limiting their bargaining power for a raise.40 Further, our unadjusted models produced larger differences in salary than the models that adjusted for specialty, practice type, and workload. To the extent that discrimination mediates these factors, our results underestimate gender-based differences in compensation.
The observed early acceleration of gender differences in income occurs at a time when many female physicians bear a disproportionate burden of domestic and family responsibilities, such as child rearing, or are facing fertility challenges including fertility treatment.41–45 Similar income trajectories have been observed for other highly trained professionals.46 In these other settings, policies such as family leave provisions and broader coverage of child care have been linked to reduced gender differences in income.47 In nonmedical settings, studies have found that salary negotiations contribute to differences in income and that transparency around salaries leads to lower income disparities.48–50 Increased salary transparency, protections via laws such as the Massachusetts Equal Pay Act, and systematic measurement and reporting of gender differences in income by organizations could help lessen income differences between female and male physicians. To the extent that gender differences in income early in women’s careers persist throughout their careers, policies that eliminate those differences early on may lead to reduced differences over time as well.
Conclusion
We found that female US physicians were estimated to earn, on average, more than $2 million less than male physicians during their careers after detailed adjustment for other factors that may explain gender differences in income. The magnitude of these career differences suggests that policies that address underlying causes of gender differences in physician income may have large economic impacts over the course of a career. ■
Supplementary Material
Acknowledgments
Support was provided by the National Institute on Aging (1K01AG061274, to Christopher Whaley). The funding source had no role in the design and conduct of the study; collection, management, analysis, and interpretation of the data; and preparation, review, or approval of the manuscript. Whaley reports consulting fees unrelated to this paper from Doximity. Anupam Jena reports receiving (in the past thirty-six months) consulting fees unrelated to this work from Bioverativ, Merck/Sharp/Dohme, Janssen, Edwards Life Sciences, Novartis, Amgen, Eisai, Otsuka Pharmaceuticals, Vertex Pharmaceuticals, Celgene, Sanofi Aventis, Precision Health Economics, and Analysis Group; stock in Doximity; income from hosting the podcast Freakonomics, M.D.; and income from book rights to Doubleday Books.
Contributor Information
Christopher M. Whaley, health care at the RAND Corporation in Santa Monica, California..
Tina Koo, health policy at the RAND Corporation..
Vineet M. Arora, University of Chicago, in Chicago, Illinois..
Ishani Ganguli, Division of General Internal Medicine and Primary Care, Brigham and Women’s Hospital and Harvard Medical School, both in Boston, Massachusetts..
Nate Gross, San Francisco, California..
Anupam B. Jena, Health Care Policy at Harvard Medical School..
NOTES
- 1.Association of American Medical Colleges. U.S. medical school applicants and students 1982–1983 to 2011–2012 [Internet]. Washington (DC): AAMC; 2012. [cited 2021 Oct 6]. Available from: https://www.exercise-science-guide.com/wp-content/uploads/U.S.-Medical-School-Applicants-and-Students-1982-83-to-2011-2012.pdf [Google Scholar]
- 2.Lautenberger DM, Dandar VM, Raezer CL, Sloane RA. The state of women in academic medicine: the pipeline and pathways to leadership. Washington (DC): Association of American Medical Colleges; 2014. [Google Scholar]
- 3.Baker LC. Differences in earnings between male and female physicians. N Engl J Med. 1996;334(15):960–4. [DOI] [PubMed] [Google Scholar]
- 4.Lo Sasso AT, Richards MR, Chou CF, Gerber SE. The $16,819 pay gap for newly trained physicians: the unexplained trend of men earning more than women. Health Aff (Millwood). 2011;30(2):193–201. [DOI] [PubMed] [Google Scholar]
- 5.Seabury SA, Chandra A, Jena AB. Trends in the earnings of male and female health care professionals in the United States, 1987 to 2010. JAMA Intern Med. 2013;173(18):1748–50. [DOI] [PubMed] [Google Scholar]
- 6.Hoff TJ. Doing the same and earning less: male and female physicians in a new medical specialty. Inquiry. 2004;41(3):301–15. [PubMed] [Google Scholar]
- 7.Ly DP, Seabury SA, Jena AB. Differences in incomes of physicians in the United States by race and sex: observational study. BMJ. 2016;353:i2923. [DOI] [PMC free article] [PubMed] [Google Scholar]
- 8.Jagsi R, Griffith KA, Stewart A, Sambuco D, DeCastro R, Ubel PA. Gender differences in the salaries of physician researchers. JAMA. 2012;307(22):2410–7. [DOI] [PubMed] [Google Scholar]
- 9.Jagsi R, Griffith KA, Stewart A, Sambuco D, DeCastro R, Ubel PA. Gender differences in salary in a recent cohort of early-career physician-researchers. Acad Med. 2013;88(11):1689–99. [DOI] [PMC free article] [PubMed] [Google Scholar]
- 10.Ash AS, Carr PL, Goldstein R, Friedman RH. Compensation and advancement of women in academic medicine: is there equity? Ann Intern Med. 2004;141(3):205–12. [DOI] [PubMed] [Google Scholar]
- 11.Weeks WB, Wallace TA, Wallace AE. How do race and sex affect the earnings of primary care physicians? Health Aff (Millwood). 2009;28(2):557–66. [DOI] [PubMed] [Google Scholar]
- 12.Ness RB, Ukoli F, Hunt S, Kiely SC, McNeil MA, Richardson V, et al. Salary equity among male and female internists in Pennsylvania. Ann Intern Med. 2000;133(2):104–10. [DOI] [PubMed] [Google Scholar]
- 13.DesRoches CM, Zinner DE, Rao SR, Iezzoni LI, Campbell EG. Activities, productivity, and compensation of men and women in the life sciences. Acad Med. 2010;85(4):631–9. [DOI] [PMC free article] [PubMed] [Google Scholar]
- 14.Jena AB, Olenski AR, Blumenthal DM. Sex differences in physician salary in US public medical schools. JAMA Intern Med. 2016;176(9):1294–304. [DOI] [PMC free article] [PubMed] [Google Scholar]
- 15.Lo Sasso AT, Armstrong D, Forte G, Gerber SE. Differences in starting pay for male and female physicians persist; explanations for the gender gap remain elusive. Health Aff (Millwood). 2020;39(2):256–63. [DOI] [PubMed] [Google Scholar]
- 16.Esteves-Sorenson C, Snyder J. The gender earnings gap for physicians and its increase over time. Econ Lett. 2012;116(1):37–41. [Google Scholar]
- 17.Doximity [Internet]. San Francisco (CA): Doximity. Press release, Doximity reaches 70 percent of all U.S. doctors, more than 800,000 licensed medical professionals; 2017. Feb 22 [cited 2021 Oct 6]. Available from:https://press.doximity.com/articles/doximity-reaches-70-percent-of-all-us-doctors [Google Scholar]
- 18.Jena AB, Khullar D, Ho O, Olenski AR, Blumenthal DM. Sex differences in academic rank in US medical schools in 2014. JAMA. 2015;314(11):1149–58. [DOI] [PMC free article] [PubMed] [Google Scholar]
- 19.Tsugawa Y, Jha AK, Newhouse JP, Zaslavsky AM, Jena AB. Variation in physician spending and association with patient outcomes. JAMA Intern Med. 2017;177(5):675–82. [DOI] [PMC free article] [PubMed] [Google Scholar]
- 20.Tsugawa Y, Jena AB, Figueroa JF, Orav EJ, Blumenthal DM, Jha AK. Comparison of hospital mortality and readmission rates for Medicare patients treated by male vs female physicians. JAMA Intern Med. 2017;177(2):206–13. [DOI] [PMC free article] [PubMed] [Google Scholar]
- 21.Tsugawa Y, Newhouse JP, Zaslavsky AM, Blumenthal DM, Jena AB. Physician age and outcomes in elderly patients in hospital in the US: observational study. BMJ. 2017;357:j1797. [DOI] [PMC free article] [PubMed] [Google Scholar]
- 22.Khullar D, Blumenthal DM, Olenski AR, Jena ABUS. U.S. immigration policy and American medical research: the scientific contributions of foreign medical graduates. Ann Intern Med. 2017;167(8):584–6. [DOI] [PubMed] [Google Scholar]
- 23.Doximity. Career Navigator Survey. San Francisco (CA): Doximity; 2019. [Google Scholar]
- 24.Whaley CM, Arnold DR, Gross N, Jena AB. Practice composition and sex differences in physician income: observational study. BMJ. 2020;370:m2588. [DOI] [PMC free article] [PubMed] [Google Scholar]
- 25.Seabury SA, Jena AB, Chandra A. Trends in the earnings of health care professionals in the United States, 1987–2010. JAMA. 2012;308(20):2083–5. [DOI] [PubMed] [Google Scholar]
- 26.Ganguli I, Sheridan B, Gray J, Chernew M, Rosenthal MB, Neprash H. Physician work hours and the gender pay gap—evidence from primary care. N Engl J Med. 2020;383(14):1349–57. [DOI] [PMC free article] [PubMed] [Google Scholar]
- 27.Williams R. Using the margins command to estimate and interpret adjusted predictions and marginal effects. Stata J. 2012;12(2):308–31. [Google Scholar]
- 28.Manning WG, Mullahy J. Estimating log models: to transform or not to transform? J Health Econ. 2001;20(4):461–94. [DOI] [PubMed] [Google Scholar]
- 29.Basu A, Ganiats TG. Discounting in cost-effectiveness analysis. In: Neumann PJ, Ganiats TG, Russell LB, Sanders GD, Siegel JE, editors. Cost-effectiveness in health and medicine. New York (NY): Oxford University Press; 2016. p. 277–88. [Google Scholar]
- 30.To access the appendix, click on the Details tab of the article online.
- 31.Hasan TF, Turnbull MT, Vatz KA, Robinson MT, Mauricio EA, Freeman WD. Burnout and attrition: expanding the gender gap in neurology? Neurology. 2019;93(23):1002–8. [DOI] [PubMed] [Google Scholar]
- 32.Cropsey KL, Masho SW, Shiang R, Sikka V, Kornstein SG, Hampton CL, et al. Why do faculty leave? Reasons for attrition of women and minority faculty from a medical school: four-year results. J Womens Health (Larchmt). 2008;17(7):1111–8. [DOI] [PubMed] [Google Scholar]
- 33.Sarsons H Interpreting signals in the labor market: evidence from medical referrals [Internet]. Cambridge (MA): Harvard University; 2017. Nov 28 [cited 2021 Oct 6]. (Job Market Paper). Available from: https://scholar.harvard.edu/files/sarsons/files/sarsons_jmp.pdf [Google Scholar]
- 34.Jefferson L, Bloor K, Birks Y, Hewitt C, Bland M. Effect of physicians’ gender on communication and consultation length: a systematic review and meta-analysis. J Health Serv Res Policy. 2013;18(4):242–8. [DOI] [PubMed] [Google Scholar]
- 35.Chen LM, Farwell WR, Jha AK. Primary care visit duration and quality: does good care take longer? Arch Intern Med. 2009;169(20):1866–72. [DOI] [PubMed] [Google Scholar]
- 36.Gottlieb J, Polyakova M, Rinz K, Shiplett H, Udalova V. Who values human capitalists’ human capital? Healthcare spending and physician earnings [Internet]. Washington (DC): Census Bureau; 2020. Jul [cited 2021 Oct 6]. (Working Paper No. CES-20-23). Available from: https://www.census.gov/library/working-papers/2020/adrm/CESWP-20-23.html [Google Scholar]
- 37.Blumenthal DM, Olenski AR, Yeh RW, DeFaria Yeh D, Sarma A, Stefanescu Schmidt AC, et al. Sex differences in faculty rank among academic cardiologists in the United States. Circulation. 2017;135(6):506–17. [DOI] [PMC free article] [PubMed] [Google Scholar]
- 38.Sege R, Nykiel-Bub L, Selk S. Sex differences in institutional support for junior biomedical researchers. JAMA. 2015;314(11):1175–7. [DOI] [PubMed] [Google Scholar]
- 39.Oliveira DFM, Ma Y, Woodruff TK, Uzzi B. Comparison of National Institutes of Health grant amounts to first-time male and female principal investigators. JAMA. 2019;321(9):898–900. [DOI] [PMC free article] [PubMed] [Google Scholar]
- 40.Arora VM. It is time for equal pay for equal work for physicians—paging Dr Ledbetter. JAMA Intern Med. 2016;176(9):1305–6. [DOI] [PubMed] [Google Scholar]
- 41.Jolly S, Griffith KA, DeCastro R, Stewart A, Ubel P, Jagsi R. Gender differences in time spent on parenting and domestic responsibilities by high-achieving young physician-researchers. Ann Intern Med. 2014;160(5):344–53. [DOI] [PMC free article] [PubMed] [Google Scholar]
- 42.Juengst SB, Royston A, Huang I, Wright B. Family leave and return-to-work experiences of physician mothers. JAMA Netw Open. 2019;2(10):e1913054. [DOI] [PMC free article] [PubMed] [Google Scholar]
- 43.Ly DP, Jena AB. Sex differences in time spent on household activities and care of children among US physicians, 2003–2016. Mayo Clin Proc. 2018;93(10):1484–7. [DOI] [PMC free article] [PubMed] [Google Scholar]
- 44.Ly DP, Seabury SA, Jena AB. Hours worked among US dual physician couples with children, 2000 to 2015. JAMA Intern Med. 2017;177(10):1524–5. [DOI] [PMC free article] [PubMed] [Google Scholar]
- 45.Marshall AL, Arora VM, Salles A. Physician fertility: a call to action. Acad Med. 2020;95(5):679–81. [DOI] [PubMed] [Google Scholar]
- 46.Bertrand M, Goldin C, Katz LF. Dynamics of the gender gap for young professionals in the financial and corporate sectors. Am Econ J Appl Econ. 2010;2(3):228–55. [Google Scholar]
- 47.Christofides LN, Polycarpou A, Vrachimis K. Gender wage gaps, “sticky floors,” and “glass ceilings” in Europe. Labour Econ. 2013;21:86–102. [Google Scholar]
- 48.Baker M, Halberstam Y, Kroft K, Mas A, Messacar D. Pay transparency and the gender gap [Internet]. Cambridge (MA):National Bureau of Economic Research; 2019. Nov [cited 2021 Oct 6]. (NBER Working Paper No. 25834). Available from: https://www.nber.org/system/files/working_papers/w25834/w25834.pdf [Google Scholar]
- 49.Blau FD, Kahn LM. The gender wage gap: extent, trends, and explanations. J Econ Lit. 2017;55(3):789–865. [Google Scholar]
- 50.Stevens K, Whelan S. Negotiating the gender wage gap. Ind Relat. 2019;58(2):141–88. [Google Scholar]
Associated Data
This section collects any data citations, data availability statements, or supplementary materials included in this article.