. 2023 Jan 25;12:e84477. doi: 10.7554/eLife.84477

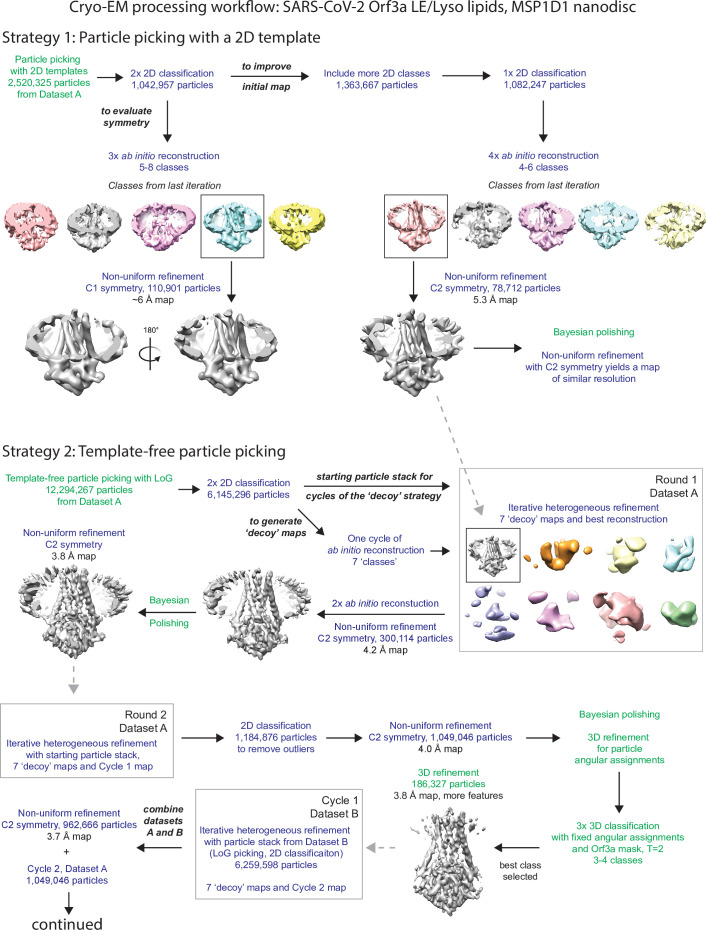
Figure 3. A narrow cavity detected in the SARS-CoV-2 Orf3a TM region is unlikely to conduct cations.

(A–C) Overall architecture of SARS-CoV-2 (CoV-2) Orf3a. (A) Cryo-EM map of dimeric CoV-2 Orf3a (dark and light pink), with density for lipids colored (orange, purple). (B) Three side views of CoV-2 Orf3a depicting dimeric architecture (dark and light pink) and key structural elements. (C) 2D topology of CoV-2 Orf3a. The region forming the cytosolic dimer interface is shown (yellow). (D) Inspection of the CoV-2 Orf3a TM region for a pore, depicted as the minimal radial distance from its center to the nearest van der Waals contact (HOLE program) (Smart et al., 1996). A region too narrow to conduct ions (white) and an aqueous vestibule (dark blue) are highlighted. (E) Radius of the pore (from D) as a function of the distance along the ion pathway. Dashed lines indicate the minimal radius that would permit a dehydrated ion. Blue and white colors follow (D). (F) Two layers of polar residues (1 and 2, cyan and orange) identified in the TM region, with a zoom in of each region. (G) Basic residues located in the aqueous vestibule (purple) with zoom in of the region. (H) Cutaway of the CoV-2 Orf3a molecular surface to view the aqueous vestibule is colored according to the electrostatic potential (APBS program) (Jurrus et al., 2018). Coloring: blue, positive (+10 kT/e) and red, negative (–10 kT/e).

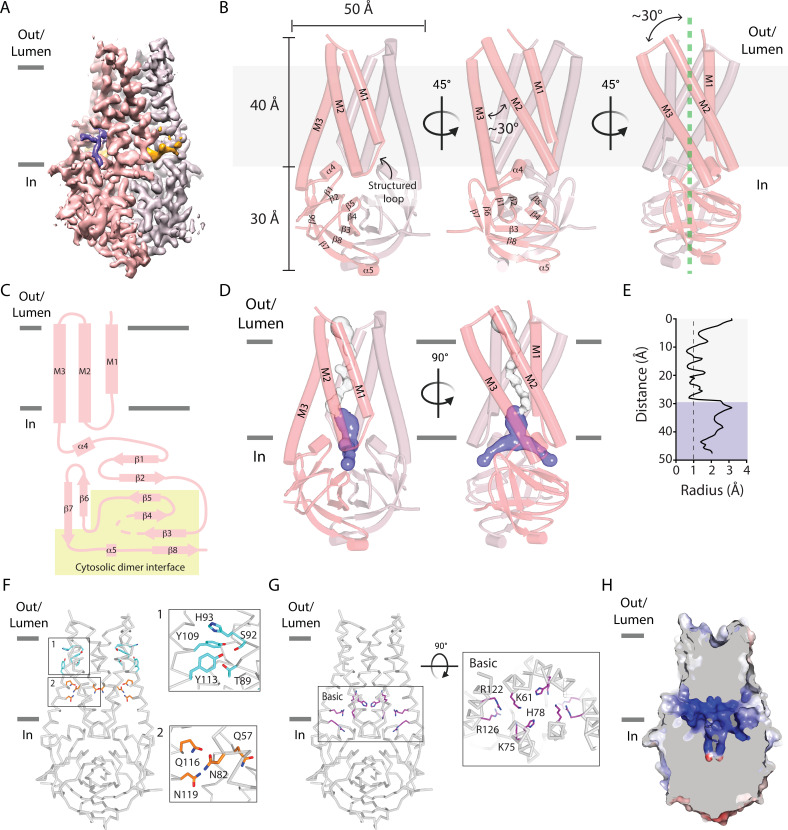
Figure 3.

Figure 3—figure supplement 1. Cryo-EM data processing workflow for SARS-CoV-2 Orf3a reconstituted in LE/Lysosomal MSP1D1-containing nanodiscs.

Figure 3—figure supplement 1.

Text color denotes that the program Relion 3.0 (green) or cryoSPARC v3.0 (dark blue) was used for the step of the workflow (Zivanov et al., 2018; Punjani et al., 2017; Punjani et al., 2020). Details are described in the Methods.
Figure 3—figure supplement 2. Cryo-EM data processing workflow for SARS-CoV-2 Orf3a reconstituted in LE/Lysosomal MSP1D1-containing nanodiscs, continued from Figure 3—figure supplement 1.

Figure 3—figure supplement 2.

Figure 3—figure supplement 3. Structural determination of SARS-CoV-2 Orf3a LE/Lyso (A–D) or PM (E–H) MSP1D1 nanodiscs.

Figure 3—figure supplement 3.

(A, E) Angular orientation distributions of particles used in the final reconstructions. The particle distributions are indicated by color shading, with blue to red representing low and high numbers of particles. (B, F) Fourier Shell Correlation (FSC) curves of the final 3D reconstructions. The overall map resolutions are 3.0 Å (B) or 3.4 Å (F) at the FSC cutoff of 0.143 (dotted line). (C, G) Local map resolutions were estimated using Relion 3.0 (SARS-CoV-2 Orf3a LE/Lyso) or Relion 3.1 (SARS-CoV-2 Orf3a PM) and are colored as indicated (Zivanov et al., 2018). (D, H) Model validation. Comparison of the FSC curves between the model and half map 1 (FSCwork), model and half map 2 (FSCfree) and model and full map (FSCfull) (Liebschner et al., 2019). (I) Crosslinking of SARS-CoV-2 Orf3a from isolated HEK293 cellular membrane to assess its oligomeric state. A band of the approximate molecular weight of a dimer (2mer) appears with the addition of bismaleimidohexane (BMH). (J) Superposition of the SARS-CoV-2 Orf3a LE/Lyso MSP1D1 (pink) and PM (blue) structures. (K) Superposition of the SARS-CoV-2 Orf3a PM MSP1D1 (blue) and previously published SARS-CoV-2 Orf3a (yellow orange, PDB ID: 7KJR) structures.
Figure 3—figure supplement 4. Cryo-EM data processing workflow for SARS-CoV-2 Orf3a reconstituted in PM MSP1D1-containing nanodiscs.

Figure 3—figure supplement 4.

Text color denotes the program Relion 3.1 (green) or cryoSPARC v3.0 (dark blue) (Zivanov et al., 2018; Punjani et al., 2017; Punjani et al., 2020). Details are described in the Methods. Low-resolution density for MSP1D1 is visible in maps of CoV-2 Orf3a but does not reach high-resolution (red circle).
Figure 3—figure supplement 5. Representative cryo-EM density for SARS-CoV-2 Orf3a and SARS-CoV-1 Orf3a structures.

Figure 3—figure supplement 5.

(A–D) Four representative areas of cryo-EM density (blue mesh) from the four Orf3a datasets with structures represented as sticks and colored as follows: SARS-CoV-2 Orf3a LE/Lyso MSP1D1-containing nanodisc (tan), SARS-CoV-2 Orf3a PM MSP1D1-containing nanodisc (pink), SARS-CoV-2 LE/Lyso Saposin A-containing nanodisc (dark purple), SARS-CoV-1 Orf3a LE/Lyso MSP1D1-containing nanodisc (green).