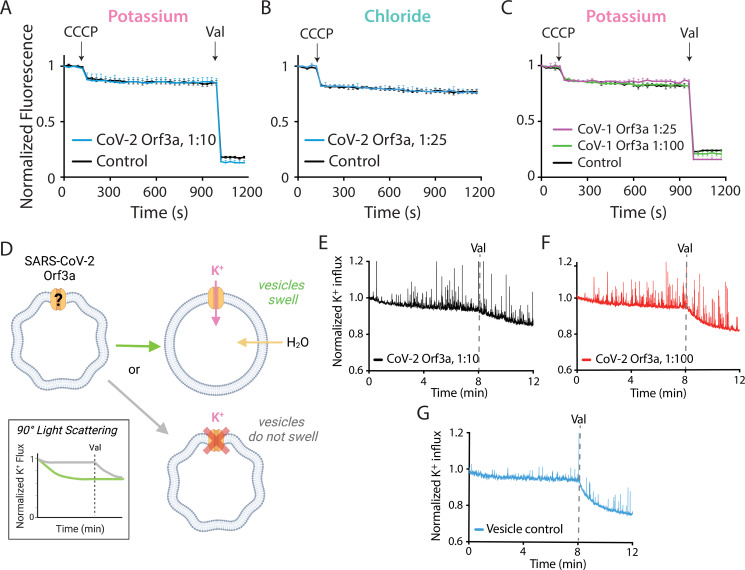
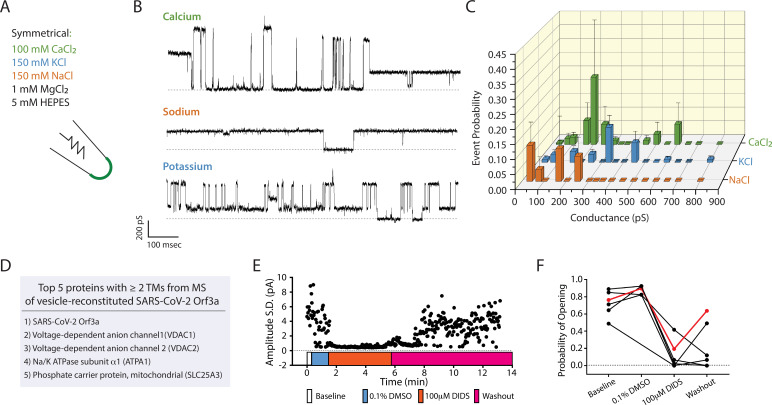
Figure 5. SARS-CoV-2 Orf3a does not elicit ion flux or conductances in a vesicle-reconstituted system.
(A) Schematic of the ACMA-based fluorescence flux assay (Zhang et al., 1994; Heginbotham et al., 1998; Miller and Long, 2012; Kane Dickson et al., 2014). A K+ (pink) or Cl- (blue) gradient is generated by reconstitution and dilution into an appropriate external salt solution (K+ efflux: 150 KCl in, 150 NMDG-Cl out; Cl- flux: 110 Na2SO4 in, 125 NaCl out; in mM). If CoV-2 Orf3a conducts K+ or Cl- ions, then the addition of the protonophore carbonyl cyanide m-chlorophenyl hydrazone (CCCP) will drive H+ (green) influx. ACMA is quenched and sequestered in vesicles at low pH, resulting in loss of ACMA fluorescence. Valinomycin (Val), a K+ permeable ionophore, is added to the end of the K+ flux assay to empty all vesicles. Created with Biorender.com. (B–C) K+ (n=4) (B) or Cl- (n=4) (C) flux is not observed in SARS-CoV-2 (CoV-2) Orf3a2x-STREP-reconstituted vesicles (blue) as compared with the empty vesicle control (black, n=4) using vesicles reconstituted at a 1:100 (wt:wt) protein to lipid ratio. CCCP and Val are added as indicated (arrows). Error is represented as SEM. (D) Probability of observing an open event in a CoV-2 Orf3a2x-STREP-reconstituted proteoliposome patch with vesicle reconstituted at a 1:100 protein to lipid ratio. NaCl, n=27; KCl, n=32, and CaCl2, n=105. Error is represented as SEM.


