

Abstract
La Cueva del Viento is a volcanic lava tube located in Tenerife Island (Canary Islands, Spain). Its touristic section, 180 m long, receives more than 28,200 visitants each year. According to the European and Spanish legislation, a radon monitoring program is required to minimize the radon exposition of workers, tourists, and cavers. In this work, we studied the radon concentration dynamics in the touristic section of the cave for ca. 1 year, using both passive and active radon detectors. Pluviometry and external air temperature played an important role in the seasonal and daily variations of indoor radon concentrations. Daily fluctuations during the dry season were analyzed using time series (Box‐Jenkins methodology) and frequency analysis (Fourier and Wavelet transforms) methods. The experimental radon time‐series was well‐fitted using a seasonal autoregressive integrated moving average model: Seasonal Auto‐Regressive Integrated Moving Average (2,0,1) (2,1,0)24, and its value, in a short‐time window (ca. 1 week) was conveniently forecasted. Finally, this work revealed that the annual effective doses received, during the observation period (1 year), by the touristic guides and visitors was ca. 2 mSv/yr and 4 μSv/hr, respectively. We concluded that the touristic exploitation of La Cueva del Viento is safe for both tourists and guides. However, based on our results, La Cueva del Viento had to be classified as a “Monitoring zone” and a regular monitoring program should be implemented.
Keywords: radon, radioprotection, cave, time‐series, Tenerife, dosimetry
Key Points
A radon monitoring program was implemented for 1 year in “La Cueva del Viento,” radon concentration ranged from 100 to 5,000 Bq/m3
Pluviometry and air temperature are the main external factors, and a Seasonal Auto‐Regressive Integrated Moving Average model described the radon time‐series in the dry season
The annual effective doses received by the touristic guides was ca. 2 mSv/yr
1. Introduction
Radon (222Rn, t 1/2 = 3.82 days) represents the largest natural source of ionizing radiation. Radon is by far the dominant radionuclide in indoor air and constitutes a major concern as a health hazard in the environment. Prolonged exposure to radon and its progeny (polonium, bismuth, and lead isotopes) is the second leading cause of lung cancer after smoking (Alberigi et al., 2011; Clement et al., 2010; IARC, 2010; Kang et al., 2019; WHO, 2009). Furthermore, most cases of radon‐induced lung cancer occur in smokers, due to the strong synergistic effect of tobacco and radon (WHO, 2009).
In confined environments, such as mines, caves, tunnels or catacombs, radon gas can accumulate, reaching harmful concentrations due to poor ventilation conditions (Cigna, 2005; Nguyễn‐Văn et al., 2020; Quindos et al., 1991; Stannard & Baalman, 1988; Ullah et al., 2022). For this reason, the level of exposure to tourists, cavers, scientists, and tour guides needs to be determined (Alvarez‐Gallego et al., 2015; Field, 2007; Somlai et al., 2009).
The main factors favoring the accumulation of radon in underground environments are: (a) geochemical composition of the soils and the bedrock (Smit & Bezuidenhout, 2021), (b) the leaching of radioactive elements from the host rock to the interior of the cavity by the action of meteoric waters (Wang et al., 2019), (c) the reduced exchange of air with the outside atmosphere (Dumitru et al., 2015), (d) the ratio between underground and external air densities (Wang et al., 2019), (e) soil humidity variations and condensation phenomena which cause the isolation of the underground cavities (Cuezva et al., 2011; Nazaroff, 1992), (f) pluviometry (Rey et al., 2022), etc. The last three ones are highly related to environmental parameters such as internal (i.e., cave) and external air temperatures, atmospheric pressure, wind speed (WS), and precipitations (Asher‐Bolinder et al., 1991; Mentes & Eper‐Pápai, 2015). Finally, other endogenous factors such as active faults, seismic and volcanic activities may also produce punctual changes in the radon concentration (Arora et al., 2012; De Cicco et al., 2017; Neri et al., 2016; Sabbarese et al., 2020; Terray et al., 2020).
Radon monitoring programs are required to minimize the exposure risk and for radiological protection (Lecomte et al., 2014). The most recent European Directive 2013/59/EURATOM set the safety reference level for the average annual indoor radon activity concentration at 300 Bq/m3, with the recommended occupational (workers) and public effective dose limits of 20 and 1 mSv/yr, respectively (Directive, 2013). This regulation obliged member states, through transposition into their national regulations, to identify sites with radon concentrations (as an annual average) that may exceed this reference level. It also obliged states to take technical measures (preventive or corrective) to reduce existing radon concentrations or exposure to ionizing radiation. The Spanish Royal Decree 732/2019 amended the previous Technical Building Code, including a new section in the Basic Document of Health standards, where this reference value (300 Bq/m3), was included (R.D., 2019). Moreover, several documents were published by the Consejo de Seguridad Nuclear (CSN) (CSN, 2012a; 2012b) and the Spanish Government (IS‐33, 2012; R.D., 2010) to be used as reference documents for radon protection.
The CSN also recently published a technical report where radon‐prone areas in the Canary Island and mainland Spain were identified (García‐Talavera San Miguel & López Acevedo, 2019). However, these radon‐prone areas were determined based on the estimated radon concentration at homes or workplaces at ground‐level. Underground environments, such as touristic caves, were not considered and thus radon exposure levels remained to be determined in such locations. This is especially important in the Canary Islands because volcanic activity may cause rapid changes in the radon emanation rates (M. Neri et al., 2006; Scarlato et al., 2013).
Several studies around the world analyzed the radon concentration in numerous caves, showing a wide range of mean concentrations: 0.3 and 8 kBq/m3 (Pinza‐Molina et al., 1999), 104 and 7,776 Bq/m3 (Csondor et al., 2017), 31.9 kBq/m3 (Alvarez‐Gallego et al., 2015), 1.9–8.4 kBq/m3 (Alberigi et al., 2011), and 9.6–91.8 kBq/m3 (Wang et al., 2019). In addition, depending on the ventilation mode, depth, and cave configuration, different radon concentrations and seasonal patterns were reported. Moreover, higher frequency fluctuations (diurnal and semidiurnal) are commonly reported and ascribed to, day and intra‐day changes of atmospheric variables, such as air temperature and pressure (Crockett et al., 2010; Mentes, 2018; Papachristodoulou et al., 2020; Richon et al., 2009). Recently, (Wang et al., 2019) classified 35 caves according to their morphology, and identified five types of ventilation regimens with different radon fluctuations between the wet and dry seasons. However, few works have been developed in volcanic caves. These studies are important due to radon is produced by the radioactive decay of Radium (226Ra). Therefore, the different origin of such caves and the chemical composition of the soils and the bedrock may change the presence of natural radionuclides such as Uranium (238U) and 226Ra, and hence the radon emissions. Even in the same volcanic territory, depending on the geological evolution of the lavas, it is possible to find large differences in the concentration of these radionuclides (López‐Pérez et al., 2021), and hence in the radon emissions rate.
Few radon‐related studies in tourist caves in the Canary Island can be found in the literature (Pinza‐Molina et al., 1999). Initial investigations carried out in July 1995 and March 1997 by our group, using passive polycarbonate (Makrofol) detectors, estimated the radon concentration in the La Cueva del Viento to range between 5 and 8 kBq/m3 (Pinza‐Molina et al., 1999). An effective dose of 0.1 mSv for a 5 hr visit and an annual dose of 41 mSv for the guides were calculated (Pinza‐Molina et al., 1999). However, these results were obtained only during the dry season and the studied cave section, of about 1,500 m, was not used for tourist visits. Therefore, such values could have been over or underestimated due to seasonal fluctuations and were not suitable for dosimetry studies for guides and tourists. In addition, and compared to other geological settings (i.e., karstic caves) reported in other Spanish territories (Alvarez‐Gallego et al., 2015; Dumitru et al., 2015; Lario et al., 2005), and around the world (Alberigi et al., 2011; Wang et al., 2019; Yamada et al., 2021), the volcanic nature and activity of the Canary Islands may impact the radon‐level of different touristic caves situated in this archipelago (López et al., 2012; Padilla et al., 2013).
In this work, we studied the radon concentration in the visitable and adjacent non‐visitable sections of the La Cueva del Viento (Figure 1) to control the exposure to the ionizing radiation of visitors and workers due to radon inhalation. Both radon concentrations and environmental variables were monitored in the cave for 1 year. Different radon measuring techniques (passive and active detectors) with different time resolutions were applied.
Figure 1.

Location of La Cueva del Viento at Tenerife Island (a and b). (c) Spatial distribution of the passive detectors (L1–L5) and the radon continuous monitoring device placement in the visitable section. (d) View of the visitable tube section (diameter ca. 3–4 m).
The high time‐resolution data allowed us to propose a model of air circulation into the cave that explains the observed dynamic changes in radon concentration. This was achieved using time series (Box‐Jenkins methodology) and frequency analysis (Fourier and Wavelet methods). This model may be useful for radioprotection applications and may be extrapolated to other tourist volcanic caves in the Canary Islands and worldwide. The analysis also allowed us to evaluate the representativity of the results obtained with both methods (passive and active detectors), and the long period analyzed ensure that the annual doses calculated were not over/underestimated.
2. Characterization of the Study Site
La Cueva del Viento is a volcanic lava tube located in the northern flank of Pico‐Viejo volcano, in the Icod Valley, Tenerife Island (Canary Islands, Spain) (Figure 1). The touristic section of the tube is located at 28° 20' 37''N, 16° 41' 55''W, at ca. 750 m.a.s.l. It was formed during the early eruptions of the Pico Viejo volcano, 27,030 ± 430 years ago, from basaltic, plagioclase‐rich pahoehoe lavas (Carracedo & Troll, 2013).
Initial basaltic eruptions of Pico Viejo, a stratovolcano in the central‐western part of the island, emitted very fluid pahoehoe lava flows, part of them extended over a large area reaching the coast toward the north. These lava fields formed numerous lava tubes, constituting the highest cave concentration in the Canary Islands (Oromí, 2018) and where La Cueva del Viento is located.
The cave has an extraordinary complexity, with several sinuous tubes and branches in three superimposed and interconnected levels, with lava sinkholes of up to 12 m depth and skylights (Oromí, 2018). Other minor structures are lava ridges, ledges and shelves, secondary ceilings, lava stalactites, flow levees and lava cascades. With 18.2 km length (Oromí & Socorro, 2021), La Cueva del Viento is considered the sixth longest volcanic cavity on Earth (Carracedo & Troll, 2013). It has seven entrances and follows the downslope of the northern flank of the island, dipping about 11° and with a maximum elevation difference between the two farthest ends of 485 m (Oromí & Socorro, 2021).
The touristic section of the La Cueva del Viento consists of a 180 m long segment, which is managed by the Organismo Autónomo de Museos y Centros del Cabildo de Tenerife. Touristic groups (ca. 15 people) visit the volcanic tube during about 1 hr. Between 6 and 8 routes are carried out daily, with a maximum of two routes per guide, which means a maximum stay of 2 hours per day per interpreter guide inside the cave. During 2019 the cave received more than 28,200 visitors, a number that was greatly reduced in 2020 (4,820 people) due to the COVID‐19 pandemic, although previous values have been recovered in 2021.
3. Materials and Methods
3.1. Sampling Methodology
This study was conducted in the tourist section of La Cueva del Viento, about 180 m long. Radon measurements were obtained using two different approaches: passive and active detectors.
3.1.1. Passive Detectors
Monthly samples (monthly integrated radon in air measurements) were obtained using solid state nuclear track detectors (CR‐39). The detectors were installed every 35 m at five locations, from the entrance to the end of the visitable cave section (Sima de la Vieja), (L1–L5 in Figure 1). CR‐39 passive detectors were exposed for ca. 30 days and were replaced during the studied period (from 1 October 2020 to 30 September 2021). After exposure periods, every detector was retrieved, sealed and immediately sent for analysis to an accredited laboratory (according to UNE‐EN ISO/IEC 17025:2017): Laboratorio de Radiactividad Ambiental (LARUC, Spain). This laboratory has rigorous quality control procedures including periodic international inter‐laboratory comparisons (proficiency test). In total, 60 detectors were deployed. For conservative purposes, when the obtained results were lower than the detection limit of the method (ca. 50–60 Bq/m3) (LOD), this value was assigned.
Two adjacent sections of the cave were also investigated using CR‐39 detectors. These were approximately 300 and 500 m in length and are located to the north and to the south of the tourist section of the cave. In this case, such detectors were installed every 60 m during the wet season and using an exposure time of 1 month (sampling period from October to November).
The 2020–2021 annual mean effective dose due to radon gas exposure (E Rn) was calculated from the mean radon concentration of the 60 monthly measurements obtained with the CR‐39 detectors during the sampling period, and assuming that this value was equal to the 2020–2021 annual mean value at the visitable sector of the cave. Therefore, E Rn was calculated according to UNSCEAR recommendation as (UNSCEAR, 2000):
| (1) |
where: C Rn = indoor radon activity concentration [Bq/m3], F is the equilibrium factor between radon and its decay products (0.56). O is the average occupational exposure time of a tour guide (ca. 480 h per year), and DCF is the dose conversion factor for radon exposure (9·10−6) [mSv·m3/Bq·h] (Lecomte et al., 2014). The average indoor occupancy for guides was computed assuming 10 working hours/week for 48 weeks/yr. However, other more realistic method to evaluate the annual dose is proposed (see Section 4). Notice that the equilibrium factor (F) between radon and its progeny was chosen as 0.56 instead of the common value (0.4) recommended by the International Commission on Radiological Protection for residential houses. This value (0.56) was selected as the average value obtained in ca. 900 measurements in caves and it is usually reported in many underground working places such as caves (Alvarez‐Gallego et al., 2015; Cigna, 2005; Yamada et al., 2021).
3.1.2. Active Detector
A portable RadonScout monitor (SARAD GmbH, Germany) was used for continuous radon concentration measurements. This device had a solid‐state detector (Silicon) designed for the integrated measurement of gross alpha activity with a sensitivity of 1.8 cpm/kBq/m3 and a measurement range from 0 to 2 MBq/m3. In addition, it also registered air temperature, relative humidity, and barometric pressure. Because this detector worked under diffusion conditions, it did cause negligible environmental disturbance or annoyance to the cave visitors during the measurement process. The uncertainty associated with the measurement varied from 10% to 20% in the concentration range of 100–1,000 Bq/m3. This detector was installed next to the L3 site (at ca. 100 m of the entrance) (Figure 1). The device was programmed with an integration time of 1 hr to study possible short period radon fluctuations. External meteorological variables (WS, air temperature, humidity, rainfall, and solar irradiance) were obtained from the Llanito de Perera meteorological station, situated at ca. 1 km from La Cueva del Viento (AgroCabildo, 2021).
3.2. Data Analysis
The experimental radon time series was analyzed in the time and frequency domains. Frequency analyses were conducted using both Fast Fourier transform (FFT) and Wavelet transform (WT) analyses (Grinsted et al., 2004; Siino et al., 2019). The time evolution was studied using the Box‐Jenkins methodology, by means of the Autoregressive Integrated Moving Average (ARIMA) model for time series analysis and forecast (Siino et al., 2020; Stránský & Thinová, 2017). Three parameters (p, d, q) were needed to correctly describe an ARIMA model. Where p is the lags in the autoregressive model, d is the differencing order to reach stationarity of the data, and q is the number of moving average components. A more complete description, a Seasonal Auto‐Regressive Integrated Moving Average (SARIMA) model was also applied, which included seasonal effects. Additional parameters were needed for this model (P, D, Q) m . P was the seasonal autoregressive order, D the seasonal difference order, Q the seasonal moving average order, and m was the number of time steps for a single seasonal period.
The forecast (Hyndman et al., 2020) and biwavelet packages (R‐Software) (Gouhier et al., 2021) were used to perform time series analysis and to study the correlation of the indoor radon concentration between endogenous and exogenous factors.
4. Results and Discussion
4.1. Radon Concentration Determined Using Passive Detectors
4.1.1. Radon Concentration Profile in the Touristic Section and Adjacent Parts
Figure 1 shows the radon sampling point localization of the passive detectors in the touristic section, labeled from L1 to L5. Figure 2a shows the radon concentration profile (monthly concentration for each point) obtained during the wet season. The radon concentration in the non‐visitable southern section (black squares) ranged from 5 to 10 kBq/m3. These values were in good concordance with early data reported for this section by our group using passive polycarbonate type (Makrofol) detectors (Pinza‐Molina et al., 1999). This section is a narrow volcanic tube (0.5–3 m diameter) with very poor ventilation and hence, with high radon concentrations. Radon concentrations in the touristic section (red squares) were lower (ca. 700 Bq/m3), except for L1 with a radon activity concentration of about 2 kBq/m3. This higher value may be explained by its location, next to the poorly ventilated southern transect, where higher radon concentrations occur. The rest of the tourist transect presented lower values, due to the natural ventilation of this section. This ventilation may be attributable to the presence of two apertures (Entrance and Sima de la Vieja) located at different elevations (ca. 15 m difference), favoring the external air circulation. The northern non‐visitable section, located after Sima de la Vieja (Figure 1), is characterized by high ceilings (15–20 m) and wider diameter (about 2–10 m), and is located at a lower level, starting after a sinkhole of about 12 m. The radon concentration in this section was quite homogeneous, with values (blue squares) of about 1 kBq/m3. These intermediate values indicate better ventilation conditions than the southern part, due to its higher dimensions and the proximity of a natural aperture to the atmosphere (Sima de la Vieja).
Figure 2.
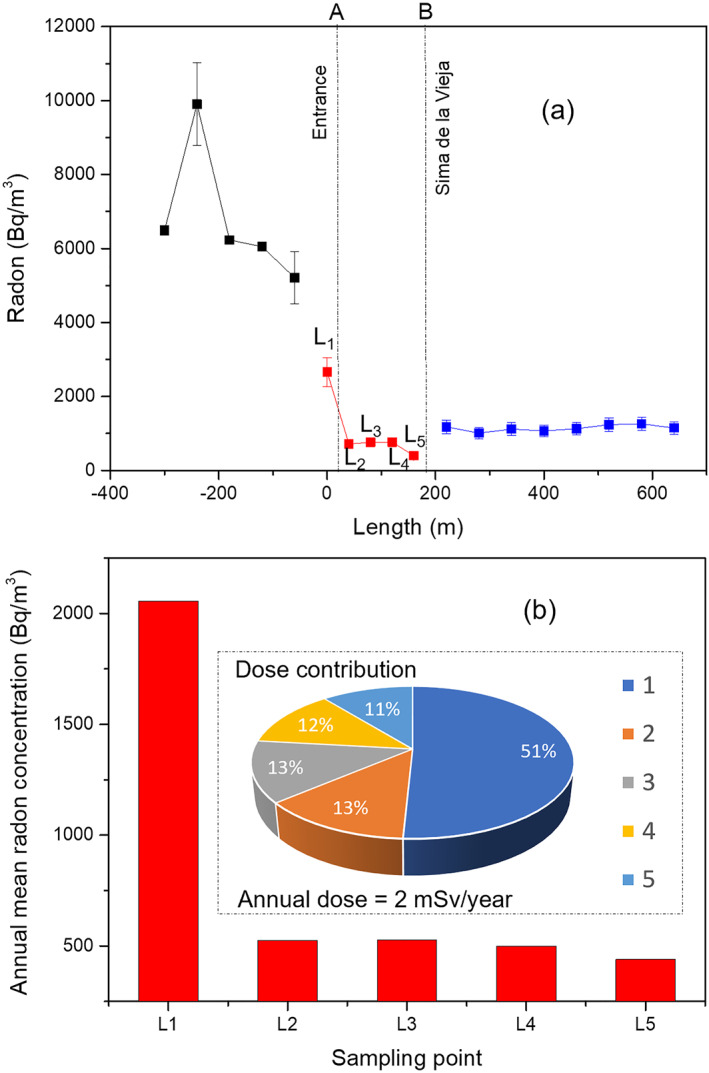
(a) Radon concentration profile obtained in La Cueva del Viento using CR‐39 passive track detectors, including the touristic section (red) and two non‐visitable adjacent sections (southern sector in black and northern in blue) during the wet season (sampling period from October to November); (b) Annual mean (during 2020–2021) radon concentration obtained in each sampling point (sampling period from October to September, 12 monthly measures in each point) and its contribution (inset) to the annual effective dose by tourist guides.
4.1.2. Monthly Variations of Radon Concentration
The accessible section was monthly surveyed to study radon variations along the annual cycle. Table 1 displays the monthly radon concentration at each sampling point during a whole year, from October 2020 to September 2021. In the annual cycle, during the summer‐autumn months (October 2020–November 2020 and May 2021–September 2021) radon concentration profiles were higher and always with maximum values at L1, meanwhile during winter–spring months (December 2021–April 2021) the radon concentration profiles were homogeneously low. Such behavior is quite similar to the annual rain regimen with a wet season from October to May and a dry season from June to September (Figure 3a). However, considering the annual arithmetic mean at each point, this value was much higher at L1 (Figure 2b). A frequency and quantile‐quantile analysis (Figure SM1 in Supporting Information S1) showed that our data do not follow a normal distribution. Kolmogorov‐Smirnov test with Lilliefors corrections of the radon concentration (p‐value < 0.05) and the log‐transformed data (p‐value = 0.06) confirmed that our data were well‐defined by a log‐normal distribution, which is very common in indoor radon studies and in other geochemical data (Cinelli et al., 2015; Le Roux et al., 2019). When analyzing the data distribution, we found that 23 detectors (ca. 40%) registered radon activities in the range 300–600 Bq/m3, meanwhile few data (<10%) presented higher radon concentration (<1,500 Bq/m3), these latter corresponding to values at L1 site. Due to such distribution, the main centralization parameters (arithmetic mean, geometric mean and median) show a high divergence (see Table 1) and therefore their utilization results in very different dose estimations (for detail, see Section 4). Moreover, during some months during winter (February and March), the radon concentration inside the volcanic tube was very low and the results obtained, using the passive detectors, were below the LOD of the method (ca. 50–60 Bq/m3). In other circumstances and studies, such a problem can be solved by increasing the exposure time of the detector, however, in this work, the exposure time was set at 1 month for the entire analysis period. For conservative purposes, when the obtained results were lower than the LOD, this value was used as the best approximation.
Table 1.
Indoor Radon Concentration at Different Locations in La Cueva del Viento
| Indoor radon concentration (Bq/m3) | |||||||||||||
|---|---|---|---|---|---|---|---|---|---|---|---|---|---|
| Localization | Oct‐20 | Nov‐20 | Dec‐20 | Jan‐21 | Feb‐21 | Mar‐21 | Apr‐21 | May‐21 | Jun‐21 | Jul‐21 | Aug‐21 | Sep‐21 | Annual arithmetic mean for each point |
| L1 | 5,080 | 2570 | 172 | 856 | 56 | 188 | 340 | 932 | 1,478 | 3,832 | 4,460 | 4,700 | 2055 |
| L2 | 1,040 | 460 | 160 | 305 | 56 | 66 | 157 | 503 | 355 | 1,058 | 1,066 | 1,079 | 525 |
| L3 | 1,080 | 420 | 244 | 439 | 56 | 66 | 252 | 188 | 378 | 1,073 | 991 | 1,130 | 526 |
| L4 | 960 | 440 | 186 | 310 | 56 | 66 | 313 | 234 | 379 | 1,058 | 1,042 | 956 | 500 |
| L5 | 790 | 430 | 184 | 312 | 56 | 66 | 150 | 249 | 220 | 950 | 896 | 966 | 439 |
| Arithmetic mean | 1,790 | 864 | 189.2 | 444.4 | 56 | 90.4 | 242.4 | 421.2 | 562 | 1,594.2 | 1,691 | 1,766.2 | |
| Geometric mean | 1,340.4 | 623.1 | 187.2 | 406.4 | 56.0 | 81.4 | 229.1 | 348.4 | 440.2 | 1,343.2 | 1,344.8 | 1,395.5 | |
| Median | 1,040 | 440 | 184 | 312 | 56 | 66 | 252 | 249 | 378 | 1,058 | 1,042 | 1,079 | |
Note. Values in italics correspond to the detection limit of the measurement due to the radon concentration could not be quantified. Each indoor radon concentration value was affected by expanded uncertainties of 10% (considering a confidence level of approximately 95%; k = 2.
Figure 3.
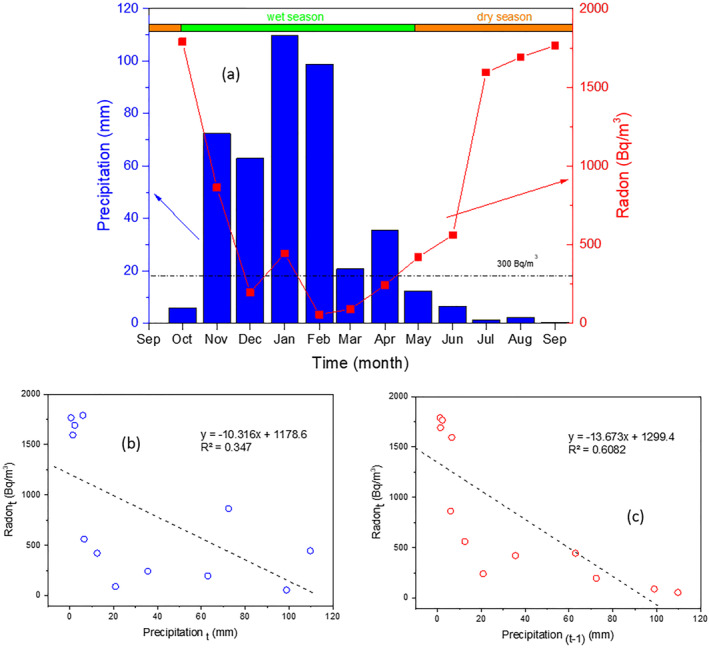
(a) Temporal evolution of the monthly indoor (arithmetic mean in Table 1) radon concentration in La Cueva del Viento and the monthly accumulated rainfall in a meteorological station situated at ca. 2 km from the volcanic tube; (b) Linear correlation between indoor radon concentration and accumulated rain with lag = 0; (c) Linear correlation between indoor radon concentration and the accumulated monthly rain with lag = −1 month.
Table 1 and Figure 3a show that the monthly radon concentrations present an important seasonal component. To identify the main factors leading to seasonal radon fluctuations, Spearman's correlations between the monthly radon concentration and external variables (external air temperature and humidity, rainfall, WS, and solar radiation) were calculated. The two best correlation factors were obtained with the monthly temperature (+0.90) and rainfall (−0.63).
In addition, monthly average temperature and rain also showed a good inverse correlation (Figure SM2 in Supporting Information S1). Figure 3a shows the time series of the monthly radon concentration and the accumulated rainfall for each month. These two variables presented a well‐linear negative relationship (Figure 3b), (r 2 = 0.347). Interestingly, the linear fit was improved using a delayed factor (t − 1 month) (r 2 = 0.608, see Figure 3c), meaning that the correlation is higher when we compare the actual radon concentration (at time t) against the pluviometry of the previous month (at time t − 1 month). Using this approach, the Spearman's correlation between the monthly radon concentration and the previous rain precipitation was improved, reaching a value of about −0.94. This analysis indicated that both, the pluviometry in the previous month (with a negative contribution), and the outside air temperature (with a positive contribution) were the main driving factors modulating the radon level in the cave in the seasonal scale.
Our hypothesis is that the annual radon cycle shown in Figure 3, occurs due to: (a) imbalance between the air temperature of the volcanic tube and external temperature, which generates a pressure gradient (Chimney effect) (positive correlation) (Wang et al., 2019) and (b) the tube's isolation from its immediate surroundings during the rainy season (negative correlation). In this regard, it should be noted that during the rainy season it is usual to find seepage in the ceiling of the tube and the floor is completely flooded during several weeks/months. Therefore, the infiltration of the water dramatically changes the permeability of the soil, inhibiting the radon exhalation, and avoiding its accumulation in the tube (Moreno et al., 2016). Such an effect is favored by the shallow depth of the touristic section of the cave (3–5 m below surface). Thus, after the first intense autumn rains, the hydric recharge of the vadose zone under the volcanic tube occurs, isolating the cave from its surroundings. It is only when the soil dries out after several weeks/months that the permeability conditions become favorable again enabling the exhalation of radon from the surrounding soil and host rock.
4.2. Continuous Radon Measurements
To understand the short and long‐term fluctuations of the indoor radon concentrations in La Cueva del Viento, as well as the possible influence of endogenous and exogenous variables, a continuous radon monitoring device was installed in the central part of the visitable sector (marked with a red triangle, close to L3 site, see Figure 1). Hourly radon concentration, as well as barometric pressure, humidity, and air temperature inside the cave were acquired during ca. 13 months. Meteorological data were obtained from AgroCabildo (Cabildo de Tenerife) at Llanito de Perera station, located at 2 km from the volcanic tube entrance (AgroCabildo, 2021).
Figure SM3 in Supporting Information S1 shows the hourly time series for indoor radon concentration (ca. 9,600 data), environmental (barometric pressure (P), indoor air humidity (H)) and meteorological (WS, outer air temperature (T), and rain) variables. An apparent correlation is observed between radon level and external air temperature (positive), rainfall (negative) and humidity inside the cave (negative). Spearman correlation analysis (Table 2) of the data reflects that both temperatures (outer (+0.61) and inner (+0.68)) were positively correlated with indoor radon concentration.
Table 2.
Correlation Matrix (Spearman's Correlation) Between Indoor Radon Concentration in La Cueva del Viento and Environmental (in) and Meteorological (out) Factors
| H in | T in | P in | WSout | T out | H out | Rain | Solar I. | Rn | |
|---|---|---|---|---|---|---|---|---|---|
| H in | 1 | ||||||||
| T in | −0.48 | 1 | |||||||
| P in | −0.08 | 0.05 | 1 | ||||||
| WSout | −0.12 | −0.14 | 0.00 | 1 | |||||
| T out | −0.26 | 0.65 | 0.00 | 0.06 | 1 | ||||
| H out | 0.24 | 0.08 | 0.00 | −0.53 | −0.32 | 1 | |||
| Rain | 0.03 | −0.05 | −0.04 | −0.10 | −0.15 | 0.27 | 1 | ||
| Solar I. | 0.02 | 0.00 | 0.00 | 0.25 | 0.61 | −0.40 | −0.05 | 1 | |
| Rn | −0.32 | 0.68 | −0.08 | −0.04 | 0.61 | 0.03 | −0.16 | 0.08 | 1 |
Note. Barometric pressure was measured inside the cave. Coefficients in bold are different from zero with significance level 0.05. H: Humidity; T: temperature; P: pressure; WS: wind speed; Solar I.: solar irradiance.
On the contrary, rain (−0.16) and air humidity inside the cave (−0.32) were anti‐correlated with the indoor radon concentration. This behavior may be due to the close relationship between rain regimen, soil humidity, and air humidity inside the volcanic tube. This means, for example, that low humidity and high temperatures occur simultaneously with high indoor radon concentrations. As observed in Figure SM4 in Supporting Information S1, after important rain events and/or during periods with high accumulated rains, the indoor radon concentration decreased during several weeks/months. However, during the dry season, with higher soil permeability, temperature, and radon exhalation, the indoor radon concentration and the intra‐day fluctuations increased inside the volcanic tube, reaching values as high as 4 kBq/m3 and a mean concentration of about 1 kBq/m3. These observations suggest that rain, soil humidity, and temperature play an important role controlling the dynamic behavior of the radon concentration and thus in the effective dose by tour guides. According to Figure SM5 in Supporting Information S1, during the wet season, the accumulated effective doses increased very slowly. However, during the dry season the effective doses increased faster, reaching a total accumulated dose (for 1 year) of about 25 mSv. The dose, after applying the occupancy factor (O = working hours/total hours in 1 year: 520/8,760) represented a value of ca. 1.5 mSv/year (for tour guides). This value was slightly lower than the value obtained with passive detectors, since the location of the detector was far (ca. 100 m) from the sampling point, L1 that showed the highest concentrations (The reader may find a more detailed dosimetric study in Section 4).
Another factor that may have modulated the radon concentrations in the cave was the natural air ventilation due to the temperature gradient between the outside and inside air. As observed in Figure SM6a in Supporting Information S1, T in and T out are well‐correlated, with a correlation coefficient of about +0.65 (Table 2). Both time series were well‐synchronized in the long term, with only an annual‐mean temperature difference of 5°C and with almost no inversion of the temperature gradient (Figure SM6b in Supporting Information S1). This result indicates that the inner air in the volcanic cave was well‐equilibrated with the outer air atmosphere, due to the natural air ventilation inside the volcanic tube. This effect is very important in La Cueva del Viento due to the existence of two openings that differ in elevation (ca. 15 m), favoring air circulation (as a curious note, the Spanish name of the cave, La Cueva del Viento, means The Cave of the Wind). The constant annual temperature gradient (T out − T in > 0) produces the input of air by the upper entrance (inhalation), and its cooling through the tube walls. Then, cooler air may exit (exhalation) by the lower pit (Sima de la Vieja) or sink in the lower section of the tube (Perry, 2013). This mechanism explains the radon concentration profile observed with passive detectors (described in Section 3.1), with high radon concentrations at site L1 and lower values at the other sampling points. The cross‐correlation function (CCF) between T in and T out showed a positive relationship with a maximum correlation at a delay time of about 4–5 hr (T in maximum is reached 4–5 hr later than T out maximum). This is very fast compared to other caves where the maximum correlation is lagged up to 3 months (Wang et al., 2019), suggesting much lower air exchange rates.
A factor that contributes to the cyclic indoor radon fluctuations in caves and other underground places is the so‐called “chimney effect” (Wang et al., 2019). This mechanism generates a pressure gradient in the soil due to the difference between the atmosphere and the soil temperature. This pressure gradient produces a suction effect (barely perceptible drop in soil pressure), which increases the radon exhalation from the soil. Figure 4 displays the time series of the pressure gradient, calculated according to (Fuente et al., 2019):
| (2) |
where ΔP is the pressure difference, c is a constant equal to 0.0342 K/m, P atm is the atmospheric pressure in Pa, h is the mean depth of the tube (ca. 5 m), T out is the outdoor temperature, and T soil the soil temperature (K). The last one was considered constant over the full year due to the isolation properties of the bedrock. According to previous works and the altitude (750 m.a.s.l.) of the visitable section of the volcanic tube, the soil temperature was estimated to be ca. 15°C according to (Paz, 2009).
Figure 4.
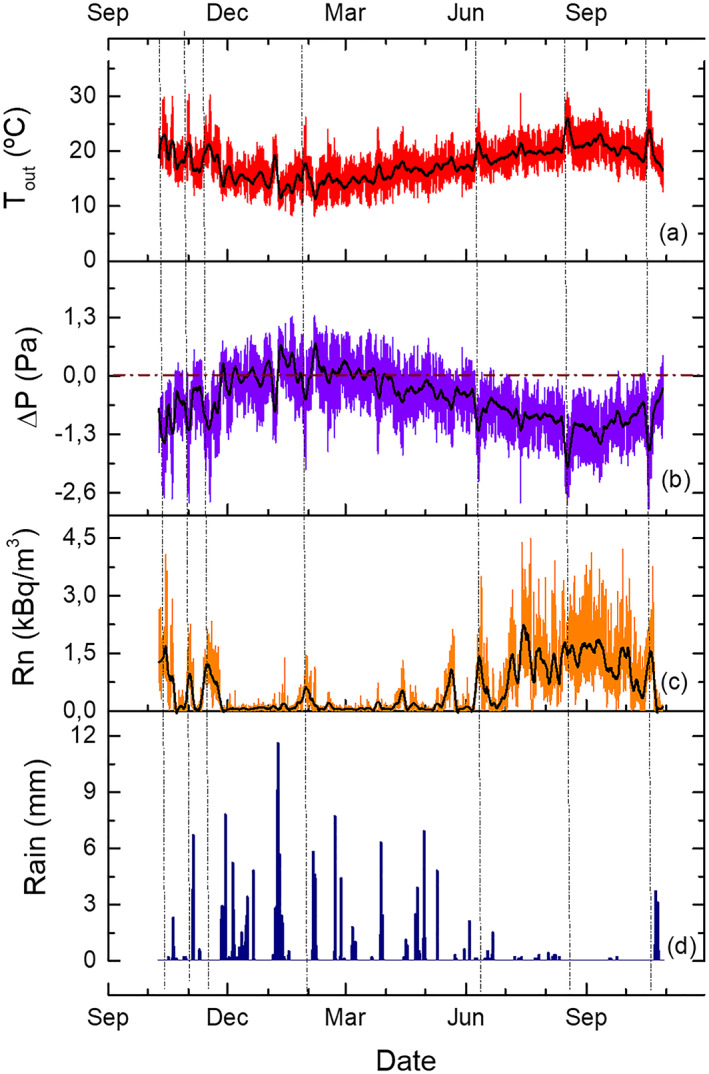
Time series of the outer temperature T out (a), pressure gradient ΔP according to Equation 2 (b), indoor radon concentration (c) and rain (d) in La Cueva del Viento. Black lines are the weekly moving average time series. Vertical dashed lines indicate anomalous events with higher external temperatures that produce fast decreases of the pressure gradient and radon exhalation events that increase the radon concentration in La Cueva del Viento.
Our data showed that ΔP fluctuated within the range of −3 to 1.5 Pa. In addition, ΔP showed a cyclic behavior in both low (year) and high (day) frequencies, (for detail see Figure 5a). The Spearman's correlation coefficient for Rn and ΔP was about −0.61 confirming the strong inverse correlation between these two variables. Consequently, ca. 60% of the variance of the Rn time series may be explained by ΔP. Therefore, when ΔP < 0 the outer pressure was lower than the pressure in the soil, the radon in the soil pores flowed to the inner atmosphere of the volcanic tube, increasing the indoor radon concentration. This observation can be easily visualized in Figure 4. Each atmospheric thermal anomaly (temperature increment) produces a significant change in the pressure gradient (more negative) and hence an increment of the radon exhalation from the soil (this effect is better observed during the dry season or when anomalous air temperature increments were observed). However, when the pressure gradient was equal/higher (ΔP → 0 or ΔP > 0) radon gas exhalation was reduced (Figure 4). The last phenomenon was more relevant during fall and winter months (with lower outside air temperature) and coincided with the highest rainfall period, when soil pores were saturated with water.
Figure 5.
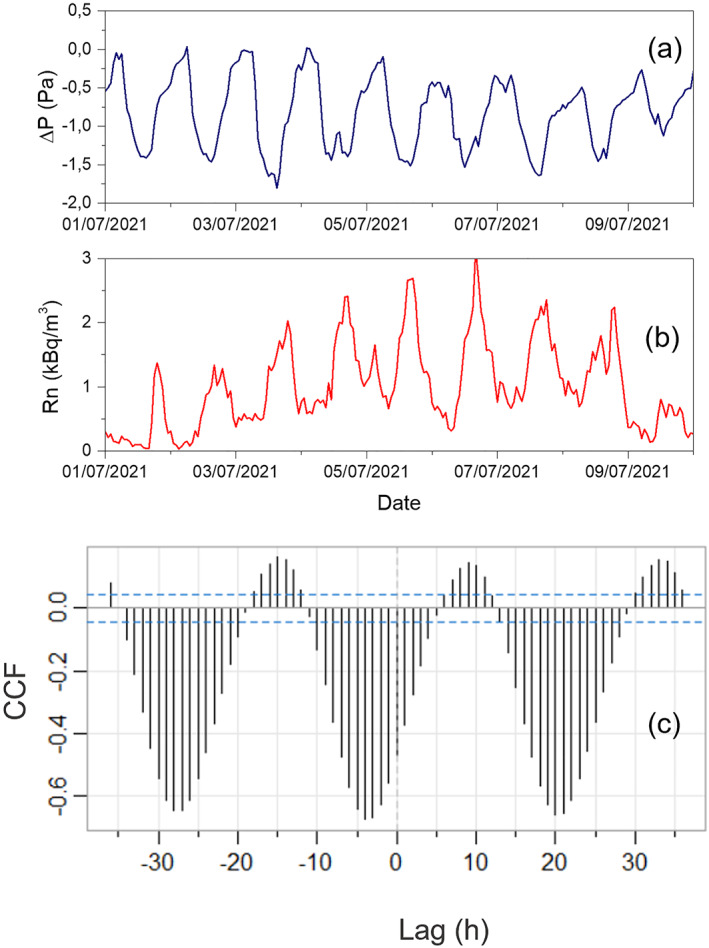
Hourly time series of the (a) pressure gradient and of the (b) indoor radon concentration in La Cueva del Viento; (c) Cross‐correlation function between the indoor radon concentration and the pressure gradient (the blue dashed lines represent 95% confidence limits).
During the dry season, the cross‐correlation analysis between radon concentration and pressure gradient showed that radon fluctuations reached the maximum correlation with ΔP with a time lag of 4 hr (Figure 5c). That is, outer air temperature and pressure gradient peak at noon, meanwhile radon daily maximum was reached at mid‐afternoon. Moreover, there was a close relationship among the air circulation, radon concentration and the outside air temperature. Thus, higher temperatures produced higher circulations of dry and hot air from the outside atmosphere across the volcanic tube, decreasing the humidity and increasing the temperature inside the volcanic tube (see Figure SM7 in Supporting Information S1).
Interestingly, the inlet of external air did not produce a decrease in radon concentrations by dilution (see the negative correlation between humidity and radon concentration (−0.32), in Table 3). This trend may be explained by the “chimney effect,” the temperature increase enhanced the radon exhalation from the soil and the movement of radon‐rich air from the worst ventilated sections. In addition, the ventilation regimen and its energy balance may depend on other variables such as the tube dimensions (height and longitude), tortuosity and roughness of the walls, producing friction and the decrease of airflow in the volcanic tube (Perry, 2013).
Table 3.
Monthly Dose at Each Sampling Point and Accumulated Monthly and Annual Dose by Tour Guides in La Cueva del Viento
| Monthly dose (mSv) | ||||||||||||
|---|---|---|---|---|---|---|---|---|---|---|---|---|
| Localization | Oct‐20 | Nov‐20 | Dec‐20 | Jan‐21 | Feb‐21 | Mar‐21 | Apr‐21 | May‐21 | Jun‐21 | Jul‐21 | Aug‐21 | Sep‐21 |
| L1 | 0.222 | 0.112 | 0.008 | 0.037 | 0.002 | 0.008 | 0.015 | 0.041 | 0.065 | 0.167 | 0.195 | 0.205 |
| L2 | 0.045 | 0.020 | 0.007 | 0.013 | 0.002 | 0.003 | 0.007 | 0.022 | 0.016 | 0.046 | 0.047 | 0.047 |
| L3 | 0.047 | 0.018 | 0.011 | 0.019 | 0.002 | 0.003 | 0.011 | 0.008 | 0.017 | 0.047 | 0.043 | 0.049 |
| L4 | 0.042 | 0.019 | 0.008 | 0.014 | 0.002 | 0.003 | 0.014 | 0.010 | 0.017 | 0.046 | 0.046 | 0.042 |
| L5 | 0.035 | 0.019 | 0.008 | 0.014 | 0.002 | 0.003 | 0.007 | 0.011 | 0.010 | 0.041 | 0.039 | 0.042 |
| Dose | 0.391 | 0.189 | 0.041 | 0.097 | 0.012 | 0.020 | 0.053 | 0.092 | 0.123 | 0.348 | 0.369 | 0.386 |
| Accumulated dose | 0.391 | 0.580 | 0.621 | 0.718 | 0.730 | 0.750 | 0.803 | 0.895 | 1.018 | 1.366 | 1.735 | 2.121 |
Note. Each monthly dose value was affected by expanded uncertainties of 10% respectively (considering a confidence level of approximately 95%; k = 2).
Our conclusion is that both rainfall regimen and temperature gradient were the most important parameters governing the indoor radon concentration in La Cueva del Viento. Thus, during the wet season, when higher precipitations and lower pressure gradients occurred, the exhalation process was inhibited, and radon concentrations were very low. On the contrary, during the dry season (with higher temperature and lower soil humidity) the exhalation process was enhanced.
4.2.1. Radon Concentration Variations in the Time and Frequency Domains
Fast Fourier Transform (FFT) method was used for the frequency analysis of all‐time series. Figure 6a shows well‐defined diurnal (24 hr) and semidiurnal (12 hr) variations in the indoor radon concentration (24 hr). Same frequencies were also found at air temperature, humidity, and barometric pressure inside the cave (Figure SM8 in Supporting Information S1). These periodicities may be attributed to the well‐known frequencies of the solar radiation cycle (Kumar et al., 2018), acting as driving force of many geological and meteorological phenomena such as temperature, humidity, pressure, WS variations, etc. (Barbosa et al., 2010).
Figure 6.
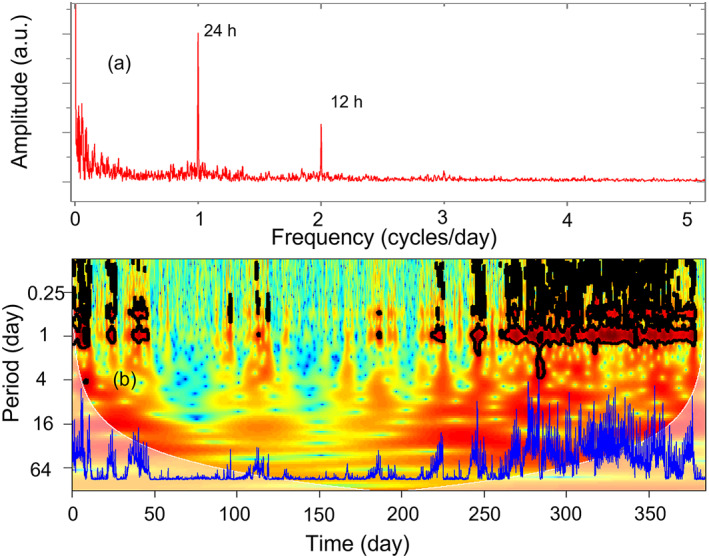
(a) Fast Fourier Transform power spectrum for indoor radon concentration in La Cueva del Viento. (b) Wavelet power spectrum of the hourly radon series in the time‐frequency domain. The 5% significance level of the red noise is shown as a thick black contour. The lighter shade is the region influenced by edge effects. Blue line represents the hourly radon time series.
FFT allowed us to obtain the characteristic periodicities of the data, however, this analysis was only performed in the frequency domain and no information about local features of the data, such as changes in frequency, intermittence and/or synchronization with other variables could be studied. Wavelet Transform (WT) analysis allowed us to resolve simultaneously both time and frequency domain, and with multi‐time resolution (Grinsted et al., 2004; Siino et al., 2019; Yan et al., 2017). Figure 6b shows the Continuous Wavelet Transform for indoor radon concentration. Again, diurnal (1 day) and semidiurnal (0.5 day) periodicities were obtained (red bands in Figure 6b). Interestingly, these frequencies displayed an important intermittence during the wet season, related to the lower exhalation of radon during this period. Therefore, during the wet season, not only the radon concentration decreased, but also its behavior was more chaotic and without significant periodicities. Such observation is in good agreement with previous works focused on the CO2 soil diffuse degassing in other volcanic regions such as Azores Archipelago (Rinaldi et al., 2012; Viveiros et al., 2014) and Phlegraean Fields (Italy) (Granieri et al., 2003). The same analysis was done for the other variables (Figure SM9 in Supporting Information S1). Similar features were observed in the all‐time series (diurnal and semidiurnal periodicities), suggesting significant correlations between them. Only rain, which is a discontinuous variable, showed an important periodicity in the range of 15–30 days during the wet season (days ca. 50–250 in Figure 6).
To identify possible relationships between radon concentration and environmental variables the WT Coherence (WTC) was computed (Zhang et al., 2020). This analysis, equivalent to the classical CCF (but used in the time domain), allowed us to obtain the influence of X‐variable over Y‐variable at different periods (frequencies) with time resolution. In addition, studying the phase relationships we could see if the studied variables were in phase or antiphase (arrow direction) and the delay/advance periods among them (arrow angle).
Radon concentration, environmental and atmospheric variables showed the highest coherence within the bands of 0.5–1 day, in good concordance with FFT results reported above (Figure 7 and Figure SM10 in Supporting Information S1). A detailed example of coherence analysis is shown in Figure 7. However, this high coherence is not constant in time. Coherence with outside air temperature and the pressure gradient almost disappeared during the wet season, when radon concentration decreased (Figures 7a and 7b). Meanwhile, during the dry season (Figures 7c and 7d), the coherence was almost constant. This intermittence effect may be related to the rain regimen and the chimney effect (for details see above). In addition, WTC analysis confirmed the phase relationship between radon concentration and outside air temperature (arrow toward the right), indicating a lead of T out by about 4–5 hr (arrow phase angle ca. 45°). On the contrary, the radon coherence with ΔP showed an anti‐phase relationship (arrow toward left) indicating a lead of ΔP by about 4–5 hr (arrow phase angle ca. −45°) (Yan et al., 2017; Zhang et al., 2020). These results were coherent with the previous CCF analysis reported above.
Figure 7.
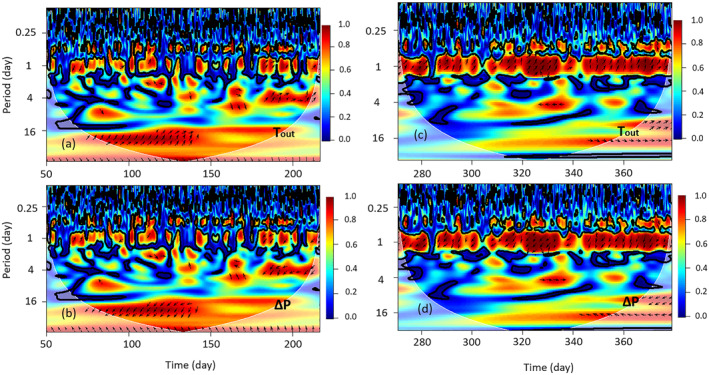
Wavelet Coherence between radon concentration and outer temperature (T out) and pressure gradient (ΔP) during the (a and b) wet season and (c and d) the dry season. The 5% significance level of the red noise is shown as a thick black contour. The lighter shade is the region influenced by edge effects. Black arrows and their angle indicated phase (right directed arrow)/antiphase (left directed arrow) correlation and delayed time, respectively.
4.2.2. Analysis of the Radon Time Series Using the ARIMA Models
Radon time series usually show complex dynamic structures such as trends, seasonal and/or stochastic components related to local environmental and meteorological factors, volcanic and tectonic activity, solar radiation, tidal forces, etc. (Cigolini et al., 2013; Iwata et al., 2018; Mentes, 2018; Morales‐Simfors et al., 2020; Papachristodoulou et al., 2020). Radon time series may present: (a) multiple seasonality (hourly, semidiurnal, diurnal, yearly) (D'Alessandro et al., 2020; Siino et al., 2019; Steinitz & Piatibratova, 2010; Steinitz et al., 2007), (b) non‐stationarity behavior (Barbosa et al., 2007), (c) long‐term memory (Donner et al., 2015; Siino et al., 2019, 2020), (d) synchronization with other factors (Siino et al., 2019), (e) intermittence (Crockett et al., 2010), and (f) not constant variance over the time (Barbosa et al., 2007). For these reasons, radon time series were characterized here using different time series approaches such as ARMA, ARIMA, SARIMAX, and ARFIMA methods (Siino et al., 2019, 2020; Stránský & Thinová, 2017). All these approaches are based on the Box‐Jenkins methodology (ARIMA/SARIMA models), introduced in the econometric time series analysis. These models allowed us to study the future value of a variable based on its past values and its covariance structure (for detail see Section 2).
First, the radon time series was examined to check stationary. This condition implies that its mean, variance, and autocorrelation structure were constant over time. In our case, this requirement was not met for the full time series (see Figure 4). As described in the previous wavelet analysis (Figure 6b), during the wet season, mean, variance and its characteristic frequencies changed with respect to the dry season. Therefore, for this analysis, we only selected 3 months (from July to September), during the dry season (see Figure 8a). During these months, radon values and their variance were higher than in other periods, increasing the effective dose by the tour guides, tourists, and cavers (see Figure SM5 in Supporting Information S1). This subset of data, with the most dynamic and complex structure, was the most relevant for our study. Additionally, we subdivided this data into two data sets (training (85 days) and testing (5 days) subsets). To start, we checked the stationarity of the training subset using the augmented Dickey‐Füller test (H0 = non‐stationary process). The result of the test was −10.107 (p‐value < 0.01) and H0 was rejected. Therefore, the training radon time series subset could be considered stationary, and our data did not need the integration component (d = 0). The visualization of the autocorrelation (ACF) and partial autocorrelation (PACF) functions helped us to select other parameters of the model (see Figures 8b and 8c). ACF function suggested that our data did not have a trend (d = 0), as reported above. In addition, the exponential decay suggested that we needed at least one average moving parameter (q = 1) and to include one daily seasonal component (D = 1; m = 24). The last observation was in good agreement with the previous FFT and WT analysis. Moreover, based on the visual inspection of the PACF function, we needed two autoregressive parameters (p = 2). Therefore, the starting SARIMA model needed the next descriptors (2, 0, 1) (P, 1, Q)24. To select the best fit, different models were studied, and parsimonious criteria were used to select the goodness of the fit. To this end, Akaike Information Criteria was used to obtain the best model that achieved the desired level of goodness of fit using as few explanatory variables as possible. In addition, a Box‐Cox transformation (Lambda = 0.38) was used to stabilize the variance of our data. Finally, the SARIMA (2, 0, 1) (2, 1, 0)24 model was selected as the best model. Table SM1 in Supporting Information S1 and Figure 9a display the estimated parameters and their standard errors (where all parameters were significant) and the plot of the fitted model against the original data respectively.
Figure 8.

(a) Radon time series (from July to September) used as training data for the estimation of the adequate parameters of the Autoregressive Integrated Moving Average model; (b) Autocorrelation (ACF); and (c) Partial autocorrelation (PACF) functions of the training subset. The dashed lines in ACF and PACF represent the 95% confidence limits.
Figure 9.
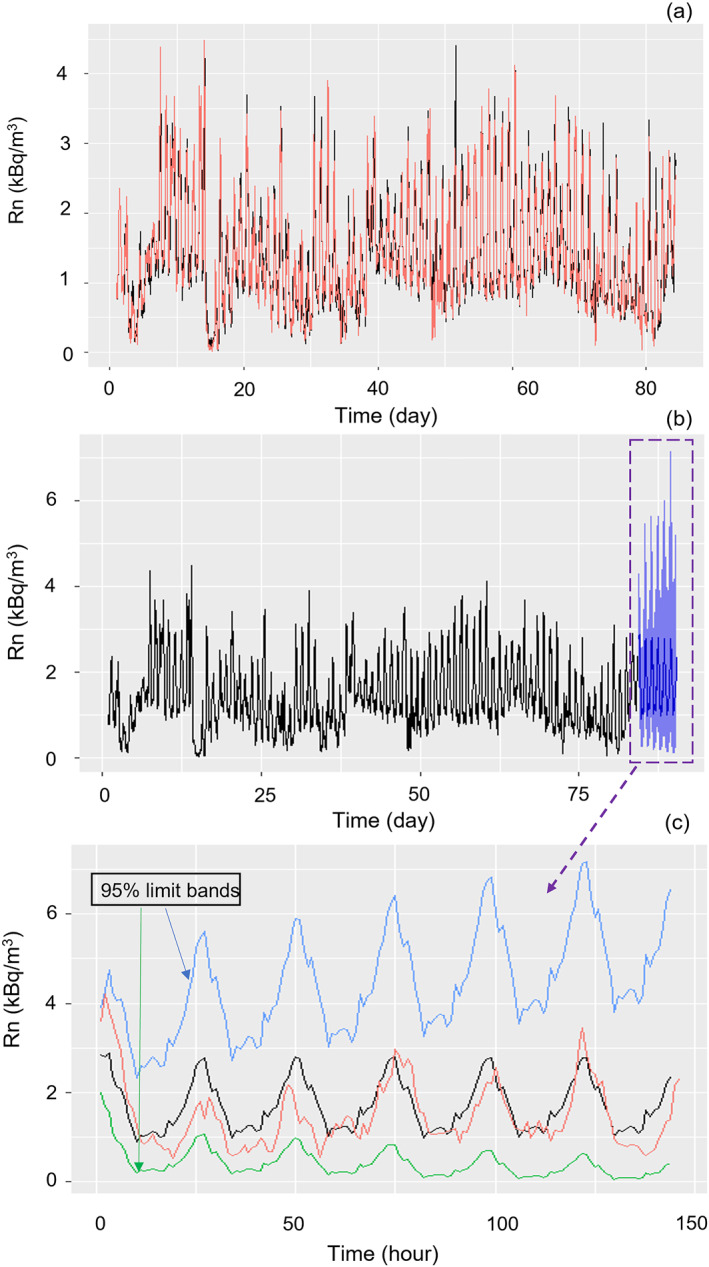
(a) Radon time series (from July to September) used as training data (red) and predicted time series using the proposed Seasonal Auto‐Regressive Integrated Moving Average (2, 0, 1) (2, 1, 0)24 model; (b) Forecast radon time series obtained for 7 days ahead (blue box) using this model; and (c) Detail of the forecast time‐window with their 95% confidence bands, where the black line is the forecasted radon time series and the red line is the original data.
The residuals of the fitting were conveniently analyzed to check the goodness of the proposed model. Figure SM11 in Supporting Information S1 shows that the standardized residuals were homoscedastic and uniformly distributed. Moreover, the histogram of the times series of the residuals confirmed that they were well‐defined by a Gaussian distribution, and the normal Q‐Q graph showed that the residuals of the model approximately fell along the normal line. More importantly, the ACF showed non‐significant residual correlations (correlations outside the confidence limits), and the p‐values for the Ljung‐Box statistic test were non‐significant at various lags. All these results confirmed that the proposed SARIMA (2, 0, 1) (2, 1, 0)24 model offered a reasonable simulation of the hourly radon time series registered during the dry season (from July to September) in La Cueva del Viento. Finally, the goodness of the proposed SARIMA (2, 0, 1) (2, 1, 0)24 model was checked using this model to forecast the radon concentration. Our results, shown in Figures 9b and 9c, confirmed that our model was consistent with the real values of the radon indoor concentration in the testing subset. The present model (based only in the past values of the radon concentration) was able to describe, with acceptable reliability, the data and may be used to predict future radon values (short‐term forecast) in La Cueva del Viento, for short time‐window (5–7 days), specially for dosimetry applications. To improve the prediction window and to obtain a better description of the radon fluctuations in La Cueva del Viento, in future works we may improve such analysis using multivariate approaches such as Principal Component Analysis, Multivariate Regression Analysis and ARIMAX methods.
5. Dosimetric Study and Adaptation to the Current Regulation
Usually, conventional remediation methods (forced air ventilation) to reduce radon concentration cannot be implemented in workplaces located in natural environments, such as a tourist caves. Such methods may cause counterproductive effects on the local microclimate, biota, and geological structures. Due to these effects, the easier way to protect tour guides, workers, cavers, and scientists from radon exposure is to calculate the dose at their working conditions and to minimize, if necessary, the time spent in the underground place.
Due to the non normal distribution of the monthly radon concentration, dosimetric studies may vary depending on the centralization parameters used (i.e., arithmetic or geometric mean, variance, etc.), for detail see Table SM2 in Supporting Information S1. Therefore, to calculate the annual effective dose by the tour guides, we: (a) determined the monthly dose values at each point according to Equation 1 (see Methodology section above) assuming an exposure time of about 43 hr/month (and considering an exposure time at each point of about 8.6 hr/month), (b) the monthly doses were obtained as the sum of the calculated dose in each point, and (c) the annual doses as the sum of the monthly values.
Our results are shown in Table 3 and Figure SM12 in Supporting Information S1. As reported, the higher doses were received during the dry season (ca. 0.4 mSv/month) and the annual value was ca. 2 mSv. Approximately 50% of the annual effective doses was received at L1, near the entrance of the cave (see Figure 2b). This value, 2 mSv/year, is comparable to the worldwide average annual effective dose (2.4 mSv/year) of public members exposed to natural ionizing radiation sources (UNSCEAR, 2000), and two times the values allowed for public members in workplaces (1 mSv/year). According to the Spanish Legislation (IS‐33, 2012; R.D., 2010, 2019), La Cueva del Viento must be, therefore, classified as “Monitored Zone” due to the risk for guides and workers to be exposed to an annual effective dose in the range 1–6 mSv. Based on this category, it is advisable to periodically measure the radiation exposure at this location. Finally, the annual effective dose may drop to ca. 1.6 mSv/year if the guides were to take a month of holidays during the dry season.
In the case of visitors (spending only 1 hr per visit) the dose (ca. 4 μSv) can be considered negligible, being a value 1/500 times lower than the dose by the tourist guides. However, this value may range from 0.25 (50) to 25 μSv (5,000 Bq/m3) depending on the date (dry of wet season) of the visit.
As an example, during our field work to place and pick up the CR‐39 detectors in the non‐visitable section of the cave, we were exposed to a mean indoor radon concentration of about 6.5 kBq/m3. The effective dose (spent time = 6 hr) was about 0.2 mSv, approximately 10% of the total dose received by guides in one year and 50% of the dose during 1 month in the dry season. This example can be used to show the importance of implementing a dosimetry plan to control the exposure to ionizing radiation in touristic volcanic caves, especially for cavers, scientists, and workers in underground spaces.
6. Conclusions
The radon concentration in La Cueva del Viento showed a complex dynamic behavior, with a clear seasonal component during the observation period (1 year) (lower values during the wet season and higher during the dry season). Based on the radon concentration profile we concluded that the touristic section of the volcanic tube was well ventilated and presented lower radon values than other adjacent parts. During this study, the radon concentration in the touristic sector ranged from 100 to 5,000 Bq/m3. Rain, temperature, and soil humidity played an important role in the behavior of the radon concentration in the long and short term. To this regard, during the dry season, not only the mean radon concentration inside the volcanic tube increased, but also its dynamic behavior changed and presented an important daily component driven by the temperature gradient (chimney effect), ventilation conditions, etc.
The present study revealed that the annual effective doses received by the touristic guides is ca. 2 mSv/year, meanwhile the effective dose for the visitants was approximately 4 μSv/hr. From a dosimetric point of view, and with the available observations limited to 12 months, the exploitation of the La Cueva del Viento is safe for tourists and tour guides. Based on this study we concluded that the lowest dose for guides occurred in the wet season (October–April) and the highest during the dry season (July–October). According to the ALARA recommendation (As Low As Reasonably Achievable), it is advised that guides enjoy their holidays during the dry season. Finally, based on our analysis, La Cueva del Viento should be classified as a “Monitoring zone” according to the European and Spanish legislation, and a regular monitoring program needs to be implemented.
Using the Box‐Jenkins methodology (implemented for time series analysis) we developed a model (based only in the past values of the radon concentration) able to describe, with acceptable reliability, the radon concentration in the volcanic tube during the dry season. This period was selected due to the full time series does not meet the stationarity (in mean, autocorrelation, and variance) condition. However, the model was adequate to predict radon values in a short time‐window (3–5 days) during the dry season, when higher radon concentrations were registered. Finally, we concluded that such methodology is adequate to be extrapolated to other tube sections in the La Cueva del Viento. This may allow in the future to extend the length of the tourist exploitation of this cave. The same methodology may be used in other touristic volcanic tubes and caves.
Conflict of Interest
The authors declare no conflicts of interest relevant to this study.
Supporting information
Supporting Information S1
Acknowledgments
Pedro A. Salazar Carballo thanks the financial support of this project by the program: “Convocatoria de Ayudas a Proyectos de Investigación: Iniciación a la Actividad Investigadora. BOC‐A‐2019‐103‐2713,” of the University of La Laguna. The authors wish to express their gratitude to the stuff of the Organismo Autónomo de Museos y Centros de Tenerife and AgroCabildo service (both belonging to the Cabildo de Tenerife) for their collaboration through the whole period of the investigation.
Salazar‐Carballo, P. A. , López‐Pérez, M. , Martín‐González, M. E. , Hernández‐Suarez, F. , & Martín‐Luis, M. C. (2023). Radon dynamics and effective dose estimation in a touristic volcanic cave: La Cueva del Viento, Tenerife (Canary Islands, Spain). GeoHealth, 7, e2022GH000704. 10.1029/2022GH000704
Data Availability Statement
A zipped file containing a PDF document with the radon time series data and other variables reported in this manuscript are available for free through our Open Science Framework repository: https://riull.ull.es/xmlui/handle/915/29999.
References
- AgroCabildo . (2021). Área de Agricultura and Pesca, AgroCabildo Área de Agricultura, Ganadería y Pesca. Servicio Técnico de Agricultura y Desarrollo Rural. Cabildo de Tenerife. [Google Scholar]
- Alberigi, S. , Pecequilo, B. R. S. , Lobo, H. A. S. , & Campos, M. P. (2011). Assessment of effective doses from radon levels for tour guides at several galleries of Santana Cave, Southern Brazil, with CR‐39 detectors: Preliminary results. Radiation Protection Dosimetry, 145(2–3), 252–255. 10.1093/rpd/ncr054 [DOI] [PubMed] [Google Scholar]
- Alvarez‐Gallego, M. , Garcia‐Anton, E. , Fernandez‐Cortes, A. , Cuezva, S. , & Sanchez‐Moral, S. (2015). High radon levels in subterranean environments: Monitoring and technical criteria to ensure human safety (case of Castañar Cave, Spain). Journal of Environmental Radioactivity, 145, 19–29. 10.1016/j.jenvrad.2015.03.024 [DOI] [PubMed] [Google Scholar]
- Arora, B. R. , Rawat, G. , Kumar, N. , & Choubey, V. M. (2012). Multi‐Parameter Geophysical Observatory: Gateway to integrated earthquake precursory research. Current Science, 103(11), 1286–1299. Retrieved from https://www.jstor.org/stable/24089149 [Google Scholar]
- Asher‐Bolinder, S. , Owen, D. E. , & Schumann, R. (1991). A preliminary evaluation of environmental factors influencing day‐to‐day and seasonal soil‐gas radon concentrations. In Field studies of radon in rocks, soils and water (Vol. 1971, pp. 23–31). [Google Scholar]
- Barbosa, S. M. , Steinitz, G. , Piatibratova, O. , Silva, M. E. , & Lago, P. (2007). Radon variability at the Elat granite, Israel: Heteroscedasticity and nonlinearity. Geophysical Research Letters, 34(15), L15309. 10.1029/2007GL030065 [DOI] [Google Scholar]
- Barbosa, S. M. , Zafrir, H. , Malik, U. , & Piatibratova, O. (2010). Multiyear to daily radon variability from continuous monitoring at the Amram tunnel, southern Israel. Geophysical Journal International, 182(2), 829–842. 10.1111/j.1365-246X.2010.04660.x [DOI] [Google Scholar]
- Carracedo, J. , & Troll, V. (2013). Teide volcano: Geology and eruptions of a highly differentiated oceanic stratovolcano. Springer Science & Business Media. 10.1007/978-3-642-25893-0 [DOI] [Google Scholar]
- Cigna, A. A. (2005). Radon in caves. International Journal of Speleology, 34(1), 1–18. 10.5038/1827-806X.34.1.1 [DOI] [Google Scholar]
- Cigolini, C. , Laiolo, M. , Ulivieri, G. , Coppola, D. , & Ripepe, M. (2013). Radon mapping, automatic measurements and extremely high 222Rn emissions during the 2002–2007 eruptive scenarios at Stromboli volcano. Journal of Volcanology and Geothermal Research, 264, 49–65. 10.1016/j.jvolgeores.2013.07.011 [DOI] [Google Scholar]
- Cinelli, G. , Tositti, L. , Capaccioni, B. , Brattich, E. , & Mostacci, D. (2015). Soil gas radon assessment and development of a radon risk map in Bolsena, Central Italy. Environmental Geochemistry and Health, 37(2), 305–319. 10.1007/s10653-014-9649-9 [DOI] [PMC free article] [PubMed] [Google Scholar]
- Clement, C. H. , Tirmarche, M. , Harrison, J. D. , Laurier, D. , Paquet, F. , Blanchardon, E. , & Marsh, J. W. (2010). Lung cancer risk from radon and progeny and statement on radon. Annals of the ICRP, 40(1), 1–64. 10.1016/j.icrp.2011.08.011 [DOI] [PubMed] [Google Scholar]
- Crockett, R. G. M. , Perrier, F. , & Richon, P. (2010). Spectral‐decomposition techniques for the identification of periodic and anomalous phenomena in radon time‐series. Natural Hazards and Earth System Sciences, 10(3), 559–564. 10.5194/nhess-10-559-2010 [DOI] [Google Scholar]
- CSN . (2012a). Guía de Seguridad 11.2 Control de la exposición a fuentes naturales de radiación. Consejo de Seguridad Nuclear. [Google Scholar]
- CSN . (2012b). Guía de Seguridad 11.4 Metodología para la evaluación de la exposición al radón en los lugares de trabajo. Consejo de Seguridad Nuclear. [Google Scholar]
- Csondor, K. , Erőss, A. , Horváth, Á. , & Szieberth, D. (2017). Radon as a natural tracer for underwater cave exploration. Journal of Environmental Radioactivity, 173, 51–57. 10.1016/j.jenvrad.2016.10.020 [DOI] [PubMed] [Google Scholar]
- Cuezva, S. , Fernandez‐Cortes, A. , Benavente, D. , Serrano‐Ortiz, P. , Kowalski, A. S. , & Sanchez‐Moral, S. (2011). Short‐term CO2(g) exchange between a shallow karstic cavity and the external atmosphere during summer: Role of the surface soil layer. Atmospheric Environment, 45(7), 1418–1427. 10.1016/j.atmosenv.2010.12.023 [DOI] [Google Scholar]
- D'Alessandro, A. , Scudero, S. , Siino, M. , Alessandro, G. , & Mineo, R. (2020). Long‐term monitoring and characterization of soil radon emission in a seismically active area. Geochemistry, Geophysics, Geosystems, 21(7), e2020GC009061. 10.1029/2020GC009061 [DOI] [Google Scholar]
- De Cicco, F. , Pugliese, M. , Quarto, M. , Roca, V. , Sabbarese, C. , Savino, F. , et al. (2017). Multi‐parametric approach to the analysis of soil radon gas for its validation as geoindicator in two sites of the Phlegraean Fields caldera (Italy). Environmental Earth Sciences, 76(8), 317. 10.1007/s12665-017-6638-1 [DOI] [Google Scholar]
- Directive . (2013). Council Directive 2013/59/Euratom of 5 December 2013 laying down basic safety standards for protection against the dangers arising from exposure to ionising radiation, and repealing Directives 89/618/Euratom, 90/641/Euratom, 96/29/Euratom, 97/43/Euratom and 2003/122/Euratom (Vol. OL J 13, pp. 1–73). [Google Scholar]
- Donner, R. V. , Potirakis, S. M. , Barbosa, S. M. , Matos, J. A. O. , Pereira, A. J. S. C. , & Neves, L. J. P. F. (2015). Intrinsic vs. spurious long‐range memory in high‐frequency records of environmental radioactivity. The European Physical Journal ‐ Special Topics, 224(4), 741–762. 10.1140/epjst/e2015-02404-1 [DOI] [Google Scholar]
- Dumitru, O. A. , Onac, B. P. , Fornós, J. J. , Cosma, C. , Ginés, A. , Ginés, J. , & Merino, A. (2015). Radon survey in caves from Mallorca Island, Spain. Science of The Total Environment, 526, 196–203. 10.1016/j.scitotenv.2015.04.076 [DOI] [PubMed] [Google Scholar]
- Field, M. (2007). Risks to cavers and cave workers from exposures to low‐level ionizing a radiation from 222Rn decay in caves. Journal of cave and karst studies the National Speleological Society bulletin, 69(1), 207–228. Retrieved from https://www.researchgate.net/profile/Malcolm-Field-2/publication/279584333_Risks_to_cavers_and_cave_workers_from_exposure_to_low-level_ionizing_radiation_from_222Rn_decay_in_caves/links/59dcaaa30f7e9b1460038cec/Risks-to-cavers-and-cave-workers-from-exposure-to-low-level-ionizing-radiation-from-222Rn-decay-in-caves.pdf [Google Scholar]
- Fuente, M. , Rábago, D. , Goggins, J. , Fuente, I. , Sainz, C. , & Foley, M. (2019). Radon mitigation by soil depressurisation case study: Radon concentration and pressure field extension monitoring in a pilot house in Spain. Science of The Total Environment, 695, 133746. 10.1016/j.scitotenv.2019.133746 [DOI] [PubMed] [Google Scholar]
- García‐Talavera San Miguel, M. , & López Acevedo, F. J. (2019). Colección Informes Técnicos 51.2019. Cartografía del potencial de radón de España. Consejo de Seguridad Nuclear. [Google Scholar]
- Gouhier, T. C. , Grinsted, A. , & Simko, V. (2021). R package biwavelet: Conduct univariate and bivariate wavelet analyses (Version 0.20.21).
- Granieri, D. , Chiodini, G. , Marzocchi, W. , & Avino, R. (2003). Continuous monitoring of CO2 soil diffuse degassing at Phlegraean Fields (Italy): Influence of environmental and volcanic parameters. Earth and Planetary Science Letters, 212(1), 167–179. 10.1016/S0012-821X(03)00232-2 [DOI] [Google Scholar]
- Grinsted, A. , Moore, J. C. , & Jevrejeva, S. (2004). Application of the cross wavelet transform and wavelet coherence to geophysical time series. Nonlinear Processes in Geophysics, 11(5/6), 561–566. 10.5194/npg-11-561-2004 [DOI] [Google Scholar]
- Hyndman, R. J. , Athanasopoulos, G. , Bergmeir, C. , Caceres, G. , Chhay, L. , O'Hara‐Wild, M. , et al. (2020). Forecasting functions for time series and linear models [R package forecast version 8.13].
- IARC . (2010). IARC monographs on the evaluation of carcinogenic risks to humans. Ingested nitrate and nitrite, and cyanobacterial peptide toxins. IARC Monographs on the Evaluation of Carcinogenic Risks to Humans, 94, 1–412. [PMC free article] [PubMed] [Google Scholar]
- IS‐33 . (2012). Instrucción IS‐33, de 21 de diciembre de 2011, del Consejo de Seguridad Nuclear, sobre criterios radiológicos para la protección frente a la exposición a la radiación natural (Vol. núm. 22, pp. 6833–6838). [Google Scholar]
- Iwata, D. , Nagahama, H. , Muto, J. , & Yasuoka, Y. (2018). Non‐parametric detection of atmospheric radon concentration anomalies related to earthquakes. Scientific Reports, 8(1), 13028. 10.1038/s41598-018-31341-5 [DOI] [PMC free article] [PubMed] [Google Scholar]
- Kang, J.‐K. , Seo, S. , & Jin, Y. W. (2019). Health effects of radon exposure. Yonsei Medical Journal, 60(7), 597–603. 10.3349/ymj.2019.60.7.597 [DOI] [PMC free article] [PubMed] [Google Scholar]
- Kumar, K. , Prasad, T. , Ratnam, M. , & Nagaraja, K. (2018). Fast Fourier Transform power spectrum of radon activity. Radiation Protection and Environment, 41(1), 30–36. 10.4103/rpe.RPE_12_18 [DOI] [Google Scholar]
- Lario, J. , Sánchez‐Moral, S. , Cañaveras, J. C. , Cuezva, S. , & Soler, V. (2005). Radon continuous monitoring in Altamira Cave (northern Spain) to assess user's annual effective dose. Journal of Environmental Radioactivity, 80(2), 161–174. 10.1016/j.jenvrad.2004.06.007 [DOI] [PubMed] [Google Scholar]
- Lecomte, J. F. , Solomon, S. , Takala, J. , Jung, T. , Strand, P. , Murith, C. , et al. (2014). ICRP publication 126: Radiological protection against radon exposure. Annals of the ICRP, 43(3), 5–73. 10.1177/0146645314542212 [DOI] [PubMed] [Google Scholar]
- Le Roux, R. R. , Bezuidenhout, J. , & Smit, H. A. P. (2019). The influence of different types of granite on indoor radon concentrations of dwellings in the South African West Coast Peninsula. Journal of Radiation Research and Applied Sciences, 12(1), 375–382. 10.1080/16878507.2019.1680043 [DOI] [Google Scholar]
- López, C. , Blanco, M. J. , Abella, R. , Brenes, B. , Cabrera Rodriguez, V. M. , Casas, B. , et al. (2012). Monitoring the volcanic unrest of El Hierro (Canary Islands) before the onset of the 2011–2012 submarine eruption. Geophysical Research Letters, 39(13), L13303. 10.1029/2012GL051846 [DOI] [Google Scholar]
- López‐Pérez, M. , Martín‐Luis, C. , Hernández, F. , Liger, E. , Fernández‐Aldecoa, J. C. , Lorenzo‐Salazar, J. M. , et al. (2021). Natural and artificial gamma‐emitting radionuclides in volcanic soils of the Western Canary Islands. Journal of Geochemical Exploration, 229, 106840. 10.1016/j.gexplo.2021.106840 [DOI] [Google Scholar]
- Mentes, G. (2018). Investigation of the relationship between rock strain and radon concentration in the tidal frequency‐range. Journal of Applied Geophysics, 155, 232–236. 10.1016/j.jappgeo.2018.06.019 [DOI] [Google Scholar]
- Mentes, G. , & Eper‐Pápai, I. (2015). Investigation of temperature and barometric pressure variation effects on radon concentration in the Sopronbánfalva Geodynamic Observatory, Hungary. Journal of Environmental Radioactivity, 149, 64–72. 10.1016/j.jenvrad.2015.07.015 [DOI] [PubMed] [Google Scholar]
- Morales‐Simfors, N. , Wyss, R. A. , & Bundschuh, J. (2020). Recent progress in radon‐based monitoring as seismic and volcanic precursor: A critical review. Critical Reviews in Environmental Science and Technology, 50(10), 979–1012. 10.1080/10643389.2019.1642833 [DOI] [Google Scholar]
- Moreno, V. , Bach, J. , Font, L. , Baixeras, C. , Zarroca, M. , Linares, R. , & Roqué, C. (2016). Soil radon dynamics in the Amer fault zone: An example of very high seasonal variations. Journal of Environmental Radioactivity, 151, 293–303. 10.1016/j.jenvrad.2015.10.018 [DOI] [PubMed] [Google Scholar]
- Nazaroff, W. W. (1992). Radon transport from soil to air. Reviews of Geophysics, 30(2), 137–160. 10.1029/92RG00055 [DOI] [Google Scholar]
- Neri, M. , Behncke, B. , Burton, M. , Galli, G. , Giammanco, S. , Pecora, E. , et al. (2006). Continuous soil radon monitoring during the July 2006 Etna eruption. Geophysical Research Letters, 33(24), L24316. 10.1029/2006GL028394 [DOI] [Google Scholar]
- Neri, M. , Ferrera, E. , Giammanco, S. , Currenti, G. , Cirrincione, R. , Patanè, G. , & Zanon, V. (2016). Soil radon measurements as a potential tracer of tectonic and volcanic activity. Scientific Reports, 6(1), 24581. 10.1038/srep24581 [DOI] [PMC free article] [PubMed] [Google Scholar]
- Nguyễn‐Văn, H. , Nguyễn‐Thùy, D. , Nguyễn, N. T. Á. , Streil, T. , Schimmelmann, J. P. , Doiron, K. E. , et al. (2020). Excessive radon‐based radiation in indoor air caused by soil building materials in traditional homes on Đồng Văn karst plateau, northern Vietnam. Chemosphere, 257, 127119. 10.1016/j.chemosphere.2020.127119 [DOI] [PubMed] [Google Scholar]
- Oromí, P. (2018). Researches in lava tubes. In Moldovan O. T., Kováč Ľ., & Halse S. (Eds.), Cave Ecology (pp. 369–381). Springer International Publishing. 10.1007/978-3-319-98852-8_17 [DOI] [Google Scholar]
- Oromí, P. , & Socorro, S. (2021). Biodiversity in the Cueva del Viento Lava Tube System (Tenerife, Canary Islands). Diversity, 13(6), 226. 10.3390/d13060226 [DOI] [Google Scholar]
- Padilla, G. D. , Hernandez, P. A. , Padron, E. , Barrancos, J. , Perez, N. M. , Melian, G. , et al. (2013). Soil gas radon emissions and volcanic activity at El Hierro (Canary Islands): The 2011‐2012 submarine eruption. Geochemistry, Geophysics, Geosystems, 14(2), 432–447. 10.1029/2012GC004375 [DOI] [Google Scholar]
- Papachristodoulou, C. , Stamoulis, K. , & Ioannides, K. (2020). Temporal variation of soil gas radon associated with seismic activity: A case study in NW Greece. Pure and Applied Geophysics, 177(2), 821–836. 10.1007/s00024-019-02339-5 [DOI] [Google Scholar]
- Paz, M. R. (2009). Contribución al conocimiento de los regímenes de temperatura de los suelos de la isla de Tenerife. Universidad de La Laguna. [Google Scholar]
- Perry, R. W. (2013). A review of factors affecting cave climates for hibernating bats in temperate North America. Environmental Reviews, 21(1), 28–39. 10.1139/er-2012-0042 [DOI] [Google Scholar]
- Pinza‐Molina, C. , Alcaide, J. M. , Rodriques‐Bethencourt, R. , & Hernandez‐Armas, J. (1999). Radon exposures in the caves of Tenerife (Canary islands). Radiation Protection Dosimetry, 82(3), 219–224. 10.1093/oxfordjournals.rpd.a032628 [DOI] [Google Scholar]
- Quindos, L. S. , Fernandez, P. L. , & Soto, J. (1991). National survey on indoor radon in Spain. Environment International, 17(5), 449–453. 10.1016/0160-4120(91)90278-X [DOI] [Google Scholar]
- R.D. (2010). Real Decreto 1439/2010, de 5 de noviembre, por el que se modifica el Reglamento sobre protección sanitaria contra radiaciones ionizantes, aprobado por Real Decreto 783/2001, de 6 de julio (Vol. núm. 279, pp. 96395–96398). [Google Scholar]
- R.D. (2019). Real Decreto 732/2019, de 20 de diciembre, por el que se modifica el Código Técnico de la Edificación, aprobado por el Real Decreto 314/2006, de 17 de marzo (Vol. núm. 311, pp. 140488–140674). [Google Scholar]
- Rey, J. F. , Goyette, S. , Gandolla, M. , Palacios, M. , Barazza, F. , & Goyette Pernot, J. (2022). Long‐term impacts of weather conditions on indoor radon concentration measurements in Switzerland. Atmosphere, 13(1), 92. 10.3390/atmos13010092 [DOI] [Google Scholar]
- Richon, P. , Perrier, F. , Pili, E. , & Sabroux, J.‐C. (2009). Detectability and significance of 12 hr barometric tide in radon‐222 signal, dripwater flow rate, air temperature and carbon dioxide concentration in an underground tunnel. Geophysical Journal International, 176(3), 683–694. 10.1111/j.1365-246X.2008.04000.x [DOI] [Google Scholar]
- Rinaldi, A. P. , Vandemeulebrouck, J. , Todesco, M. , & Viveiros, F. (2012). Effects of atmospheric conditions on surface diffuse degassing. Journal of Geophysical Research, 117(B11), B11201. 10.1029/2012JB009490 [DOI] [Google Scholar]
- Sabbarese, C. , Ambrosino, F. , Chiodini, G. , Giudicepietro, F. , Macedonio, G. , Caliro, S. , et al. (2020). Continuous radon monitoring during seven years of volcanic unrest at Campi Flegrei caldera (Italy). Scientific Reports, 10(1), 9551. 10.1038/s41598-020-66590-w [DOI] [PMC free article] [PubMed] [Google Scholar]
- Scarlato, P. , Tuccimei, P. , Mollo, S. , Soligo, M. , & Castelluccio, M. (2013). Contrasting radon background levels in volcanic settings: Clues from 220Rn activity concentrations measured during long‐term deformation experiments. Bulletin of Volcanology, 75(9), 751. 10.1007/s00445-013-0751-0 [DOI] [Google Scholar]
- Siino, M. , Scudero, S. , Cannelli, V. , Piersanti, A. , & D’Alessandro, A. (2019). Multiple seasonality in soil radon time series. Scientific Reports, 9(1), 8610. 10.1038/s41598-019-44875-z [DOI] [PMC free article] [PubMed] [Google Scholar]
- Siino, M. , Scudero, S. , & D’Alessandro, A. (2020). Stochastic models for radon daily time series: Seasonality, stationarity, and long‐range dependence detection. Frontiers of Earth Science, 8, 575001. 10.3389/feart.2020.575001 [DOI] [Google Scholar]
- Smit, H. A. P. , & Bezuidenhout, J. (2021). Influence of climate and weather on the mitigation of radon exposure in two towns of the Western Cape, South Africa. Journal of Radiation Research and Applied Sciences, 14(1), 236–245. 10.1080/16878507.2021.1940750 [DOI] [Google Scholar]
- Somlai, J. , Szeiler, G. , Szabó, P. , Várhegyi, A. , Tokonami, S. , Ishikawa, T. , et al. (2009). Radiation dose of workers originating from radon in the show Cave of Tapolca, Hungary. Journal of Radioanalytical and Nuclear Chemistry, 279(1), 219–225. 10.1007/s10967-007-7032-3 [DOI] [Google Scholar]
- Stannard, J. N. , & Baalman, J. R. W. (1988). Radioactivity and health. A history Rep. [Google Scholar]
- Steinitz, G. , & Piatibratova, O. (2010). Radon signals in the Gavnunim intrusion, Makhtesh Ramon, Israel. Geophysical Journal International, 180(2), 651–665. 10.1111/j.1365-246X.2009.04450.x [DOI] [Google Scholar]
- Steinitz, G. , Piatibratova, O. , & Barbosa, S. M. (2007). Radon daily signals in the Elat granite, southern Arava, Israel. Journal of Geophysical Research, 112(B10), B10211. 10.1029/2006JB004817 [DOI] [Google Scholar]
- Stránský, V. , & Thinová, L. (2017). Radon concentration time series modeling and application discussion. Radiation Protection Dosimetry, 177(1–2), 155–159. 10.1093/rpd/ncx207 [DOI] [PubMed] [Google Scholar]
- Terray, L. , Gauthier, P.‐J. , Breton, V. , Giammanco, S. , Sigmarsson, O. , Salerno, G. , et al. (2020). Radon activity in volcanic gases of Mt. Etna by passive dosimetry. Journal of Geophysical Research: Solid Earth, 125(9), e2019JB019149. 10.1029/2019JB019149 [DOI] [Google Scholar]
- Ullah, F. , Muhammad, S. , & Ali, W. (2022). Radon concentration and potential risks assessment through hot springs water consumption in the Gilgit and Chitral, Northern Pakistan. Chemosphere, 287, 132323. 10.1016/j.chemosphere.2021.132323 [DOI] [PubMed] [Google Scholar]
- UNSCEAR . (2000). Sources and effects of ionizing radiation. UNITED NATIONS. [DOI] [PubMed] [Google Scholar]
- Viveiros, F. , Vandemeulebrouck, J. , Rinaldi, A. P. , Ferreira, T. , Silva, C. , & Cruz, J. V. (2014). Periodic behavior of soil CO2 emissions in diffuse degassing areas of the Azores archipelago: Application to seismovolcanic monitoring. Journal of Geophysical Research: Solid Earth, 119(10), 7578–7597. 10.1002/2014JB011118 [DOI] [Google Scholar]
- Wang, Y. , Luo, W. , Zeng, G. , Yang, H. , Wang, M. , Wang, M. , et al. (2019). High 222Rn concentrations and dynamics in Shawan Cave, southwest China. Journal of Environmental Radioactivity, 199–200, 16–24. 10.1016/j.jenvrad.2018.12.029 [DOI] [PubMed] [Google Scholar]
- WHO . (2009). WHO handbook on indoor radon: A public health perspective. [PubMed]
- Yamada, R. , Tamakuma, Y. , Suzuki, T. , Nakasone, S. , Shiroma, Y. , Furukawa, M. , et al. (2021). A preliminary study of radon equilibrium factor at a tourist cave in Okinawa, Japan. Atmosphere, 12(12), 1648. 10.3390/atmos12121648 [DOI] [Google Scholar]
- Yan, R. , Woith, H. , Wang, R. , & Wang, G. (2017). Decadal radon cycles in a hot spring. Scientific Reports, 7(1), 12120. 10.1038/s41598-017-12441-0 [DOI] [PMC free article] [PubMed] [Google Scholar]
- Zhang, S. , Shi, Z. , Wang, G. , Yan, R. , & Zhang, Z. (2020). Groundwater radon precursor anomalies identification by decision tree method. Applied Geochemistry, 121, 104696. 10.1016/j.apgeochem.2020.104696 [DOI] [Google Scholar]
Associated Data
This section collects any data citations, data availability statements, or supplementary materials included in this article.
Supplementary Materials
Supporting Information S1
Data Availability Statement
A zipped file containing a PDF document with the radon time series data and other variables reported in this manuscript are available for free through our Open Science Framework repository: https://riull.ull.es/xmlui/handle/915/29999.