

Abstract
Background:
With significant increases in opioid use/misuse and persistent high prevalence of prenatal alcohol exposure (PAE), identifying infants at risk for long-term developmental sequelae due to these exposures remains an urgent need. This study reports on developmental outcomes in young children from a prospective cohort, ENRICH-1, which recruited pregnant women and followed up maternal-infant pairs.
Methods:
Subjects were assigned into four study groups based on prenatal use of medications for opioid use disorder (MOUD), PAE, MOUD+PAE, and unexposed controls (UC). Mixed effects modeling was used to evaluate changes in the Bayley Scales of Infant Development-III (BSID-III) Cognitive, Language, and Motor scores between 6 and 20 months.
Results:
There was a significant three-way interaction (MOUD-by-PAE-by-Time) with respect to the BSID-III Cognitive (p=0.045) and Motor (p=0.033) scales. Significant changes between two evaluations were observed for MOUD group in Cognitive and Language scores; for PAE group in Cognitive, Language, and Motor scores, and for MOUD+PAE group in Language scores after adjusting for child sex and family socio-economic status. The developmental scores for the UC remained stable.
Conclusion:
Observed decline in neurodevelopmental scores during the first two years of life emphasizes the importance of a longitudinal approach when evaluating children with prenatal polysubstance exposure.
INTRODUCTION
There has been a significant increase in the number of children exposed to illicit drugs and alcohol in the prenatal period, over the past two decades. During the period of 1999–2014, the prevalence of opioid use during pregnancy increased from 1.5 to 6.5 per 1,000 deliveries.1 Prenatal alcohol exposure (PAE) has been an ongoing problem with an estimated 22.5% of women drinking during the first month of pregnancy2 and 11.3% having consumed alcohol within the last 30 days throughout pregnancy.3,4 Prospective studies evaluating the impact of prenatal drug exposure on neurodevelopment during the first two years of life are important to help identify early deficits in cognitive, language or motor skills and provide opportunities for early interventions. Due to limited availability of validated infant scales, the ability to identify those infants at highest risk has been a challenge.
A compounding factor to the developmental outcome of children with prenatal drug exposure is pre- and postnatal environment, which can impact development over time.5 Prior studies have shown that low family socioeconomic status is often associated with reduced scores in language and motor domains using the Bayley Scales of Infant Development (BSID) in infants 6–9 months of age.6 Furthermore, infants with a failure to thrive and exposure to non-accidental trauma revealed a reduced mental development score, and children with a failure to thrive also experienced reduced motor scores.7 Furthermore, maternal mental health during pregnancy and postpartum period can influence infant cognitive and behavioral development.8 Therefore, it is important to examine prenatal exposures in the context of other pre- and postnatal variables to best understand infant development.
The BSID9 is the most widely used scale of developmental outcome in infants and young children.10 Studies related to the early developmental sequelae of prenatal drug and alcohol exposure using the BSID scales have had heterogeneous results. PAE was associated with decreased BSID-II scores in areas of cognitive and motor development in children at 6 months, and this association was mediated by the child’s gestational age and socio-economic status.5 Skumlien et al (2020) found that boys exposed to opioids or alcohol had lower BSID-III cognitive and language scores at a median age of 10.4 months (cognitive scale) and 9.4 months (language scale) when compared to non-exposed children.11 Another study found differences in BSID-III fine and gross motor scores in children with prenatal alcohol exposure at 6 and 24 months, and not in language development.12 In contrast, some studies found that prenatal opioid exposure was not associated with adverse cognitive or executive functioning outcomes after adjustment for socioeconomic factors.13–15 Previous studies by our group found no differences in BSID-III cognitive, language or motor scores at 5–8 months of age in infants with mild/moderate PAE or prenatal exposure to medications for opioid use disorder (MOUD) compared to an unexposed control group.16,17
In this study we investigated whether there was a change over time, in BSID-III developmental scores from 6 to 20 months of age, in a cohort of children with prenatal alcohol and opioid exposure. We hypothesized that children classified into the prenatal exposure groups would have a significant decline in BSID-III scores between 6 and 20 months of age.
METHODS
Study design and population
Data for this analysis were derived from the prospective cohort study, Ethanol, Neurodevelopment, Infant, and Child Health (ENRICH-1).18 The ENRICH-1 study was conducted at the University of New Mexico (UNM) and the Mind Research Network to assess the effects of prenatal alcohol and opioid exposures, as two primary exposures of interest, on infant development. Prospective data collection occurred over four study visits: visit 1 (V1) baseline interview and biological sample collection during pregnancy (on average, 25.4 ± 7.2 gestational weeks); visit 2 (V2) interview and biological sample collection at delivery; visit 3 (V3) caregiver interview and neurodevelopmental assessments when child was approximately 6 months of age; visit 4 (V4) caregiver interview and neurodevelopmental assessments when child was approximately 20 months of age. The developmental assessment windows were chosen given the project’s a priori focus on early indices of child development during the first two years of life. By 20 months of age, critical cognitive functions known to be affected in individuals with an FASD typically emerge, providing a first look at the impact of PAE on higher cognitive functioning in at-risk children. The participant recruitment commenced in 2013, and prospective follow up of participants was completed in 2019.
The sample size was 105 maternal-infant pairs at V3 and 72 at V4; the final sample size included in this repeated measures analysis included 69 maternal-infant pairs (3 subjects who completed BSID-III at V4 had missing data at V3). All study procedures were approved by the UNM Health Sciences Center Human Research Review Committee, and all pregnant women provided written informed consent prior to participating.
Participants were recruited from prenatal care clinics affiliated with UNM, including the specialty clinic dedicated to providing prenatal and postpartum care to women with substance use disorders (SUD) and their infants. Participants were recruited into one of four study groups: 1) unexposed controls (UC); 2) patients receiving MOUD; 3) patients who consumed alcohol during pregnancy (PAE); and 4) patients with combined opioid and alcohol (MOUD+PAE) use.
Overall inclusion criteria in the ENRICH-1 cohort were: 1) gestational age at enrollment between 12–35 weeks, 2) ultrasound confirmation of a singleton pregnancy, 3) delivery at UNM hospital, 4) intention to remain in New Mexico for 2 years following delivery in order to complete follow-up study visits, and 5) ability to give informed consent in English. Exclusion criteria for all groups included 1) diagnosis of a major fetal structural anomaly, 2) more than minimal use of stimulants (cocaine, methamphetamines, or MDMA) in the first trimester, defined as more than monthly self-reported use or >1 positive urine drug test, 3) any use of stimulants during the 2nd and 3rd trimesters assessed by self-report or urine drug test. In addition, participants with tobacco, marijuana, or alcohol use (assessed via self-report and alcohol biomarkers, described below) after last menstrual period (LMP) were not eligible for participation as unexposed controls.
Assessment of PAE
PAE was assessed via a comprehensive battery of measures, including self-report and ethanol biomarkers. Participants were asked to complete three timeline follow-back (TLFB) calendars: TLFB-1 completed at baseline interview assessed alcohol use during the periconceptional period (the two weeks before and after the last menstrual period [LMP]); TLFB-2 captured 30 days prior to enrollment/V1; and TLFB-3 captured 30 days prior to delivery/V2. Average ounces of absolute alcohol consumed per day (AA/day) were calculated from the number of standard drink units reported for each of the three TLFB calendars. AA/day across pregnancy was calculated as an average across the three TLFB calendars. In addition to self-report, alcohol exposure was also assessed via a battery of ethanol biomarkers measured in blood and urine specimens at V1 and V2. Carbohydrate-deficient transferrin (CDT), phosphatidylethanol (PEth), and gamma glutamyl transferase (GGT) were analyzed in maternal blood, and ethyl sulfate (EtS) and ethyl glucuronide (EtG) in maternal urine. In addition, PEth was measured in infant dried blood spots at delivery (PEth-DBS).
Participants with or without prenatal opioid exposure that reported periconceptional use of alcohol consisting of greater than 13 drinks or at least 2 binge episodes in the month surrounding LMP were initially classified as alcohol exposed (PAE or MOUD+PAE). Periconceptional alcohol use was the basis for initial classification because there is less stigma surrounding pre-pregnancy drinking, making it more likely to be reported accurately. Additionally, risky periconceptional drinking has been associated with alcohol consumption later in pregnancy19 and child developmental outcomes.20 To remain eligible in the PAE and PAE+MOUD groups, the second tier eligibility criteria included consumption of alcohol during pregnancy per TLFB-2 and TLFB-3 reports or at least one positive ethanol biomarker at V1 or V2. Non-PAE participants had no/minimal periconceptional alcohol use (no more than 2 drinks per week) and no alcohol use during pregnancy (per self-report on TLFB-2 and TLFB-3 calendars and negative tests on all ethanol biomarkers).
Assessment of prenatal opioid exposure and co-exposures:
Participants with prenatal opioid exposure, receiving MOUD, such as methadone or buprenorphine, with or without other opioids (illicit or misuse of prescription opioids), were identified from the specialty clinic based on pre-screening of medical records, structured interviews, and study-specific 7-drug urine panel (amphetamines, barbiturates, benzodiazepines, cocaine, opiates, PCP, cannabinoids/THC) administered at V1 and V2. Co-exposures to illicit and prescription drugs were captured at V1 and V2 utilizing the 7-drug urine panel (above) and self-report via structured interview.
Assessment of neurobehavioral outcomes and postnatal environment:
A battery of neurodevelopmental assessments and validated questionnaires were completed to assess child development. Assessments were conducted at V3 when children were between 5 and 8 months of age and at V4 when children were between 18 and 22 months of age (both adjusted for prematurity). Developmental assessments included administration of the Bayley Scales of Infant and Toddler Development – 3rd edition (BSID-III). The three subscales, Gross and Fine Motor, Cognitive, and Language, which involve direct assessment by a pediatric developmental diagnostician (JL) who was blinded to participant exposure status, constituted the basis of this report. The BSID-III cognitive, language and motor composite scores have a mean of 100 and standard deviation of 15; scores range from 55 to145 for the cognitive composite score and from 45 to 155 for the language and motor composite scores.
Postnatal environment was assessed via structured interviews, including the number and ages of children living in the home, number of homes the child had lived in since birth, family socio-economic status (SES) assessed with the Barratt Simplified Measure of Social Status,21 household income, working status (outside the home) of the primary caregiver, years of education completed by the primary caregiver, and child/family participation in early intervention programs.
Statistical analyses
Differences in demographic, medical, and substance use characteristics among the four study groups (PAE, MOUD+PAE, MOUD, UC) were compared using Chi-square or Fisher’s exact test for categorical variables and Kruskal-Wallis test for continuous variables. Statistical significance for the unadjusted analyses examining the association between the study group and BSID-III scores at 6 and 20 months, as well as the change in scores between 6 and 20 months were determined using Kruskal–Wallis tests.
Mixed effects using generalized least squares via restricted maximum likelihood was used to model changes in the BSID-III Cognitive, Language, and Motor scores between 6 and 20 months. The covariance matrix for each outcome was determined based on the lowest Akaike information criterion (AIC) estimator and a significant likelihood-ratio test against the null model (i.e. the model with an ordinary least squares covariance structure). For the BSID-III Cognitive and Language subscales, an unstructured covariance structure was used, and compound symmetry structure was used for BSID-III Motor subscale. Residual analysis did not detect any violations in model assumptions.
In the mixed effects analyses, the initial model included the main effects (MOUD and PAE), time (V3 vs. V4), and all possible two-way and three-way interactions (e.g., MOUD-by-PAE, MOUD-by-PAE-by-Time, etc.). MOUD-by-PAE was modeled as an interaction to assess the combined estimate of MOUD and PAE, and time was included as an interaction term to evaluate developmental changes between baseline to follow up visits by group. Next, infant sex and family SES were added as covariates to each model. Pairwise comparisons between each of the exposure groups to the UC group, and within each group between 6 months and 20 months, were calculated using least squares estimates from the mixed effects analyses.22–24
All analyses were two-tailed and conducted using SAS statistical software (Cary, NC version 9.4). An alpha level of 0.05 was used to determine statistical significance; however significance using an alpha level of 0.10 is also reported for adjusted analyses.
RESULTS
The sample included a racially and ethnically diverse sample (63.8% Hispanic/Latina, 7.2% Native American, 2.9% multi-racial). There were no differences in maternal ethnicity, maternal age or gestational age at recruitment, family SES, number of children in the household, and number of households the child had lived in among study groups (all p’s>0.05; Table 1). There were some differences in maternal race, marital status, and education level among the groups (all p’s<0.05: Table 1). With respect to child characteristics, lower birth weight was observed in the three substance exposure groups compared to controls, but no difference among groups was observed in mean gestational age at delivery or prevalence of preterm delivery. Compared to the UC and PAE groups, a high proportion of children in the MOUD group (MOUD=69.2% and MOUD+PAE=80.0%) participated in early intervention programs (p<0.05).
Table 1:
Demographic and Medical Characteristics of Participants (N=69)
| Patient Characteristics | Unexposed Control (n=33) |
MOUD (n=13) |
MOUD + PAE (n=10) |
PAE (n=13) |
p |
|---|---|---|---|---|---|
| Maternal and family characteristics: | |||||
| Mean ± SD | Mean ± SD | Mean ± SD | Mean ± SD | ||
| Maternal age at enrollment (years) | 26.8 ± 5.8 | 29.5 ± 5.8 | 29.2 ± 5.3 | 31.0 ± 6.1 | 0.127a |
| Gestational age at enrollment (weeks) | 26.2 ± 7.3 | 20.7 ± 6.2 | 25.4 ± 5.7 | 27.9 ± 7.2 | 0.053a |
| Family SES scoreb | 35.9 ± 12.4 | 28.2 ± 9.1 | 31.4 ± 8.1 | 34.3 ± 11.7 | 0.222a |
| Number of children in the household | 2.2 ± 1.3 | 1.9 ± 1.6 | 1.9 ± 1.0 | 2.5 ± 1.5 | 0.670c |
| n (%) | n (%) | n (%) | n (%) | ||
| Ethnicity: Hispanic/Latina | 20 (60.6) | 11 (84.6) | 5 (50.0) | 8 (61.5) | 0.330d |
| Race: | 0.001e | ||||
| White | 33 (100.0) | 12 (92.3 | 9 (90.0) | 8 (61.5) | |
| Native American | 0 (0.0) | 1 (7.7) | 0 (0.0) | 4 (30.8) | |
| Multi-racial | 0 (0.0) | 0 (0.0) | 1 (10.1) | 1 (7.7) | |
| Marital/cohabiting status: | 0.007d | ||||
| Single/separated/divorced | 10 (30.3) | 9 (69.2) | 5 (50.0) | 1 (7.7) | |
| Married/cohabitating | 23 (69.7) | 4 (30.8) | 5 (50.0) | 12 (92.3) | |
| Education Level: | <0.001e | ||||
| Less than high school | 4 (12.1) | 9 (69.2) | 5 (50.0) | 1 (7.7) | |
| High school to some college | 20 (60.6) | 4 (30.8) | 5 (50.0) | 9 (69.2) | |
| College/professional degree | 9 (27.3) | 0 (0.0) | 0 (0.0) | 3 (23.1) | |
| ≥ 2 households infant has lived in | 14 (42.4) | 5 (38.5) | 8 (80.0) | 8 (61.5) | 0.130d |
| Infant characteristics: | |||||
| Mean ± SD | Mean ± SD | Mean ± SD | Mean ± SD | ||
| Birth weight (grams) | 3308.5 ± 506.3 | 2857.0 ± 556.9 | 2960.0 ± 829.0 | 2653.6 ± 586.9 | 0.005a |
| Gestational age at delivery (weeks) | 38.8 ± 1.4 | 38.0 ± 1.8 | 38.5 ± 2.9 | 36.9 ± 3.3 | 0.079a |
| n (%) | n (%) | n (%) | n (%) | ||
| Preterm delivery (<37 weeks) | 3 (9.1) | 1 (7.7) | 1 (10.0) | 5 (38.5) | 0.078e |
| Infant’s sex: Male | 16 (48.5) | 8 (61.5) | 5 (50.0) | 4 (30.8) | 0.470d |
| Participation in early intervention program | 6 (18.2) | 9 (69.2) | 8 (80.0) | 3 (23.1) | <0.001e |
Sample size for specific variables might vary due to pairwise deletion of the missing data
based on One-Way ANOVA
Barratt Simplified Measure of Social Status
based on Kruskal-Wallis test
based on Chi-square test
based on Fisher’s exact test
Table 2 shows patterns of substance use by study group. Mean (± SD) alcohol consumption across periconceptional period and pregnancy was 0.7 ± 0.8 AA/day (approximately 10 drinks/week) for the PAE group and 0.5 ± 1.0 AA/day (approximately 7 drinks/week) for the MOUD+PAE group. Additionally, 23.1% of subjects in the PAE group and 60.0% of subjects in the MOUD+PAE group were positive for at least one ethanol biomarker. Among subjects in the MOUD groups, 56.5% were on methadone, 39.1% were on buprenorphine, and 4.3% were on both medications during the course of pregnancy. Marijuana use was prevalent in all three exposure groups (ranged from 38.5% in the MOUD group to 53.8% in the Alcohol group), and tobacco use was highly prevalent in both MOUD groups (84.6% in the MOUD, 70.0% in the MOUD+PAE).
Table 2:
Alcohol and Substance Use Patterns by Study Group (N=69)
| Unexposed Control (n=33) | MOUD (n=13) |
MOUD + PAE (n=10) |
PAE (n=13) |
|
|---|---|---|---|---|
| Cumulative alcohol use across pregnancy & periconceptional period: | ||||
| Mean ± SD | Mean ± SD | Mean ± SD | Mean ± SD | |
| AA/day across 3 TLFB calendarsa (Mean ± SD) | 0.0 ± 0.0 | 0.0 ± 0.0 | 0.5 ± 1.0 | 0.7 ± 0.8 |
| AA/drinking day (Mean ± SD) | 0.06 ± 0.1b | 0.0 ± 0.0 | 1.1 ± 1.2 | 1.4 ± 1.0 |
| Positive for ≥1 biomarkerc at V1 or V2 (n (%)) | 0 (0.0) | 0 (0.0) | 6 (60.0) | 3 (23.1) |
| Substance use in pregnancy (any use): d | ||||
| n (%) | n (%) | n (%) | n (%) | |
| MOUD: | 0 (0.0) | 13 (100.0) | 10 (100.0) | 0 (0.0) |
| Methadone only | 0 (0.0) | 6 (46.2) | 7 (70.0) | 0 (0.0) |
| Buprenorphine only | 0 (0.0) | 6 (46.2) | 3 (30.0) | 0 (0.0) |
| Both methadone and buprenorphine | 0 (0.0) | 1 (7.7) | 0 (0.0) | 0 (0.0) |
| Other opioids (heroin or Rx opioids) | 1 (3.0)e | 5 (38.5) | 7 (70.0) | 2 (15.4)e |
| Marijuana | 0 (0.0) | 5 (38.5) | 4 (40.0) | 7 (53.8) |
| Tobacco use | 0 (0.0) | 11 (84.6) | 7 (70.0) | 1 (7.7) |
Rx, prescription
Note: A statistically significant difference was observed across groups for all alcohol and substance use measures (based on Kruskal-Wallis test for continuous measures and Fisher’s exact test for categorical measures) given eligibility criteria for the study groups
AA, absolute alcohol in ounces (1 standard drink equals approximately 0.5 AA);
Limited alcohol consumption during periconceptional period
A panel of biomarkers include: GGT, gamma-glutamyltranspeptidase; PEth, phosphatidylethanol; UEtG, urine ethyl glucuronide; UEtS, urine ethyl sulfate; %dCDT, disialo carbohydrate deficient transferrin; PEth in infant dried blood spot.
Either self-reported anytime in pregnancy or a positive urine drug panel at V1 or V2
Limited to a short-term use of prescribed opioid analgesics in periconceptional period
Mean (± SD) age of assessment at 6 and 20 months, adjusted for prematurity, was 6.8 ± 1.1 and 20.2 ± 1.5, respectively. Age at assessment was similar among the groups at both 6 months (p=0.240) and 20 months (p=0.120; Table 3). There were no differences in any of the BSID-III scales among study groups at 6 months (all p’s>0.05). At 20 months, group scores were more divergent, with lower scores for BSID-III Cognitive and Language subscales observed in the exposed groups (Table 3). While all three exposed groups had a decrease in scores from 6 to 20 months, the MOUD group had the most pronounced decrease in the Language (−19.1 points) and Cognitive (−13.8 points) mean scores.
Table 3:
Infant Developmental Outcomes at V3 and V4 by Study Group (N=69): Unadjusted Analysis
| Unexposed Control (n=33) |
MOUD (n=13) |
MOUD+PAE (n=10) |
PAE (n=13) |
p a | |
|---|---|---|---|---|---|
| Mean ± SD | |||||
|
Developmental Outcomes at V3 (6 months of age) | |||||
| Child age at assessment (mos.)b | 6.9 ± 1.0 | 6.5 ± 1.1 | 6.6 ± 1.0 | 6.2 ± 1.2 | 0.240 |
| BSID-III: Cognitive | 100.8 ± 9.8 | 100.8 ± 9.3 | 100.5 ± 8.6 | 104.4 ± 6.0 | 0.630 |
| BSID-III: Language | 98.6 ± 7.1 | 101.7 ± 6.5 | 101.5 ± 5.3 | 102.5 ± 6.7 | 0.270 |
| Receptive | 8.6 ± 1.7 | 9.5 ± 1.9 | 9.6 ± 1.3 | 9.3 ± 1.5 | 0.210 |
| Expressive | 10.9 ± 1.1 | 11.1 ± 1.1 | 10.9 ± 0.9 | 11.5 ± 1.1 | 0.490 |
| BSID-III: Motor | 95.6 ± 13.4 | 96.2 ± 10.2 | 90.8 ± 8.1 | 99.2 ± 10.3 | 0.390 |
| Fine | 9.9 ± 2.3 | 9.5 ± 1.6 | 9.4 ± 1.4 | 11.1 ± 2.0 | 0.160 |
| Gross | 8.6 ± 3.0 | 9.2 ± 2.3 | 7.5 ± 2.2 | 8.6 ± 1.8 | 0.510 |
|
Developmental Outcomes at V4 (20 months of age) | |||||
| Child age at assessment (mos.)b | 19.8 ± 1.2 | 19.8 ± 1.2 | 20.7 ± 1.6 | 20.6 ± 1.5 | 0.120 |
| BSID-III: Cognitive | 101.2 ± 10.6 | 86.9 ± 11.3 | 91.5 ± 11.8 | 94.6 ± 15.9 | 0.003 |
| BSID-III: Language | 95.9 ± 16.7 | 82.6 ± 12.3 | 86.7 ± 13.1 | 89.9 ± 20.1 | 0.064 |
| Receptive | 9.5 ± 3.0 | 6.9 ± 2.3 | 8.0 ± 2.8 | 8.5 ± 4.2 | 0.059 |
| Expressive | 9.1 ± 3.1 | 6.9 ± 2.2 | 7.4 ± 1.8 | 8.0 ± 3.0 | 0.130 |
| BSID-III: Motor | 97.2 ± 10.8 | 91.0 ± 10.9 | 90.3 ± 12.3 | 90.6 ± 13.2 | 0.110 |
| Fine | 10.3 ± 2.4 | 8.5 ± 2.9 | 9.6 ± 2.0 | 8.7 ± 3.0 | 0.200 |
| Gross | 8.7 ± 2.1 | 8.2 ± 1.4 | 7.1 ± 2.4 | 8.5 ± 1.6 | 0.072 |
|
Mean changes (unadjusted) in BSID-III scores between 6 months and 20 months of age: | |||||
| BSID-III: Cognitive | 0.5 ± 13.6 | −13.8 ± 14.3 | −9.0 ± 13.3 | −9.8 ± 14.5 | 0.015 |
| BSID-III: Language | −2.7 ± 15.6 | −19.1 ± 16.5 | −14.8 ± 15.4 | −12.6 ± 18.3 | 0.018 |
| Receptive | 0.9 ± 3.1 | −2.8 ± 3.3 | −1.6 ± 3.7 | −0.8 ± 4.3 | 0.014 |
| Expressive | −1.9 ± 2.7 | −4.2 ± 2.7 | −3.5 ± 1.8 | −3.5 ± 2.5 | 0.061 |
| BSID-III: Motor | 1.5 ± 13.3 | −5.2 ± 13.4 | −0.5 ± 9.8 | −8.6 ± 12.5 | 0.082 |
| Fine | 0.4 ± 2.9 | −0.9 ± 3.3 | 0.2 ± 2.0 | −2.4 ± 2.7 | 0.036 |
| Gross | 0.2 ± 3.0 | −1.0 ± 2.0 | −0.4 ± 2.0 | −0.2 ± 2.1 | 0.440 |
based on Kruskal-Wallis test for between group variation
age adjusted for prematurity
The resulting regression coefficients from the mixed models are summarized in Table 4. The group-by-time interaction plots for the change in BSID-III Cognitive, Language, and Motor scores between 6 and 20 months are shown in Figure 1. These plots show the stability over time in BSID-III scale scores for each of the study groups, with the p-value indicating an overall difference. There was a significant three-way interaction (MOUD-by-PAE-by-Time) with respect to the BSID-III Cognitive (p=0.045) and Motor (p=0.033) scales. These three-way interactions for Cognitive (p=0.022) and Motor (p=0.017) scales remained significant after adjusting for SES and infant sex (Table 4, Fig. 1a, e). While the unexposed control group remained approximately the same or improved for these measures, the MOUD and PAE BSID-III Cognitive and Motor scale scores declined across time, as did the MOUD+PAE BSID-III Cognitive scale score, and the MOUD+PAE BSID-III Motor scale score was low at both time points. The three-way interaction did not reach statistical significance for the BSID-III Language scale (p=0.107), and remained non-significant after adjusting for SES and infant sex (p=0.085) (Table 4, Fig. 1c). For all BSID-III subscale measures, the effect of SES was found to be significant (Table 4, all p’s <0.05), while infant sex was not found to be significant (all p’s >0.05).
Table 4:
Predictors of Infant Developmental Outcomes in Mixed Effects Analysis
| Cognitive | Language | Motor | ||||
|---|---|---|---|---|---|---|
|
| ||||||
| Estimate (SE) | p | Estimate (SE) | p | Estimate (SE) | p | |
| Intercept | 93.22 (3.51) | <0.001 | 90.71 2.98) | <0.001 | 86.58 (4.46) | <0.001 |
| Main effects | ||||||
| MOUD (vs UC) | 2.91 (3.18) | 0.365 | 4.98 (2.43) | 0.045 | 3.73 (3.94) | 0.348 |
| PAE (vs UC) | 3.68 (3.04) | 0.230 | 4.31 (2.31) | 0.067 | 4.03 (3.76) | 0.288 |
| Time (20 vs 6 months) | 0.16 (2.44) | 0.949 | −2.09 (2.88) | 0.470 | 1.37 (2.26) | 0.545 |
| Two-way interactions | ||||||
| MOUD-by-PAE | −5.59 (5.07) | 0.275 | −4.85 (3.86) | 0.214 | −10.63 (6.28) | 0.096 |
| MOUD-by-Time | −14.74 (4.67) | 0.003 | −16.32 (5.51) | 0.004 | −7.46 (4.32) | 0.090 |
| PAE-by-Time | −9.93 (4.54) | 0.033 | −10.52 (5.36) | 0.054 | −9.99 (4.20) | 0.021 |
| Three-way interactions | ||||||
| MOUD-by-PAE-by-Time | 17.84 (7.59) | 0.022 | 15.72 (8.96) | 0.085 | 17.3 (7.03) | 0.017 |
| Covariates | ||||||
| Infant sex: male | −1.85 (1.85) | 0.319 | −0.12 (1.61) | 0.942 | −0.96 (2.36) | 0.685 |
| Family SES | 0.23 (0.08) | 0.006 | 0.22 (0.07) | 0.004 | 0.26 (0.11) | 0.017 |
SE, standard error
Figure 1. Changes in BSID-III Cognitive, Language, and Motor Scores from 6 Months to 20 Months by Study Group Adjusted for Child Sex and Family SES.
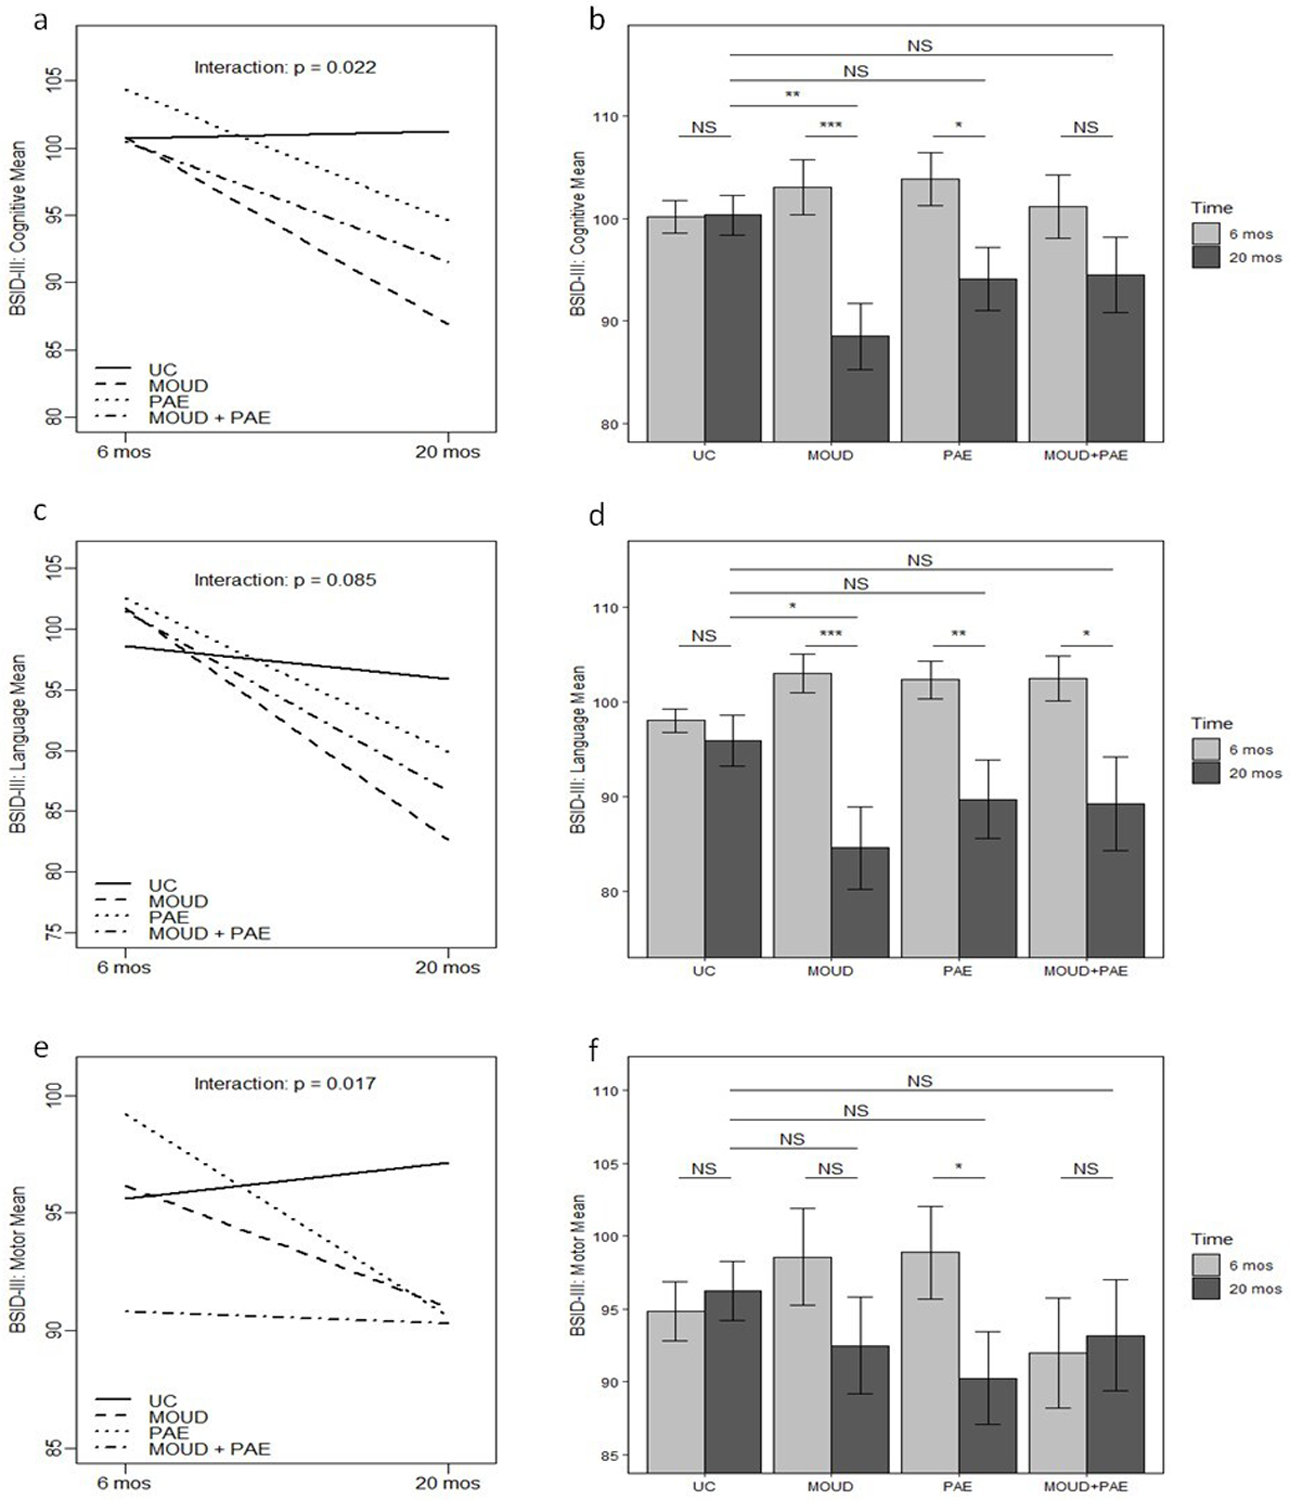
The change in BSID-III mean scores from 6 months to 20 months is shown in a for Cognitive, c for Language, and e for Motor. The p-value is for the three-way interaction (MOUD-by-PAE-by-Time) with respect to the BSID-III score. Bar plots summarize statistical significance of pairwise comparisons for the differences between 6 months and 20 months within each study group (row directly above bars), as well as comparisons of each study group to the UC group at 20 months (top 3 rows in plot); b is for BSID-III Cognitive score, d is for BSID-III Language score, and f is for BSID-III Motor score.
NS, non-significant (p ≥0.05)
*** p < 0.001, ** p < 0.01, * p < 0.05
Interaction plots after stratification by BSID-III Expressive vs. Receptive Language subscales and Gross and Fine Motor subscales are shown in Supplemental Fig. a through d. A significant group-by-time interaction was observed for Expressive Language (p=0.030), Receptive Language (p=0.023), and for Fine Motor (p=0.029) subscales indicating that changes in scores between two assessments for those scales varied among study groups.
The bar plots in Figure 1 summarize the specific pairwise comparisons in mean estimates for between group and within group (6 vs. 20 months) differences. With respect to within-group change, in models adjusted for child sex and family SES, significant changes between 6 and 20 months in the BSID-III Cognitive scores were observed for the MOUD (−14.6 points, p<0.001) and PAE (−9.8 points, p=0.013) groups, but not for the MOUD+PAE (p=0.153) or the Control (p=0.949) groups (Fig. 1b). Similarly, significant changes between 6 and 20 months in the BSID-III Language scores were observed for the MOUD group (−18.4 points, p<0.001), PAE (−12.6 points, p=0.007), and MOUD+PAE (−13.2 points, p=0.018) groups, but not for the Controls (p=0.470) (Fig. 1d). For the Motor subscale, only the PAE group demonstrated a significant within-group change in scores between 6 and 20 months (−8.6 points, p=0.018) (Fig. 1f). With respect to between-group variation, in models adjusted for child sex and family SES, significant changes were observed between the MOUD group and Controls at 20 months for the Cognitive (−11.8 points, p = 0.003) and Language (−11.3 points, p = 0.030) subscales (Fig. 1b, d, respectively), as well as a change at alpha=0.10 for the PAE group compared to Controls for the Cognitive subscale (−6.2 points, p=0.094).
DISCUSSION
This study looked at the developmental trajectory during the first two years of life in a group of children with prenatal exposures to alcohol and/or opioids and a control group of unexposed children, in areas of cognition, language, and motor skills. We hypothesized that differences would be more apparent during the second year of life, when developmental testing is able to measure a larger variety of skills in a child. Our findings supported this hypothesis in the area of cognition as all three prenatal exposed groups had significantly lower BSID-III Cognitive scores compared to controls at 20 months. In the area of language, both MOUD groups were significantly lower (9–12 points) than the control group on the BSID-III Language scores. In the area of Motor scores, no significant differences were detected between any group and the control group at 20 months. These findings partially replicate Flannery et al. (2020) who found significant differences on the BSID-III Cognitive, Language and Motor scales for 18-month-old children exposed to opioids.25
Numerous studies have found that SES is an important mediator for neurodevelopmental outcomes for a variety of conditions, including prenatal alcohol exposure,5 prematurity,26 and prenatal drug exposure.14 SES was included as a covariate along with child sex in mixed models assessing change at 20 months within groups, and between prenatally exposed groups and the Control group. In these models, sex of the child was not a significant predictor; however, SES was a significant predictor for BSID-III scores for all four study groups. In these adjusted models, statistically significant differences were observed between the MOUD group and the Control group for Cognitive and Language BSID-III scores at alpha level of 0.05, and change for the PAE group for Cognitive BSID-III scores at alpha level of 0.10.
Our hypothesis that there would be a significant decrease in BSID-III scores over time, from 6 to 20 months, for the subjects with prenatal exposures but not the unexposed controls was supported for the Cognitive and Language subscales. The BSID-III is a normed and validated test, with test-retest found to be robust.27 Therefore, the stability in scores for the control group supports the reliability of measures for the BSID-III scales and supports a meaningful change in abilities for the exposed groups during the second year of life. After adjustment for SES and infant sex, the greatest difference from 6 to 20 months was observed for the MOUD group that demonstrated a 18.4 decrease in Language scores and a 14.6-point decrease for Cognitive scores, which was close to or more than the 15-point standard deviation for the BSID-III scale. A decline close to one standard deviation was also observed for the Language score in the MOUD+PAE (13.2 points) and PAE (12.6 points) groups. These results are similar to findings in the literature for preterm children where cognitive and language deficits usually become more pronounced by 12–18 months of age.25,28,29
We have previously reported no differences in BSID scores in infants prenatally exposed to opioids compared to controls at 6 months of age; however, we observed subtle differences in infant’s self-regulation and sensation seeking behaviors.17 Several recent systematic reviews summarized the effects of PAE on neurodevelopmental outcomes, adaptive behaviors, and self-regulation in toddlers.30,31 A systematic review by Garrison et al.30 found that among 24 publications that included a specific assessment of neurocognitive behavior (typically by the BSID) during the first two years of life, only 54% demonstrated significant deficits with PAE.30 Deficits in self-regulation were observed more consistently (in 75% of studies). In general, the effects of PAE on infant/toddler neurodevelopment are highly dependent on the study population, level of exposure, developmental tests used, and family environment.
Our study did not find the significant effect of infant sex on neurodevelopmental outcomes, which is in contrast with the recent Danish Family Outpatient Clinics historical cohort, which reported poorer cognitive and language development in boys after prenatal opioid exposure.11 Other studies suggested that developmental delays in girls with prenatal opioid exposure might become more apparent as they reach school age.32 In a prospective longitudinal study of children with prenatal exposure to methadone with comprehensive neurodevelopmental evaluation at 4.5 years of age, school readiness was found to be significantly affected by the male sex, higher social risk, and quality of postnatal environment.33
Our findings of significant decline in BSID-III scores over time is extremely important as children who are tested at a younger age may be identified to have skills within the normal range in the first year of life, but this may not be the case once they get older. There are many possible reasons for the decline in scores, which can include the test itself, as the range of cognitive and language skills a 6-month-old child can perform limits the types of tasks that can be measured via standardized assessments, such as the BSID-III. By 20 months of age, early working memory and communication skills can be assessed, allowing for more complex and varied test items.34,35 It is also possible that family socio-environmental factors and parenting style may impact changes in the developmental scores over time36,37 highlighting an important area for further research. Though we did not look directly at the impact of early intervention services (due to their heterogeneity and variability in quality and intensity), it was interesting to note that significantly more of the children in both MOUD groups were enrolled in early intervention programs, though these children also had the lowest development scores at 20 months. It is important to note that infants with perinatal drug exposure automatically qualify for early intervention services in New Mexico under the ‘medically at-risk category’. There are only 5 other states (Florida, Massachusetts, California, New Hampshire, and West Virginia) that have an ‘at-risk’ criterion allowing services to begin after birth. Other states require children to have an identified delay, ranging from 20% to 50% in one area of development or a delay of 1.5 to 2 standard deviations on a standardized measure in one or more areas of development, to be eligibile for early intervention services.38 According to this study, most children would not qualify for early intervention services until closer to two years of age, when more substantial delays can be identified using standardized testing. It would be beneficial to have future research explore the impact of age at enrollment in early intervention programs on overall development.
The current results indicate that direct interventions for children, regardless of early indications of normal developmental progression, may be warranted. Findings also emphasize the importance of longitudinal research. While the logistical and budgetary constraints of this cohort did not allow for more frequent assessments during the first two years of life, more frequent testing in future studies would allow for the identification of neurodevelopmental delays when they first appear. One possibility for more intensive follow up might be partnership with State-funded early intervention programs. Additionally, further investigation into ways to improve development in children exposed to MOUD would be pertinent.
There are strengths and limitations to this study. First, we acknowledge that the lost to follow-up rate between 6 to 20 months was higher than anticipated (33%), especially in the MOUD+PAE group. Dropout rates for the unexposed controls were 10%, while the MOUD, PAE, and MOUD+PAE were 39%, 41% and 58%, respectively. Second, we also acknowledge a relatively small sample size per group which precluded detection of smaller differences at 6 months. Nevertheless, changes over time were associated with a large effect size detectable with the present sample size. Third, while efforts have been made to minimize the effect of prenatal (excluded subjects with co-exposure to methamphetamines, MDMA, cocaine) and postnatal (infant sex, family SES) factors, we acknowledge a potential role of residual confounding. Fourth, we recognize that neurodevelopmental outcomes in the MOUD groups might be affected by the severity of the Neonatal Opioid Withdrawal Syndrome (NOWS), as previously reported;17 however, adjustment for NOWS severity might not be appropriate in the current study since it is likely be a factor on a causal pathway rather than a confounder. Other ongoing studies in the field focus on approaches to minimize NOWS severity and examine the effect of different NOWS treatment approaches on the long-term neurodevelopmental outcomes. Finally, we acknowledge that this study focused on developmental outcomes related to the BSID-III Cognitive, Language and Motor scales, while other measures and assessment tools of neurodevelopment, such as the Child Behavior Checklist,25,39 sensory processing and temperament scales,28 and MRI imaging,40 might be important to incorporate in future studies to more comprehensively characterize developmental outcomes.
These limitations should be viewed in light of the strengths, including the prospective cohort design in which maternal-infant pairs were followed from mid-pregnancy to two years after birth with repeated evaluation of neurodevelopmental outcomes. Another strength of the study was the rigorous manner used to obtain exposure information (prospective repeated self-report during pregnancy accompanies by the study-specific biomarker batteries), as well as detailed information on the family’s socio-economic background and pre-/postpartum environment. Furthermore, the BSID-III was administered by examiners who were certified, highly trained in the scale, and blinded to exposure status, which helped ensure the testing was completed in a standardized manner.
In conclusion, this study addresses the importance of using a longitudinal approach in the evaluation of children with prenatal polysubstance exposure. The significant decrease in cognitive and language developmental scores over the first two years of life in children with prenatal opioid and alcohol exposures highlights the importance of programs that provide both early identification and effective intervention programs for high-risk children.
Data availability:
The datasets generated and/or analyzed during the current study are not publicly available due to lack of data sharing acknowledgement of de-identified data in the consent and IRB protocol. The request for data sharing can be considered on a case-by-case basis with a formal data sharing agreement between institutions.
Supplementary Material
Impact:
BSID-III scores were stable during the first two years of life for unexposed children.
BSID-III scores declined for children with prenatal exposures to alcohol and/or opioids.
Standard developmental tests may not be sensitive enough during the first year of life.
Findings emphasize the need for repeated evaluations of children that are at high risk.
Funding:
Research reported in this publication was supported by the National Institute on Alcohol Abuse and Alcoholism of the National Institutes of Health under Award Number R01AA021771. The content is solely the responsibility of the authors and does not necessarily represent the official views of the National Institutes of Health.
Footnotes
Competing Interests: The authors declare no conflict of interest.
Consent: Written informed consent was obtained from all participants.
REFERENCES
- 1.Haight SC, Ko JY, Tong VT, Bohm MK & Callaghan WM Opioid Use Disorder Documented at Delivery Hospitalization - United States, 1999–2014. Morb. Mortal. Wkly. Rep 67, 845–849 (2018). [DOI] [PMC free article] [PubMed] [Google Scholar]
- 2.Conradt E et al. Prenatal Opioid Exposure: Neurodevelopmental Consequences and Future Research Priorities. Pediatrics 144, e20190128 (2019). [DOI] [PMC free article] [PubMed] [Google Scholar]
- 3.May PA et al. Prevalence of Fetal Alcohol Spectrum Disorders in 4 Us Communities. JAMA 319, 474–482 (2018). [DOI] [PMC free article] [PubMed] [Google Scholar]
- 4.Denny CH, Acero CS, Terplan M & Kim SY Trends in Alcohol Use among Pregnant Women in the U.S., 2011–2018. Am. J. Prev. Med 59, 768–769 (2020). [DOI] [PMC free article] [PubMed] [Google Scholar]
- 5.Coles CD et al. Gestational Age and Socioeconomic Status as Mediators for the Impact of Prenatal Alcohol Exposure on Development at 6 Months. Birth Defects Res 111, 789–796 (2019). [DOI] [PMC free article] [PubMed] [Google Scholar]
- 6.Tella P et al. Socioeconomic Diversities and Infant Development at 6 to 9 Months in a Poverty Area of São Paulo, Brazil. Trends Psychiatry Psychother 40, 232–240 (2018). [DOI] [PubMed] [Google Scholar]
- 7.Koski MA & Ingram EM Child Abuse and Neglect: Effect on Bayley Scale Scores. J. Abnorm. Child. Psychol 5, 79–91 (1977). [DOI] [PubMed] [Google Scholar]
- 8.Kingston D, Tough S & Whitfield H Prenatal and Postpartum Maternal Psychological Distress and Infant Development: A Systematic Review. Child Psychiatry Hum. Dev 43, 683–714 (2012). [DOI] [PubMed] [Google Scholar]
- 9.Bayley N & Psychological Corporation. Bayley Scales of Infant and Toddler Development 3rd edn. (Psychological Corporation, New York, 2006). [Google Scholar]
- 10.Bode MM, DʼEugenio DB, Mettelman BB & Gross SJ Predictive Validity of the Bayley, Third Edition at 2 Years for Intelligence Quotient at 4 Years in Preterm Infants. J. Dev. Behav. Pediatr 35, 570–575 (2014). [DOI] [PubMed] [Google Scholar]
- 11.Skumlien M, Ibsen IO, Kesmodel US & Nygaard E Sex Differences in Early Cognitive Development after Prenatal Exposure to Opioids. J. Pediatr. Psychol 45, 475–485 (2020). [DOI] [PMC free article] [PubMed] [Google Scholar]
- 12.Hendricks G et al. Prenatal Alcohol Exposure Is Associated with Early Motor, but Not Language Development in a South African Cohort. Acta Neuropsychiatr 32, 1–8 (2020). [DOI] [PMC free article] [PubMed] [Google Scholar]
- 13.Hans SL & Jeremy RJ Postneonatal Mental and Motor Development of Infants Exposed in Utero to Opioid Drugs. Infant Ment. Health J 22, 300–315 (2001). [Google Scholar]
- 14.Levine TA & Woodward LJ Early Inhibitory Control and Working Memory Abilities of Children Prenatally Exposed to Methadone. Early Hum. Dev 116, 68–75 (2018). [DOI] [PubMed] [Google Scholar]
- 15.Messinger DS et al. The Maternal Lifestyle Study: Cognitive, Motor, and Behavioral Outcomes of Cocaine-Exposed and Opiate-Exposed Infants through Three Years of Age. Pediatrics 113, 1677–1685 (2004). [DOI] [PubMed] [Google Scholar]
- 16.Bakhireva LN et al. Role of Caregiver-Reported Outcomes in Identification of Children with Prenatal Alcohol Exposure During the First Year of Life. Pediatr. Res 84, 362–370 (2018). [DOI] [PMC free article] [PubMed] [Google Scholar]
- 17.Bakhireva LN et al. Association between Prenatal Opioid Exposure, Neonatal Opioid Withdrawal Syndrome, and Neurodevelopmental and Behavioral Outcomes at 5–8 Months of Age. Early Hum. Dev 128, 69–76 (2019). [DOI] [PMC free article] [PubMed] [Google Scholar]
- 18.Bakhireva LN, Lowe JR, Gutierrez HL & Stephen JM Ethanol, Neurodevelopment, Infant and Child Health (Enrich) Prospective Cohort: Study Design Considerations. Adv. Pediatr. Res 2, e20150428 (2015). [DOI] [PMC free article] [PubMed] [Google Scholar]
- 19.Jacobson SW, Chiodo LM, Sokol RJ & Jacobson JL Validity of Maternal Report of Prenatal Alcohol, Cocaine, and Smoking in Relation to Neurobehavioral Outcome. Pediatrics 109, 815–825 (2002). [DOI] [PubMed] [Google Scholar]
- 20.Coles CD et al. Dose and Timing of Prenatal Alcohol Exposure and Maternal Nutritional Supplements: Developmental Effects on 6-Month-Old Infants. Matern. Child Health J 19, 2605–2614 (2015). [DOI] [PMC free article] [PubMed] [Google Scholar]
- 21.Barratt W The Barratt Simplified Measure of Social Status (Indiana State University, Indiana, 2006). [Google Scholar]
- 22.Bender R & Lange S Adjusting for Multiple Testing--When and How? J. Clin. Epidemiol 54, 343–349 (2001). [DOI] [PubMed] [Google Scholar]
- 23.Neter J, Kutner MH, Nachtsheim CJ & Wasserman W Applied Linear Statistical Models 4th edn. (Irwin, Chicago, 1996). [Google Scholar]
- 24.SAS Institute Inc. Sas/Stat User’s Guide, Version 15.2, ‘the Mixed Procedure’, Cary, NC, Available at https://documentation.sas.com/doc/en/statug/15.2/statug_mixed_toc.htm.
- 25.Flannery T et al. Neonatal Abstinence Syndrome Severity Index Predicts 18-Month Neurodevelopmental Outcome in Neonates Randomized to Morphine or Methadone. J. Pediatr 227, 101–107 (2020). [DOI] [PMC free article] [PubMed] [Google Scholar]
- 26.McGowan EC & Vohr BR Neurodevelopmental Follow-up of Preterm Infants: What Is New? Pediatr. Clin. North Am 66, 509–523 (2019). [DOI] [PubMed] [Google Scholar]
- 27.Bayley N Bayley Scales of Infant and Toddler Development (PsychCorp, Pearson 2006).
- 28.Kaltenbach K et al. Prenatal Exposure to Methadone or Buprenorphine: Early Childhood Developmental Outcomes. Drug Alcohol Depend 185, 40–49 (2018). [DOI] [PMC free article] [PubMed] [Google Scholar]
- 29.Nguyen TN et al. Language Trajectories of Children Born Very Preterm and Full Term from Early to Late Childhood. J. Pediatr 202, 86–91 (2018). [DOI] [PubMed] [Google Scholar]
- 30.Garrison L, Morley S, Chambers CD & Bakhireva LN Forty Years of Assessing Neurodevelopmental and Behavioral Effects of Prenatal Alcohol Exposure in Infants: What Have We Learned? Alcohol Clin. Exp. Res 43, 1632–1642 (2019). [DOI] [PMC free article] [PubMed] [Google Scholar]
- 31.Subramoney S, Eastman E, Adnams C, Stein DJ & Donald KA The Early Developmental Outcomes of Prenatal Alcohol Exposure: A Review. Front. Neurol 9, 1108 (2018). [DOI] [PMC free article] [PubMed] [Google Scholar]
- 32.Nygaard E, Moe V, Slinning K & Walhovd KB Longitudinal Cognitive Development of Children Born to Mothers with Opioid and Polysubstance Use. Pediatr. Res 78, 330–335 (2015). [DOI] [PMC free article] [PubMed] [Google Scholar]
- 33.Lee SJ, Pritchard VE, Austin NC, Henderson JMT & Woodward LJ Health and Neurodevelopment of Children Born to Opioid-Dependent Mothers at School Entry. J. Dev. Behav. Pediatr 41, 48–57 (2020). [DOI] [PubMed] [Google Scholar]
- 34.Woodward LJ, Edgin JO, Thompson D & Inder TE Object Working Memory Deficits Predicted by Early Brain Injury and Development in the Preterm Infant. Brain 128, 2578–2587 (2005). [DOI] [PubMed] [Google Scholar]
- 35.Lowe JR et al. Early Working Memory as a Racially and Ethnically Neutral Measure of Outcome in Extremely Preterm Children at 18–22 Months. Early Hum. Dev 89, 1055–1061 (2013). [DOI] [PMC free article] [PubMed] [Google Scholar]
- 36.Lowe JR et al. Maternal Verbal Scaffolding: Association with Higher Language Skills for 20-Month-Old Children with Prenatal Polysubstance Exposure. Early Hum. Dev 160, e105423 (2021). [DOI] [PMC free article] [PubMed] [Google Scholar]
- 37.Landry SH, Smith KE, Swank PR, Assel MA & Vellet S Does Early Responsive Parenting Have a Special Importance for Children’s Development or Is Consistency across Early Childhood Necessary? Dev. Psychol 37, 387–403 (2001). [DOI] [PubMed] [Google Scholar]
- 38.Early Childhood Technical Assistance Center. State and Jurisdictional Eligibility Definitions for Infants and Toddlers with Disabilities under Idea Part C, Chapel Hill, NC, Available at https://ectacenter.org/topics/earlyid/state-info.asp. [Google Scholar]
- 39.Czynski AJ et al. Neurodevelopmental Outcomes of Neonates Randomized to Morphine or Methadone for Treatment of Neonatal Abstinence Syndrome. J. Pediatr 219, 146–151 (2020). [DOI] [PMC free article] [PubMed] [Google Scholar]
- 40.Peterson BS et al. Associations of Maternal Prenatal Drug Abuse with Measures of Newborn Brain Structure, Tissue Organization, and Metabolite Concentrations. JAMA Pediatr 174, 831–842 (2020). [DOI] [PMC free article] [PubMed] [Google Scholar]
Associated Data
This section collects any data citations, data availability statements, or supplementary materials included in this article.
Supplementary Materials
Data Availability Statement
The datasets generated and/or analyzed during the current study are not publicly available due to lack of data sharing acknowledgement of de-identified data in the consent and IRB protocol. The request for data sharing can be considered on a case-by-case basis with a formal data sharing agreement between institutions.