Abstract
Background
Breadfruit (Artocarpus spp.) is the main genus of Moraceae with multipurpose benefits, both ecologically and economically important, e.g., food ingredients, building materials, traditional medicine, and natural insecticides. However, most endemic Artocarpus have been threatened due to natural disasters and habitat degradation. The objective of our study was to determine the genetic diversity and relationships of endemic Artocarpus from South Borneo, Indonesia, using an internal transcribed spacer (ITS) region and leaf morphology.
Results
Morphologically, endemic Artocarpus endemic to South Borneo, Indonesia, has a different leaf shape, i.e., narrow-obovate to broad-elliptic, from simple to deeply dissected. Following the ITS region, this germplasm has a moderate level of nucleotide diversity (0.069). The phylogenetic analysis revealed Artocarpus into four (4) main clades, where the nearest is shown by the ‘Puyian’ (Artocarpus rigidus) and ‘Binturung’ (Artocarpus odoratissimus) at a coefficient divergence of 0.027, whereas the furthest by ‘Kulur’ (A. camansi) and ‘Tiwadak’ (A. integer) at a coefficient of 0.132.
Conclusion
In brief, although an endemic Artocarpus of South Borneo, Indonesia, has a moderate level of nucleotide diversity, this germplasm also shows a unique phylogenetic relationship. Thus, this information is urgent in supporting the future Artocarpus breeding and preservation programs, mainly to save this germplasm from being threatened.
Supplementary Information
The online version contains supplementary material available at 10.1186/s43141-023-00476-y.
Keywords: Genetic diversity, Breadfruit (Artocarpus spp.), Phylogenetic relationship, Breeding and preservation, Nuclear DNA
Background
Breadfruit (Artocarpus spp.) is the main genus of Moraceae with multipurpose benefits, both ecologically and economically important, e.g., food ingredients, building materials, traditional medicine, and natural insecticides [1–3]. For example, Artocarpus altilis (‘sukun’— Java), Artocarpus heterophyllus (‘nangka’ — Java), Artocarpus integer (‘cempedak’ — Java), Artocarpus lakoocha (‘Mahat’ — Thai), Artocarpus lanceifolius (‘keledang’ — Banjar), and Artocarpus kemando (‘cempedak air’ — Malay) are six species of Artocarpus whose fruits are edible or can made for foodstuffs [4]. The bark of A. lanceifolius, A. integer, and A. heterophyllus can be used as building materials because they are permanent and durable [2]. The leaves of A. altilis are known to be efficacious in traditional medicine, especially for treating cirrhosis of the liver, hypertension, and diabetes [2].
Globally, Artocarpus has high genetic diversity, consisting of 70 species spread throughout the world, mainly in southern and southeastern Asia, including India, Sri Lanka, Pakistan, China, Malaysia, and Indonesia, as well as the Solomon Islands [1, 5]. For Indonesia, Artocarpus has recorded as many as 30 species and is present on five large islands, including Java, Sumatra, Borneo (Kalimantan), Sulawesi, and Maluku [6]. However, Borneo is the largest, with 23 species, and is estimated to be the center of the world’s Artocarpus diversity [1]. However, due to the deforestation or over-conversion of land, especially for agricultural, plantation, and settlement purposes, part of Artocarpus began to be scarce and difficult to find in the wild [7].
IUCN [8] reported seven Artocarpus with vulnerable status, i.e., Artocarpus rubrovenus, Artocarpus anisophyllus, Artocarpus tamaran, Artocarpus treculianus, Artocarpus hypargyreus, Artocarpus nobilis, and Artocarpus blancoi. Meanwhile, A annulatus and A. nanchuanensis are critically endangered [8]. Consequently, conservation or preservation, including their breeding and cultivation efforts to save various species of Artocarpus, is urgent. Conceptually, conservation activities aim to ensure the continuity of species, habitats, and biological communities, as well as interactions between species, including between species and their ecosystems [7]. Meanwhile, breeding and cultivation efforts aim to preserve essential genes with superior properties for future use [9].
On the other hand, the genetic characterization of germplasm using molecular markers is currently becoming alternative and complementary to the morphological characterization commonly used, as reported in Artocarpus by Jones et al. [10], Estalansa et al. [11], Karunarathne et al. [12], and Daley et al. [13]. In general, although quite expensive, molecular markers provide high speed and accuracy in the genetic characterization of germplasm [14]. In contrast, morphological ones tend to be time-consuming and are strongly influenced by environmental factors. Internal transcribed spacer (ITS) is the nuclear molecular marker that is useful in determining genetic diversity and the relationship of Artocarpus, including its taxonomy [5, 15].
Unlike chloroplast DNA with inherited maternally, the ITS is inherited biparentally [16]. Besides, due to the universality and simplicity of amplifying and showing a high mutation rate, the ITS provides better resolution in the estimation of the genetic diversity of most plants [16, 17]. Some plants that successfully verified using this marker are as follows: Acanthopanacis [18], Anoectochilus [17], Dioscorea [19], Litsea [20], Uncaria [21], and Zanthoxylum [22].
This study aimed to determine the genetic diversity and relationships of endemic Artocarpus to South Borneo, Indonesia, using ITS marker and leaf morphology. Our results provide essential information for future Artocarpus preservation and breeding tasks, especially in Indonesia.
Materials and methods
Plant materials
In this study, we used 14 (leaf) samples of breadfruit (Artocarpus spp.) collected from a part of Borneo Island, especially three regencies in South Borneo, Indonesia (Fig. 1). All were characterized morphologically and molecularly. Table 1 provides complete information about the Artocarpus samples used in the study.
Fig. 1.
The map of South Borneo, Indonesia, shows the sampling location and the number of samples collected each. For more information about those samples, see Table 1
Table 1.
Breadfruit species (Artocarpus spp.) used in the study, including their origin and genetic status
| Local name | Species | Code | Regency origin | Genetic status |
|---|---|---|---|---|
| ‘Karusung’ | A. anisophyllus | A1 | Barito Kuala | Endemic |
| ‘Tiwadak’ | A. integer | A2 | Balangan | Endemic |
| ‘Kulur’ | A. camansi | A3 | Hulu Sungai Selatan | Endemic |
| ‘Tarap’ | A. sericicarpus | A4 | Balangan | Endemic |
| ‘Anjani’ | A. hirsutus | A5 | Hulu Sungai Selatan | Introductiona |
| ‘Nangka’ | A. heterophyllus | A6 | Hulu Sungai Selatan | Endemic |
| ‘Mantiwadaka’ | A. kemando | A7 | Balangan | Endemic |
| ‘Kulidang’ | A. lanceifolius | A8 | Hulu Sungai Selatan | Endemic |
| ‘Tampang Susu’ | A. limpato | A9 | Balangan | Endemic |
| ‘Binturung 1’ | A. odoratissimus | A10 | Balangan | Endemic |
| ‘Binturung 2’ | A. odoratissimus | A11 | Balangan | Endemic |
| ‘Tampang’ | A. primackii | A12 | Balangan | Endemic |
| ‘Puyian’ | A. rigidus | A13 | Balangan | Endemic |
| ‘Tiwadak Banyu’ | A. teysmannii | A14 | Balangan | Endemic |
Remarks: aFrom India
Morphological analysis
Morphological analysis was conducted by leaf characteristics only. It was performed descriptively using the guidance of Ragone and Wiseman [23].
Molecular analysis
All leaf samples of Artocarpus were extracted by a commercial DNA extraction kit (GP100) from Geneaid Biotech Ltd., Taiwan. The concentration and purity of DNAs were determined by UV-VIS spectrophotometry. The DNAs were then amplified by ITS primers [24] (forward: 5′-TCGTAACAAGGTTTCCGTAGGTG-3′; reverse: 5′-TCCTCCGCTTATTGATATGC-3′), using these reactions: initial denaturation (94 °C for 5 m); denaturation (94 °C for 30 s); annealing (48 °C for 30 s); extension (72 °C for 45 s); and final extension (72 °C for 7 m) [25]. The PCR was employed using 25 μl of a total volume, comprising of 20 ng DNA template (2 μl), 0.2 μmol forward and reverse primers (0.5 μl each), and 22 μl of MyTaq HS Red PCR Mix (Bioline, UK). The PCR product (DNA target) was visualized by electrophoresis of agarose gel (2%) and a UV transilluminator and then sequenced bidirectionally using the Sanger method (1st Base Ltd., Malaysia).
Data analysis
The data (ITS sequences of Artocarpus) were reconstructed and analyzed manually by the MEGA 11 [26]. All were then aligned using MultAlin [27] to find out some mutational events, both substitution (transition-transversion) and indels (insertion-deletion). The genetic diversity (π) was determined using the Nei and Li [28] criteria, i.e., low (≤ 0.04), moderate (0.05–0.07), and height (≥ 0.08), whereas haplotype (h) and haplotype diversity (Hd) by DnaSP ver. 6.0 [29]. The phylogenetic tree was reconstructed by the maximum likelihood (ML) with a Kimura-2 parameter and a nearest-neighbor-interchange (NNI) model [26, 30]. The phylogenetic tree was evaluated by bootstrap statistics (1000 replicates) and confirmed using principal component analysis or PCA [31]. The secondary structure ITS was also analyzed and reconstructed using the online software of ITS2 Workbench (http://its2.bioapps.biozentrum.uni-wuerzburg.de/) [32].
Results
Morphologically, endemic Artocarpus has a different leaf shape, namely narrow-obovate to broad-elliptic, from simple to deeply dissected (Fig. 2). The simple narrow-obovate leaf was shown by ‘Tiwadak’ or A. integer (A2), whereas the broad-elliptic by ‘Puyian’ or A. rigidus (A13). Besides, the narrow deeply dissected leaf was shown by ‘Mantiwadaka’ or A. kemando (A7), whereas the broad one was by ‘Kulur’ or Artocarpus camansi (A3) (see Fig. 2).
Fig. 2.
Leaf morphology of endemic breadfruit (Artocarpus spp.) from South Borneo, Indonesia, shows two different forms, i.e., narrow-obovate to broad-elliptic, from simple to shallowly dissected. The name of each sample is provided in Table 1
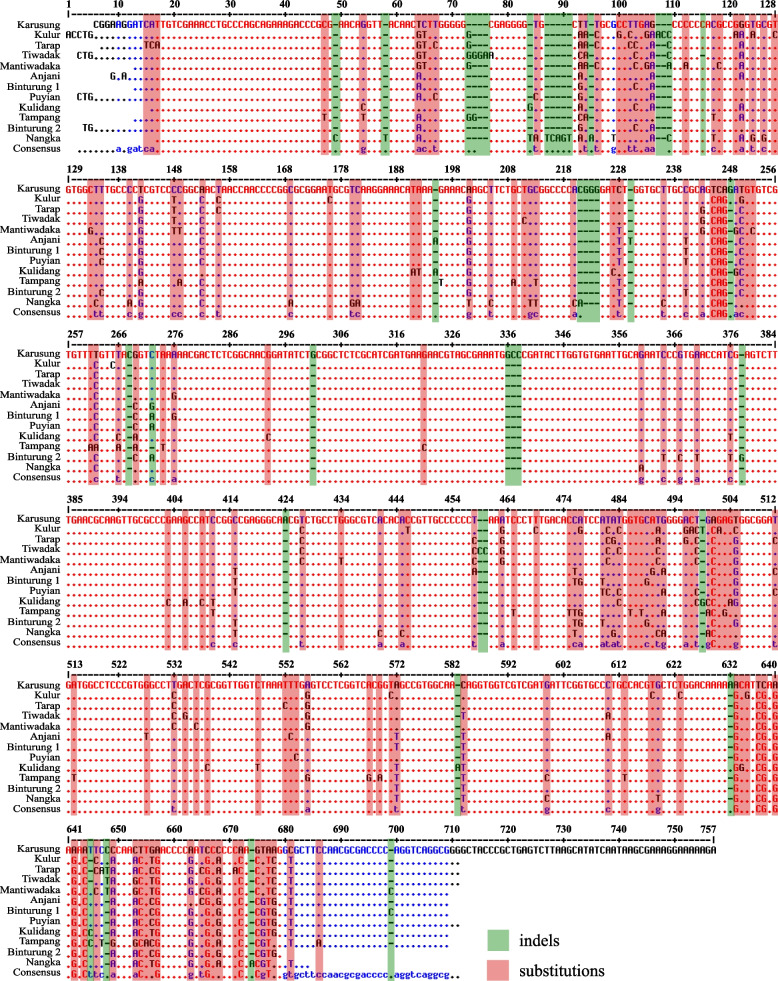
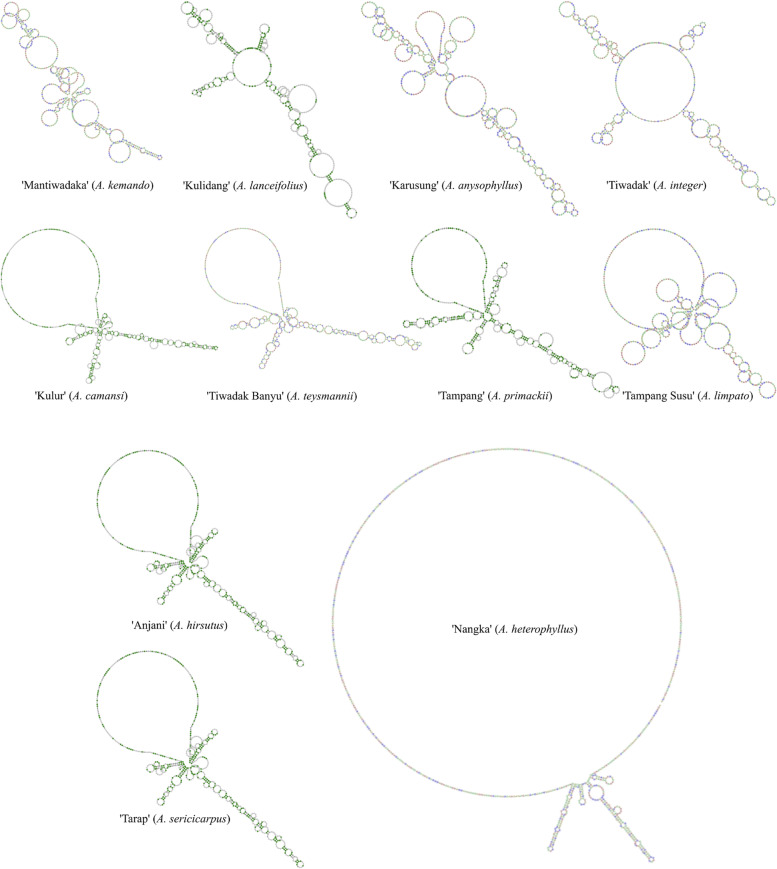
The sequencing results showed that endemic Artocarpus had different partial ITS sequence lengths, between 640 and 727 bp (Table 2). In this case, the shortest ITS sequence is shown by ‘Binturung-2’ (A. odoratissimus), whereas the longest is by ‘Karusung’ (Artocarpus anysophyllus). After being aligned, several mutation events are seen in the ITS sequence, especially substitutions and indels or insertions-deletions (Fig. 3). Table 3 presents various genetic characteristics of ITS Artocarpus sequences, from mutation events and GC content to nucleotide or molecular diversity. Meanwhile, Fig. 4 shows the substitution pattern of the ITS Artocarpus sequence in more detail. When reconstructed, these sequences have unique secondary structures (Fig. 5). However, only 11 of the 14 samples had predictable ones. Meanwhile, ‘Anjani’ (Artocarpus hirsutus) and ‘Tarap’ (Artocarpus sericicarpus) have a similar ITS secondary structure (see Fig. 5).
Table 2.
Endemic breadfruit species (Artocarpus spp.) used in the study, including the length of ITS sequences
| Local Name | Species | Code | ITS length (bp) |
|---|---|---|---|
| ‘Karusung’ | A. anisophyllus | A1 | 727b |
| ‘Tiwadak’ | A. integer | A2 | 643 |
| ‘Kulur’ | A. camansi | A3 | 679 |
| ‘Tarap’ | A. sericicarpus | A4 | 669 |
| ‘Anjani’ | A. hirsutus | A5 | 665 |
| ‘Nangka’ | A. heterophyllus | A6 | 697 |
| ‘Mantiwadaka’ | A. kemando | A7 | 663 |
| ‘Kulidang’ | A. lanceifolius | A8 | 661 |
| ‘Tampang Susu’ | A. limpato | A9 | 660 |
| ‘Binturung 1’ | A. odoratissimus | A10 | 660 |
| ‘Binturung 2’ | A. odoratissimus | A11 | 640a |
| ‘Tampang’ | A. primackii | A12 | 660 |
| ‘Puyian’ | A. rigidus | A13 | 671 |
| ‘Tiwadak Banyu’ | A. teysmannii | A14 | 677 |
Remarks: aShortest, blongest
Fig. 3.
Multiple sequence alignments, showing two mutational events, i.e., substitutions and indels, from ITS sequence of endemic breadfruit (Artocarpus spp.) from South Borneo, Indonesia
Table 3.
The genetic information of ITS sequence of endemic breadfruit (Artocarpus spp.) from South Borneo, Indonesiaa
| Parameter | ITS |
|---|---|
| Number of observed bases (n) | 760 |
| Polymorphic (segregating) sites (bp) | 215 |
| Substitution (transition-transversion) sites (bp) | 174 |
| Indel (insertion-deletion) sites (bp) | 53 |
| Singleton (single-nucleotide polymorphism) sites (bp) | 110 |
| Parsimony informative sites (bp) | 89 |
| Nucleotide diversity (π) | 0.069 |
| Number of haplotypes (h) | 14 |
| Haplotype (gene) diversity (Hd) | 1.000 |
| GC content (%) | 58.64 |
| Bayesian information criterion (BIC) | 5992.844 |
| Akaike information criterion (AICc) | 5807.212 |
| Maximum likelihood value (lnL) | −2877.531 |
aBy Kimura 2 (K2) model
Fig. 4.

Nucleotide substitution patterns of endemic breadfruit (Artocarpus spp.) from South Borneo, Indonesia
Fig. 5.
The secondary structures of the breadfruit (Artocarpus spp.) ITS sequence endemic to South Borneo, Indonesia, shows different forms. In this case, ‘Anjani’ (A. hirsutus) and ‘Tarap’ (A. sericicarpus) have similar
Following Fig. 3 and Table 3, the total mutation or polymorphic (segregating) site of Artocarpus ITS is 215 bp, of which substitution (174 bp) is more than indels (53 bp). In addition, singleton mutations (110 bp) are also higher than parsimony informative sites (89 bp) (see Table 3). Referring to the similar table, Artocarpus has a nucleotide diversity of 0.069, a haplotype diversity of 1.000, with a GC content of 58.64%. Furthermore, based on Fig. 4, the ITS Artocarpus sequence has the highest substitution pattern for the transition of 23.8 for the change of T to C, while the transversion is 5.3 for G to C and C to A, respectively.
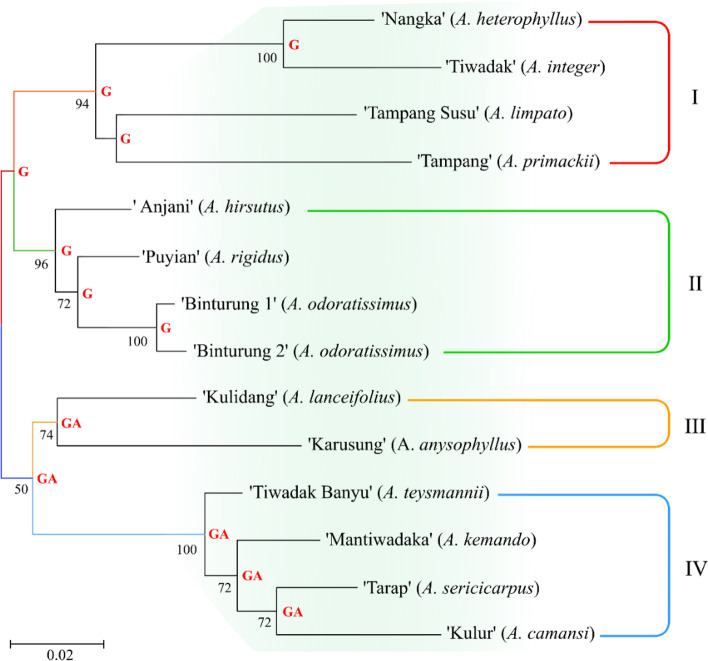
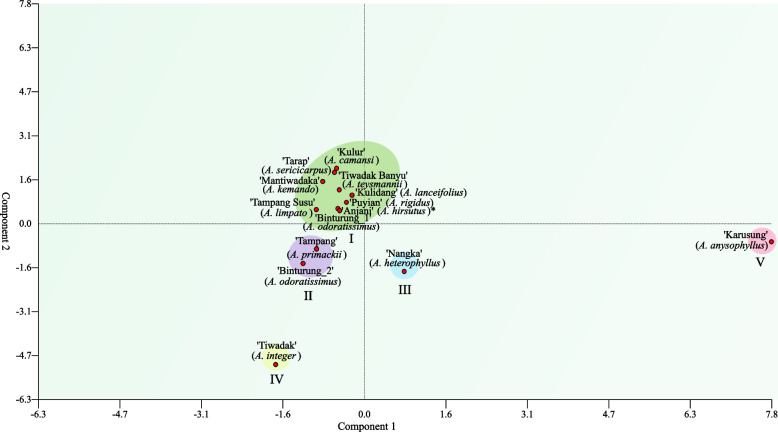
Analysis of genetic relationship used the maximum likelihood method, separating endemic Artocarpus into four (4) main clades, of which three clades (I, II, and IV) consist of 4 samples or members while the remaining (clade III) are only two (Fig. 6). However, the principal component (PCA) analysis confirmed the grouping of Artocarpus into five groups, where the first was the largest with nine samples (Fig. 7).
Fig. 6.
The phylogenetic tree shows the grouping of endemic breadfruit (Artocarpus spp.) from South Borneo, Indonesia, into four main clades. Values and letters (nucleotides) on nodes indicate the bootstrap analysis 1000 times and possible ancestors, respectively
Fig. 7.
Grouping of endemic breadfruit (Artocarpus spp.) from South Borneo, Indonesia, into five main groups based on principal component analysis (PCA)
Based on Fig. 6, Artocarpus was split into two large groups polyphyletically, of which clades 1 and 2 became the first group with G ancestor, while clades 3 and 4 were the second groups (GA ancestor). In other words, the first group, consisting of clades 1 and 2, is monophyletic, as are clades 3 and 4, because they have the same ancestry, respectively. In this case, ‘Tiwadak’ or breadfruit (A. integer) has the closest relationship to ‘Nangka’ or jackfruit (A. heterophyllus), similarly ‘Tampang Susu’ (A. limpato) with ‘Tampang’ (A. primackii) (see Fig. 6).
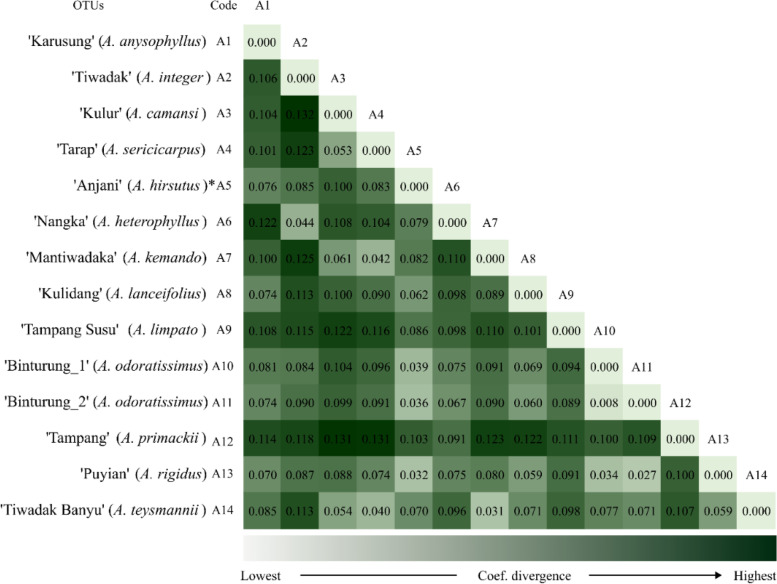
Further analysis (Fig. 8) shows that the relationship of the nearest Artocarpus belongs to the ‘Puyian’ (A. rigidus) with the ‘Binturung_2’ (A. odoratissimus) at a coefficient divergence of 0.027. In contrast, the furthest relationship is between ‘Kulur’ (A. camansi) and ‘Tiwadak’ (A. integer) at a coefficient of 0.132 (Fig. 8). In addition, the relationship of ‘Tiwadak’ (A. integer) with ‘Jackfruit’ (A. heterophyllus) is recorded at coefficient 0.044, as for ‘Tampang Susu’ (A. limpato) and ‘Tampang’ (A. primackii) at 0.111 (see Fig. 8).
Fig. 8.
The heatmap shows the relationship among endemic breadfruit (Artocarpus spp.) from South Borneo, Indonesia, based on the coefficient divergence value. In this case, the lower the coefficient value, the closer the genetic relationship would be
Discussion
Based on morphological observations, endemic breadfruit (Artocarpus spp.) from South Borneo, Indonesia, shows a different leaf shape, i.e., simple narrow-obovate to broad-elliptic deeply dissected (Fig. 2). According to Doyle [33], simple leaves exhibit primitive evolution rather than more complex dissected. It corresponds to the ‘telome’ theory, which leaves are proposed to have evolved through independent processes of branching, planation, webbing, and overtopping [34]. Referring to Harrison and Morris [35], initial constraints to leaf evolution probably involved several factors, e.g., high atmospheric global temperatures, low stomatal densities, and low water uptake capacities before root evolution.
Following the Nei and Li [28] criteria, this germplasm has a moderate level of genetic diversity (see Table 3). It is quite an encouraging thing. In plant breeding activities, information about genetic diversity is indispensable. According to Witherup et al. [36], maintaining crop diversity is urgent in retaining their capability for future adaptation. In other words, insufficient genetic diversity may cause crop failures. Also, maintaining genetic diversity is essential to support the current and upcoming crop breeding initiatives.
In concept, mutations are the main factor giving rise to genetic diversity. In other words, mutations are genetic changes that occur spontaneously in an allele or chromosome in which genetic diversity appears [37]. In this study, the ITS sequence of Artocarpus showed several mutations, especially substitutions and indels (see Fig. 3). According to Chen and Shiau [38], this region has a higher nucleotide substitution rate, making it suitable for genetic diversity and the related study between germplasm [19]. Besides, the gene occasionally exhibits entire codon insertions or deletions, showing a conservative pattern of nucleotide replacement [39]. However, although this mutation has significant benefits remains the question in some plant families of whether a gene can maintain the stable structure and function of the protein produced [40].
Apart from the presence of mutations in the ITS sequence of Artocarpus, using wild or underutilized populations (minor crops) with certain important traits may broaden the genetic diversity level and improve agricultural quality for both pests and diseases resistance; drought, salinity, and other abiotic stresses tolerance; and gain higher quality and yield ability. Witherup et al. [36] also state that most underutilized or minor crops provide a unique opportunity to quantify genetic diversity baselines before bottleneck selection is present and to implement practice learning from other crops that have previously suffered losses. Although most studies focus on the diversity loss of primary crops, many minor crops are now systematic improvement targets for the development of uniform lines and industrialization [9].
In particular, the development of Artocarpus is currently directed toward the dwarf cultivars assembling. For example, breadfruit (A. altilis), a traditional staple crop for starchy in the tropics, is modified to be dwarf due to vulnerability to wind damage [40]. In this case, dwarfing rootstocks of breadfruit may come from wild relatives, for example, A. anisophyllus, A. hirsutus, A. camansi, A. nitidus, Artocarpus mariannensis, A. integer, A. heterophyllus, A. lakoocha, Artocarpus petelotii, and Artocarpus xanthocarpus. The last two species may be good candidates for dwarfism because they have a height of about 10 and 8 m, respectively [41].
Thus, information about genetic relationships is also essential to consider. In this study, the nearest Artocarpus is shown by the ‘Puyian’ (A. rigidus) and ‘Binturung’ (A. odoratissimus) at a coefficient divergence of 0.027, whereas the furthest by ‘Kulur’ (A. camansi) and ‘Tiwadak’ (A. integer) at a coefficient of 0.132 (Fig. 8). According to Mursyidin and Makruf [7], Artocarpus exhibits a complex phylogenetic relationship. For example, using nucleus genes, Zerega and Gardner [3] reported the close relationship between Artocarpus nitidus, A. heterophyllus, and A. camansi. Following microsatellite markers, Zerega et al. [36] revealed the closeness of A. camansi to A. mariannensis. Meanwhile, based on the complete chloroplast gene, Li and Song [42] reported the genetic proximity between A. heterophyllus and Artocarpus nanchuanensis.
According to Acquaah [43], when two individuals with far relationships cross, the genetic diversity of the offspring may be extant. Conversely, if the two closely related crosses, it will produce offspring with narrow genetic diversity. However, for the latter case, crosses between such elders tend to be avoided as they can result in inbreeding descendants. Referring to de Los Reyes [44], inbreeding will increase susceptibility to disease and stress, including decreasing crop yields.
Conclusion
The results showed that breadfruit (Artocarpus spp.) from South Borneo, Indonesia, has two types of leaf morphology with moderate genetic diversity at the nucleotide level, amounting to 0.069. Meanwhile, the genetic relationship analysis revealed that the nearest Artocarpus is shown by the ‘Puyian’ (A. rigidus) and ‘Binturung’ (A. odoratissimus) at a coefficient divergence of 0.027, whereas the furthest by ‘Kulur’ (A. camansi) and ‘Tiwadak’ (A. integer) at a coefficient of 0.132. This information is urgent in supporting the future Artocarpus breeding and preservation programs.
Supplementary Information
Additional file 1. The ITS transcript of each Artocarpus sample used in this study.
Acknowledgements
Thanks to Ahyar, Riyan, Fitri, and Ardi, who have assisted in molecular analysis in the laboratory. We also express our gratitude to Hanif Wicaksono for most of the Artocarpus samples provided.
Abbreviations
- ITS
Internal transcribed spacer
- IUCN
The International Union for Conservation of Nature
- ML
Maximum likelihood
- PCA
Principal component analysis
- PCR
Polymerase chain reaction
Authors’ contributions
DHM conceptualized and designed the overall study, analyzing data, and writing a final manuscript. AS carried out sample collection, molecular analysis, and writing a draft manuscript. The authors read and approved the final manuscript.
Funding
Not applicable.
Availability of data and materials
All samples of endemic breadfruit (Artocarpus spp.) used in this study were deposited in the Laboratory of Genetics and Molecular Biology, Faculty of Mathematics and Natural Sciences, University of Lambung Mangkurat, Indonesia.
Declarations
Ethics approval and consent to participate
Not applicable.
Consent for publication
Not applicable.
Competing interests
The authors declare that they have no competing interests.
Footnotes
Publisher’s Note
Springer Nature remains neutral with regard to jurisdictional claims in published maps and institutional affiliations.
References
- 1.Williams EW, Gardner EM, Harris R, Chaveerach A, Pereira JT, Zerega NJC. Out of Borneo: biogeography, phylogeny and divergence date estimates of Artocarpus (Moraceae) Ann Bot. 2017;119:611–627. doi: 10.1093/aob/mcw249. [DOI] [PMC free article] [PubMed] [Google Scholar]
- 2.Soifoini T, Donno D, Jeannoda V, Rakotoniaina E, Hamidou S, Achmet SM, Solo NR, Afraitane K, Giacoma C, Beccaro GL. Bioactive compounds, nutritional traits, and antioxidant properties of Artocarpus altilis (Parkinson) fruits: exploiting a potential functional food for food security on the Comoros Islands. J Food Qual. 2018;2018:1–11. doi: 10.1155/2018/5697928. [DOI] [Google Scholar]
- 3.Zerega NJC, Gardner EM. Delimitation of the new tribe Parartocarpeae (Moraceae) is supported by a 333-gene phylogeny and resolves tribal level Moraceae taxonomy. Phytotaxa. 2019;388:253–265. doi: 10.11646/phytotaxa.388.4.1. [DOI] [Google Scholar]
- 4.Ragone D. Ist IS on Breadfruit Research & Development. 2007. Breadfruit: diversity, conservation and potential; pp. 19–30. [Google Scholar]
- 5.Senavirathna HMTN, Ranaweera LT, Mudannayake MMAWP, Nawanjana PWI, Wijesundara WMDA, Jayarathne HSM, Ratnasuriya MAP, Weebadde CK, Sooriyapathirana SDSS. Assessment of the taxonomic status of the members of genus Artocarpus (Moraceae) in Sri Lanka. Genet Resour Crop Evol. 2020;67:1163–1179. doi: 10.1007/s10722-020-00902-x. [DOI] [Google Scholar]
- 6.Hakim A. Diversity of secondary metabolites from genus Artocarpus (Moraceae) Nusant Biosci. 2010;2:146–156. doi: 10.13057/nusbiosci/n020307. [DOI] [Google Scholar]
- 7.Mursyidin DH, Makruf MI. Keanekaragaman dan kekerabatan genetik Artocarpus berdasarkan penanda DNA kloroplas matK & rbcL: Kajian in silico. Floribunda. 2020;6:167–206. doi: 10.32556/floribunda.v6i5.2020.322. [DOI] [Google Scholar]
- 8.IUCN . Artocarpus. 2022. [Google Scholar]
- 9.Yan W. A systematic narration of some key concepts and procedures in plant breeding. Front Plant Sci. 2021;12:1–20. doi: 10.3389/fpls.2021.724517. [DOI] [PMC free article] [PubMed] [Google Scholar]
- 10.Jones AMP, Murch SJ, Wiseman J, Ragone D. Morphological diversity in breadfruit (Artocarpus, Moraceae): insights into domestication, conservation, and cultivar identification. Genet Resour Crop Evol. 2013;60:175–192. doi: 10.1007/s10722-012-9824-8. [DOI] [Google Scholar]
- 11.Estalansa H, Yuniastuti E, Hartati S. The diversity of breadfruit plants (Artocarpus altilis) based on morphological characters. Agrotechnology Res J. 2018;2:80–85. doi: 10.20961/agrotechresj.v2i2.21800. [DOI] [Google Scholar]
- 12.Karunarathne SI, Ranaweera LT, Daundasekera DMKC, Ananda GKS, Kannangara SK, Ranathunga APDT, Madhukalpani OVS, Weebadde CK, Sooriyapathirana SDSS. Assessment of the applicability of morphometric, organoleptic and phylogenetic analyses to differentiate soft and firm flesh bearing trees of jackfruit (Artocarpus heterophyllus Lam.) in Sri Lanka. J Agric Sci - Sri Lanka. 2018;13:200–218. doi: 10.4038/jas.v13i3.8394. [DOI] [Google Scholar]
- 13.Daley OO, Roberts-Nkrumah LB, Alleyne AT. Morphological diversity of breadfruit [Artocarpus altilis (Parkinson) Fosberg] in the Caribbean. Sci Hortic (Amsterdam) 2020;266:1–12. doi: 10.1016/j.scienta.2020.109278. [DOI] [Google Scholar]
- 14.Mursyidin DH, Purnomo P, Sumardi I, Daryono BS. Molecular diversity of tidal swamp rice (Oryza sativa L.) in South Kalimantan, Indonesia. Diversity. 2018;10:1–10. doi: 10.3390/d10020022. [DOI] [Google Scholar]
- 15.Aneklaphakij C, Bunsupa S, Sirichamorn Y, Bongcheewin B, Satitpatipan V (2020) Taxonomic notes on the ‘Mahat’ (Artocarpus lacucha and A. thailandicus, Moraceae) species complex in Thailand. Plants 9. 10.3390/plants9030391 [DOI] [PMC free article] [PubMed]
- 16.Lee SY, Mohamed R, Faridah-Hanum I, Lamasudin DU. Utilization of the internal transcribed spacer (ITS) DNA sequence to trace the geographical sources of Aquilaria malaccensis Lam. populations. Plant Genet Resour Characterisation Util. 2017;16:103–111. doi: 10.1017/S1479262117000016. [DOI] [Google Scholar]
- 17.Thinh BB, Chac LD, Thu LTM. Application of internal transcribed spacer (ITS) sequences for identifying Anoectochilus setaceus Blume in Thanh Hoa, Vietnam. Proc Appl Bot Genet Breed. 2020;181:108–116. doi: 10.30901/2227-8834-2020-2-108-116. [DOI] [Google Scholar]
- 18.Zhao S, Chen X, Song J, Pang X, Chen S. Internal transcribed spacer 2 barcode: a good tool for identifying Acanthopanacis cortex. Front Plant Sci. 2015;6:1–7. doi: 10.3389/fpls.2015.00840. [DOI] [PMC free article] [PubMed] [Google Scholar]
- 19.Purnomo P, Daryono BS, Shiwachi H. Phylogenetic relationship of Indonesian water yam (Dioscorea alata L.) cultivars based on DNA marker using ITS-rDNA analysis. J Agric Sci. 2017;9:154. doi: 10.5539/jas.v9n2p154. [DOI] [Google Scholar]
- 20.Fijridiyanto IA, Murakami N. Evaluating the utility of external transcribed spacer (ETS) and internal transcribed spacer sequences (ITS) for phylogenetic analysis of Litsea Lam. (Lauraceae) and related genera. Bul Kebun Raya. 2019;22:47–68. [Google Scholar]
- 21.Zhu S, Li Q, Chen S, Wang Y, Zhou L, Zeng C, Dong J. Phylogenetic analysis of Uncaria species based on internal transcribed spacer (ITS) region and ITS2 secondary structure. Pharm Biol. 2018;56:548–558. doi: 10.1080/13880209.2018.1499780. [DOI] [PMC free article] [PubMed] [Google Scholar]
- 22.Zhao LL, Feng SJ, Tian JY, Wei AZ, Yang TX. Internal transcribed spacer 2 (ITS2) barcodes: a useful tool for identifying Chinese Zanthoxylum. Appl Plant Sci. 2018;6:1–8. doi: 10.1002/aps3.1157. [DOI] [PMC free article] [PubMed] [Google Scholar]
- 23.Ragone D, Wiseman J. Developing and applying descriptors for breadfruit germplasm. Acta Hortic. 2007;757:71–80. doi: 10.17660/ActaHortic.2007.757.8. [DOI] [Google Scholar]
- 24.Dizkirici A, Kaya Z, Cabi E, Doǧan M. Phylogenetic relationships of Elymus L. and related genera (Poaceae) based on the nuclear ribosomal internal transcribed spacer sequences. Turk J Botany. 2010;34:467–478. doi: 10.3906/bot-0912-249. [DOI] [Google Scholar]
- 25.Mursyidin DH, Nazari YA, Badruzsaufari MMRD. DNA barcoding of the tidal swamp rice (Oryza sativa) landraces from South Kalimantan, Indonesia. Biodiversitas. 2021;22:1593–1599. doi: 10.13057/biodiv/d220401. [DOI] [Google Scholar]
- 26.Tamura K, Stecher G, Kumar S. MEGA11: Molecular Evolutionary Genetics Analysis Version 11. Mol Biol Evol. 2021;38:3022–3027. doi: 10.1093/molbev/msab120. [DOI] [PMC free article] [PubMed] [Google Scholar]
- 27.Mitchell C. MultAlin-multiple sequence alignment. Cabios Softw Rev. 1993;9:614–615. [Google Scholar]
- 28.Nei M, Li W-H. Mathematical model for studying genetic variation in terms of restriction endonucleases (molecular evolution/mitochondrial DNA/nucleotide diversity) PNAS. 1979;76:5269–5273. doi: 10.1073/pnas.76.10.5269. [DOI] [PMC free article] [PubMed] [Google Scholar]
- 29.Rozas J, Ferrer-Mata A, Sanchez-DelBarrio JC, Guirao-Rico S, Librado P, Ramos-Onsins SE, Sanchez-Gracia A. DnaSP 6: DNA sequence polymorphism analysis of large data sets. Mol Biol Evol. 2017;34:3299–3302. doi: 10.1093/molbev/msx248. [DOI] [PubMed] [Google Scholar]
- 30.Lemey P, Salemi M, Vandamme A-M. The phylogenetic handbook: a practical approach to phylogenetic analysis and hypothesis testing, Second. Cambridge: Cambridge University Press; 2009. [Google Scholar]
- 31.Mursyidin DH, Khairullah I, Syamsudin R. Genetic diversity and relationship of Indonesian swamp rice (Oryza sativa L.) germplasm based on agro-morphological markers. Agric Nat Resour. 2022;56:95–104. doi: 10.34044/j.anres.2021.56.1.09. [DOI] [Google Scholar]
- 32.Koetschan C, Hackl T, Müller T, Wolf M, Förster F, Schultz J. ITS2 database IV: interactive taxon sampling for internal transcribed spacer 2 based phylogenies. Mol Phylogenet Evol. 2012;63:585–588. doi: 10.1016/j.ympev.2012.01.026. [DOI] [PubMed] [Google Scholar]
- 33.Doyle JA. Origin of angiosperms. Annu Rev Ecol Syst. 1978;9:365–392. doi: 10.1146/annurev.es.09.110178.002053. [DOI] [Google Scholar]
- 34.Zumajo-Cardona C, Vasco A, Ambrose BA. The evolution of the KANADI gene family and leaf development in lycophytes and ferns. Plants. 2019;8:1–11. doi: 10.3390/plants8090313. [DOI] [PMC free article] [PubMed] [Google Scholar]
- 35.Harrison CJ, Morris JL (2018) The origin and early evolution of vascular plant shoots and leaves. Philos Trans R Soc B Biol Sci 373. 10.1098/rstb.2016.0496 [DOI] [PMC free article] [PubMed]
- 36.Witherup C, Zuberi MI, Hossain S, Zerega NJC. Genetic diversity of Bangladeshi jackfruit (Artocarpus heterophyllus) over time and across seedling sources. Econ Bot. 2019;73:233–248. doi: 10.1007/s12231-019. [DOI] [Google Scholar]
- 37.Frankham R, Ballou JD, Briscoe DA. A primer of conservation genetics. Cambridge: Cambridge University Press; 2004. [Google Scholar]
- 38.Chen JR, Shiau YJ. Application of internal transcribed spacers and maturase K markers for identifying Anoectochilus, Ludisia, and Ludochilus. Biol Plant. 2015;59:485–490. doi: 10.1007/s10535-015-0520-3. [DOI] [Google Scholar]
- 39.Clegg MT. Chloroplast gene sequences and the study of plant evolution. PNAS. 1993;90:363–367. doi: 10.1073/pnas.90.2.363. [DOI] [PMC free article] [PubMed] [Google Scholar]
- 40.Kar P, Goyal AK. Plant DNA Barcoding and Phylogenetics. Germany: Lambert Academic Publishing; 2015. Maturase K gene in plant DNA barcoding and phylogenetics; pp. 79–90. [Google Scholar]
- 41.Zhou Y, Taylor MB, Underhill SJR. Dwarfing of breadfruit (Artocarpus altilis) trees: opportunities and challenges. Am J Exp Agric. 2014;4:1743–1763. [Google Scholar]
- 42.Li Y, Song Y. The chloroplast genome of an endangered tree Artocarpus nanchuanensis (Moraceae) Mitochondrial DNA Part B Resour. 2019;4:893–894. doi: 10.1080/23802359.2019.1574684. [DOI] [Google Scholar]
- 43.Acquaah G, et al. Conventional plant breeding principles and techniques. In: Al Khayri JM, et al., editors. Advances in Plant Breeding Strategies: Breeding, Biotechnology and Molecular Tools. Cham: Springer International Publishing; 2015. pp. 115–158. [Google Scholar]
- 44.de Los Reyes BG. Genomic and epigenomic bases of transgressive segregation – new breeding paradigm for novel plant phenotypes. Plant Sci. 2019;288:1–10. doi: 10.1016/j.plantsci.2019.110213. [DOI] [PubMed] [Google Scholar]
Associated Data
This section collects any data citations, data availability statements, or supplementary materials included in this article.
Supplementary Materials
Additional file 1. The ITS transcript of each Artocarpus sample used in this study.
Data Availability Statement
All samples of endemic breadfruit (Artocarpus spp.) used in this study were deposited in the Laboratory of Genetics and Molecular Biology, Faculty of Mathematics and Natural Sciences, University of Lambung Mangkurat, Indonesia.


