

Abstract
Identification of safe and valid PET radioligands for mGluR5 is essential to measure changes in brain mGluR5 in neuropsychiatric disorders, to confirm central mGluR5 occupancy of drug candidates, and to guide dose selection for obtaining an optimum therapeutic window. Here we present the results of a first-in-human study assessing the safety and effectiveness of a novel PET radiopharmaceutical, [18F]FPEB, for quantifying regional brain concentrations of mGluR5.
Methods
Quantification of whole body biokinetics was conducted in 6 healthy adult male participants. The radiation safety profile was estimated with OLINDA/EXM software. Subsequently, pairs of dynamic brain scans were undertaken by 8 healthy participants to identify optimal methods for derivation of regional distribution volume and binding potential, and to determine the repeatability of measurement.
Results
The whole body effective radiation dose was ~17 μSv/MBq (62 mrem/mCi), with the gallbladder receiving the highest dose of 191 μSv/MBq. In brain studies, time activity curves showed high accumulation in the insula/caudate nucleus, moderate uptake in thalamus, and the lowest concentration in cerebellum/pons. Plasma reference graphical analysis method appeared optimal for [18F]FPEB; it showed acceptable test-retest variability (<10%) and identified the highest BPND values (from ~0.5 in globus pallidus to ~3.5 in insula) for target regions. Safety assessments revealed no clinically meaningful changes in vital signs, electrocardiogram, or laboratory values.
Conclusion
[18F]FPEB is safe and well tolerated and its regional cerebral distribution is consistent with previous reports in the literature. The repeatability of measurement suggests that [18F]FPEB is suitable for quantifying mGluR5 in humans.
Keywords: Positron Emission Tomography (PET), Neuroreceptors, Metabotropic Glutamate Receptor Subtype 5 (mGluR5), 3-Fluoro-5-[(pyridin-3-yl)ethynyl]benzonitrile (FPEB), [18F]FPEB, Radioligand, human radiation dosimetry
INTRODUCTION
Metabotropic glutamate receptors (mGluRs) offer a plausible alternative to ionotropic receptors for drug development, as they are involved in most aspects of normal brain function through the modulation of synaptic transmission and cell excitability (1,2). Specifically, the mGluR, subtype 5 (mGluR5) seems to be an important regulator of the glutamatergic system due to its hypothesized involvement in anxiolytic, antidepressant, and anti-addictive effects, memory processes, and neurotransmitter release (3). Thus, several pharmaceutical companies have focused significant resources on the development of drugs to act directly at, or modulate, mGluR5; the clinical use of these drugs, however, could be limited by side effects such as amnesia and psychotomimetic symptoms (4–7). A clinically established PET radiotracer would be valuable for demonstrating differences in brain mGluR5 expression in healthy individuals and patients, for confirming central occupancy of novel mGluR5 drug candidates, and for guiding dose selection.
The preclinical evaluation of several recently developed mGluR5 radiotracers (8–11) support mGluR5 as a quantifiable target by PET in mice and non-human primates. One such radiotracer was [18F]3-Fluoro-5-[(pyridin-3-yl)ethynyl]benzonitrile ([18F]FPEB), a potent, selective mGluR5 inhibitor with excellent properties as a CNS ligand (12). [18F]FPEB is a synthetic, low molecular weight, high specific activity tracer that selectively labels mGluR5 in vitro and in vivo and provides high quality mGluR5 specific images in rhesus monkey PET studies (12). PET imaging with [18F]FPEB results in a large, long-lived specific signal with the highest uptake in the caudate and lowest uptake in the cerebellum in non-human primates, consistent with autoradiographic results (12). These data strongly indicate that [18F]FPEB is a suitable candidate for further clinical development. Two other radiolabelled mGluR5 antagonists, [11C]ABP688 and [18F]SP203 (13–14), have been evaluated in humans. Figure 1 shows the chemical structure of these radioligands and [18F]FPEB.
Figure 1.

Structures of radiolabelled mGluR5 antagonists.
We report here the first human study designed to assess the safety and effectiveness of [18F]FPEB for quantifying regional brain concentrations of mGluR5. The study included an initial whole body study to define the tissue and organ radiation dose associated with a single intravenous (iv) administration of [18F] FPEB, and dynamic brain imaging method development with test-retest reliability of measurement analyses. The human dynamic brain PET imaging paradigm facilitated the validation of [18F]FPEB for quantifying mGluR5 by characterizing its regional kinetics and its ability to generate robust outcome measures of binding potential (BPND), or distribution volumes (VT). We hypothesized that the precision of measurement would provide reliable quantification of mGluR5 BPND and VT in humans, and that the variance in measurements of regional cerebral mGluR5 densities would be acceptable (±10%) for quantifying parameters in a manner consistent with other established PET tracers. We hypothesized that one or two single iv doses of [18F]FPEB would be safe and well tolerated by participants.
MATERIALS AND METHODS
Subjects, Eligibility, and Overall Study Design
This was an open-label, two-part, first-in-human pilot study conducted under an exploratory U.S. IND including and following animal toxicology and safety studies of the unlabeled imaging agent and initial non-human radiation dosimetry carried out at Merck Research Laboratories (15). All procedures were approved by The Johns Hopkins Medicine Institutional Review Board, and all participants signed informed consent forms.
A contract research organization, Parexel, Inc., accrued and medically managed the research subjects. A total of 14 (11M/3F) nonsmoking healthy volunteers (HVs) participated after demonstrating good physical and mental health, as determined by medical history, physical examination, vital signs, clinical laboratory tests, and a 12 lead ECG. Of these subjects, 6 (3M/3F; 35 ± 7 years, mean ± SD) participated in the radiation dosimetry study, and the remaining 8 males (44 ± 3 years) participated in the brain imaging study.
Inclusion criteria
Subjectively healthy, Body Mass Index of 19 ≥ 29 kg/m2, be <195 cm (6′5″) tall, and negative pregnancy tests for females.
Exclusion criteria
physical or mental disease or condition, or taking a medication that could interfere with safety, tolerability, or biokinetics of the tracer, or, in Part 2, failure to complete the MRI head scan.
Participants in Part 1, the whole body (WB) radiation dosimetry study, received a single dose of [18F]FPEB. They were inpatients at the Parexel clinical research center, and then underwent a single PET/CT scan consisting of 8–9 bed positions at the Johns Hopkins University (JHU) PET Center.
Participants in Part 2 were also inpatients. They received two doses of [18F]FPEB. After each administration, dynamic brain scans were acquired for 90 minutes, with arterial and venous blood sampling for metabolite and input functions.
Chemical Structure and Radiosynthesis of [18F]FPEB
The [18F]FPEB structure is shown in Figure 2.
Figure 2.

Radiosynthesis and Chemical Structure of [18F]FPEB. The position of insertion of the 18 F isotope is noted.
[18F]FPEB was synthesized at high specific activity at JHU per a slightly modified method (12). Following production of 18F-fluoride, target water was passed through the Chromafix 30-PS-HCO3 QMA Cartridge to trap the 18F-fluoride. The cartridge was eluted with aqueous cesium carbonate, then acetonitrile into a glass reaction vessel. The [18F]-fluoride and cesium carbonate solution was azeotropically dried with multiple additions of acetonitrile at 120°C under a nitrogen flow. A DMSO solution of FPEB precursor was added to the reaction vessel and microwaved for 4 minutes at 50 W.
The mixture was diluted with water and applied to a semipreparative high-pressure liquid chromatography (HPLC) column (Waters XBridge Prep C18 5μ 19 × 50 mm ODB) eluted with 30% acetonitrile: 70% H2O triethylamine buffer at pH 7.2 at an initial flow rate of 5 mL/minute for the first 2 minutes, then 15 mL/minute until product was observed and collected.
The [18F]FPEB fraction was collected in water and loaded onto a C18 Sep-Pak and washed with 10 mL 0.9% NaCl. The [18F]FPEB was eluted with 1 mL of ethanol followed by 10 mL of 0.9% NaCl, via a sterilizing 0.22μ filter into a sterile vial containing 4 mL 0.9% NaCl.
Clinical Safety Assessments
The safety and tolerability of [18F]FPEB were assessed through clinical and laboratory safety evaluations, including physical examinations, frequent vital sign measurements, 12-lead ECGs, relevant laboratory tests (hematology, chemistry and urinalysis), urine pregnancy test for women, and monitoring. A follow-up phone contact was conducted at about 72 hours and 14 days following administration of [18F]FPEB. In the dosimetry study, WB PET scans were used to estimate radiopharmaceutical biokinetics and regional radiation exposure. The outcome measures included the Effective Dose Equivalent (EDE); Effective Dose (ED); and radiation absorbed doses to individual organs.
WB Imaging, Dosimetry, and Subject Exposure Estimates for [18F]FPEB
Prior to the radiation dosimetry studies of [18F]FPEB, tracer biodistribution data from PET in 3 male and 2 female rhesus monkeys were used to forecast the initial human radioactivity dose administered for the WB human biokinetic studies (15). The single study dosage limit for men and women was based on the calculated dose to the upper large intestine (ULI), which received the highest dose per administration in non-human primates. The maximum single study dose of 185 MBq (5 mCi) was estimated to provide an exposure of 33 mGy and 37 mGy to the ULI (per injection, men and women, respectively), and 2.5 mGy per WB. The maximum amount of [18F]FPEB administered was set at 2 scans with ~185 MBq (5 mCi) (~66 mGy (men) and ~74 mGy (women)) to the ULI.
The subjects were positioned supine in a Discovery VCT PET/CT scanner (Lutetium yttrium orthosilicate (LYSO) PET with 15.7 cm axial FOV, GE Healthcare, Milwaukee). To correct for photon absorption and scatter, as well as to provide anatomical information for reference, a low dose CT scan (64 slice; pitch, 0.984; tube voltage, 120 kVp; tube current, 20–200 mA; rotation time, 0.5 s) was performed before tracer administration. After intravenous injection of 188 (178–197) MBq of [18F]-FPEB through an indwelling catheter, a series of 4 sequential WB PET scans (bed position overlap, 11 slices (36 mm); coincidence window, 6.5 ns; random correction, singles; energy window, 425–650 KeV) were performed at 4 time points (0, 10, 30, and 60 min) up to 90 mins.
Each scan covered the body from the head to the mid-thigh, and consisted of 8–9 bed positions, acquired for 1 min (× 8 = 8 min), 2 min (× 8 = 16 min), 3 min (× 8 = 24 min) and 5 min (× 8 =40 min) in 3D mode, respectively. The data were then reconstructed in a 128 × 128 matrix (slice thickness, 3.75 mm) and corrected for photon attenuation and scatter using information from the corresponding CT scan.
Curve fits extrapolated to time-equals-infinity were used to calculate the residence times. The OLINDA Formalism was used to estimate the radiation absorbed doses. The ED served as the primary surrogate of radiation safety.
Brain Imaging Study and Reconstruction
MRI imaging
Participants of dynamic brain PET had structural MRI images of the brain. All imaging was done on a GE 3T Signa scanner equipped with ASSET and 8-Channel Receive RF coil for the head. T1 and T2 weighted images were acquired, with all T2 brain images read by an attending neuroradiologist to rule out clinical pathology.
PET procedures
All brain-only scans were carried out on the second-generation High-Resolution Research Tomograph (CPS Innovations, Inc.), an LSO-based, 2.5 mm-resolution, dedicated brain PET scanner. Subjects had one venous for the radioligand, and one arterial catheter for input functions. Then, subjects were positioned in the scanner with their heads restrained by a custom-made thermoplastic mask. A 6-min transmission scan was acquired using a rotating Cs-137 source for attenuation correction. Dynamic PET acquisition was performed in a 3-D list mode for 90 min following an intravenous bolus injection of [18F]FPEB. Arterial blood samples were collected and selected samples were analyzed by the HPLC for radioactive metabolites.
Reconstruction
HRRT dynamic PET images were reconstructed using an iterative ordered subset expectation maximization algorithm with 6 iterations, 16 subsets, data-mashing (span) of 3, a maximum ring difference of 67, and corrections for attenuation, scatter, and dead-time. This is the standard reconstruction algorithm for HRRT. The reconstructions were carried out on a specialized 32-node (64-processors) IBM cluster. The following 30 frame schedule was used from the list mode collection: four 15-sec, four 30-sec, three 1-min, two 2-min, five 4-min, and twelve 5-min frames, for the 90 min scan.
Blood Sampling and Plasma Metabolite Collection
Total radioactivity plasma curve
Arterial plasma samples were withdrawn manually at approximately: 10, 20, 30, 40, 50, 60, 70, 80, 90, 100, 120,140, 160 sec and, 3, 4, 5, 8, 10, 15, 20, 30, 40, 60, 80 and 90 min, counted in a gamma counter, and cross-calibrated with the PET.
[18F]FPEB metabolites
Additional 5-mL radial arterial samples, taken at 0 (1.5mL), 5, 10, 20, 40, 60 and 90 min for assessing the fraction of unchanged [18F]FPEB in plasma, were analyzed by HPLC using a general method developed for PET radioligands (16).
PET Data Analysis
WB Dosimetry Study
Segmentations of each organ for volumes of interests (VOIs) were performed by a threshold method implemented with a JHU tool based on Matlab (MA, USA) that allowed voxels with radioactivity above the current threshold to be displayed in a color map and then segmented into a VOI after eliminating unwanted connections to the other organs in all orthogonal slices (transverse, sagittal, and coronal). The optimum threshold was selected for each organ, and applied on one time frame that showed the organ the most clearly for the liver, cerebral cortex, bone marrow, spleen, thyroid, lung, heart, and kidneys. The resulting VOIs were transferred to the remaining frames. VOIs were determined on >1 frame for the urinary bladder, gallbladder, stomach, and small intestine. The VOIs were applied to generate time-activity curves (TACs) for a total of 12 organs. The standardized uptake values (SUV) of each organ were calculated by dividing measured activity concentration (Bq/mL) by the injected activity (Bq) per gram of body weight.
The values of percent of injected activity per organ (% IA/organ) were multiplied by reference standard organ masses (17) and divided by the amount of activity administered, and then fit using SAAM II software (18). Source organ residence times refer to the area under the curve of each organ, calculated with a trapezoidal method. Time integrals of activity were entered into OLINDA/EXM software (version 1.1) (19) using the adult male model.
Accumulation of activity was observed in the bladder and integrated until 100 minutes, when accumulation was assumed to be negligible. The number of disintegrations in the “remainder of body” was assumed to be equal to 100% of the activity administered, integrated to total decay of 18F minus the disintegrations in other body organs.
Brain Imaging Study
Cortical VOIs were automatically defined using Freesurfer software and combined into standard regions, including frontal, temporal, parietal, and occipital cortices, fusiform gyrus, cingulate, and insula. Subcortical regions were defined with FIRST software and manually adjusted on individual MRIs. Subcortical regions included putamen, caudate nucleus, globus pallidus, thalamus, hippocampus, and amygdala. VOIs were transferred from MRI to PET spaces following MRI-to-PET coregistration parameters given by SPM5 (20–21) to obtain TACs.
Mathematical Kinetic Modeling
We pre-specified that the study would identify the compartmental model that most precisely described the kinetics of [18F]FPEB in the brain using metabolite corrected plasma TACs. We expected that the distribution volume of non-displaceable compartment (VND) (22) could be estimated accurately in cerebellum (8, 23–24) or in white matter (12) for radioligands of mGluR5.
A set of standard plasma input methods were employed to identify the optimal method for derivation of VT for [18F]FPEB. The following 4 methods were tested: a one tissue compartmental model (OTCM) with three parameters (K1, and k2′; see 25 for the definitions, and v0, the tissue vascular volume); two tissue compartmental models with five parameters (K1, k2, k3, k4, and v0; see 22 for the definitions), with and without constraining the K1-k2 ratio (non-displaceable distribution volume, VN (26) to the cerebellum estimate (TTCM and TTCM-C, respectively); and the plasma reference graphical analysis (PRGA) (27). In TTCM and TTCM-C, BPND was given as the k3/k4 ratio. In the data analyses, metabolite-corrected plasma TACs were obtained by applying percent parent ligand time profiles, given by HPLC analysis to total plasma TACs, after interpolating at plasma sample times using the piecewise cubic Hermite interpolation implemented in Matlab (Cambridge, MA, USA).
BPND maps were generated using PRGA, spatially normalized to a SPM5 standard brain using SPM5 (20), and averaged across subjects to generate averaged BPND maps of [18F]FPEB.
Test-Retest Repeatability of Dynamic Brain Scans
Regional test-retest variability (TRV) was calculated as follows and expressed as a percentage:
where test and retest stands for VT or BPND of test and retest scans, respectively, and n is the number of participants. We pre-specified that [18F]FPEB would be adequately qualified as a ligand for mGluR5 if TRV were ≤ 10%, commonly accepted for validity of PET radiotracers (28–33). We also tested agreement of BPND or VT maps with regional distributions of mGluR5 (8, 12, 34).
RESULTS
Subjects
WB Radiation Dosimetry Study
Three males and 3 females (35 +/− 7 (SD) years; range of 24–45 years) were scanned on the GE Discovery VCT. Mean [18F]FPEB dose was 188 +/− 7 (SD) MBq (5.08 mCi +/− 0.18), with a mass of 0.10 μg +/− 0.06, and specific activity of 536062 MBq/μmol +/− 289662, and mass dose per kg of 1.57 picograms/kg +/− 0.96.
Brain [18F]FPEB PET Study
For the first scan, the 8 subjects were given an average dose of 178 +/− 16 (SD) MBq (4.82 mCi +/− 0.42), with a mass of 0.18 μg +/− 0.10, and specific activity of 284498 MBq/μmol +/− 155670, and mass dose per kg of 2.17 picograms/kg +/− 1.22. For the second scan, the average dose was 179 +/− 4 MBq (SD) (4.84 mCi +/− 0.12), with a mass of 0.26 μg +/− 0.19, and specific activity of 225612 MBq/μmol +/− 139530, and mass dose per kg of 3.16 picograms/kg +/− 2.27.
The dose, mass, and specific activity of test and retest scans were not different (p>0.1, paired t-test). Means +/− SD for both test and retest scans were the following: dose of 179 +/− 10 MBq (4.83 mCi +/− 0.29), mass of 0.23 μg +/− 0.16, and specific activity of 255055 MBq/μmol +/− 146010 (6893 mCi/μmol +/− 3946), and mass dose per kg of 2.6 picograms/kg +/− 1.83.
Due to technical problems in the test-retest study, data from one subject was excluded.
Safety
There were no significant changes in vital signs, laboratory values, or ECGs. Mean systolic BP was 120 mmHg (maximum 147 mmHg), mean diastolic BP was 68 mmHg (maximum 93 mmHg), and mean HR was 65 BPM (maximum 92 BPM). Mean QTcF was 396 msec. No subjects experienced > 28 msec change from baseline in QTc, and no QTc values > 441 msec.
Absorbed Doses for WB Radiation Dosimetry
Coronal WB PET images are shown in Figure 3A. VOI analyses of an average TAC of non-decay corrected [18F]FPEB (n=6) revealed that radioactivity accumulated in the gallbladder, was excreted into the small intestine, and gradually accumulated in the bladder (Figure 3B). The mean residence times (hours) of [18F]FPEB (n=6) calculated from WB PET images are summarized in Table 1. The [18F]FPEB data were all well fit with 1 or 2 exponential functions. The mean radiation dose estimates (n=6) in the various organs is reported in Table 2. Most organs received exposures of ~7.7 – 44.4 μSv/MBq (28.5 – 164.3 mrem/mCi). The gallbladder received the highest radiation dose, ~ 191.4 μSv/MBq (708 mrem/mCi). The urinary bladder received ~52.3 μSv/MBq (175 mrem/mCi). The effective dose was ~ 16.9 μSv/MBq (62.4 mrem/mCi), and effective dose equivalent was ~ 31 μSv/MBq (114 mrem/mCi). As shown in Figure 3C, comparisons of radiation doses showed that the human dosimetry estimates of [18F]FPEB were lower than those previously forecasted, based on non-human primates, but were similar to those of humans for [18F]SP203.
Figure 3.
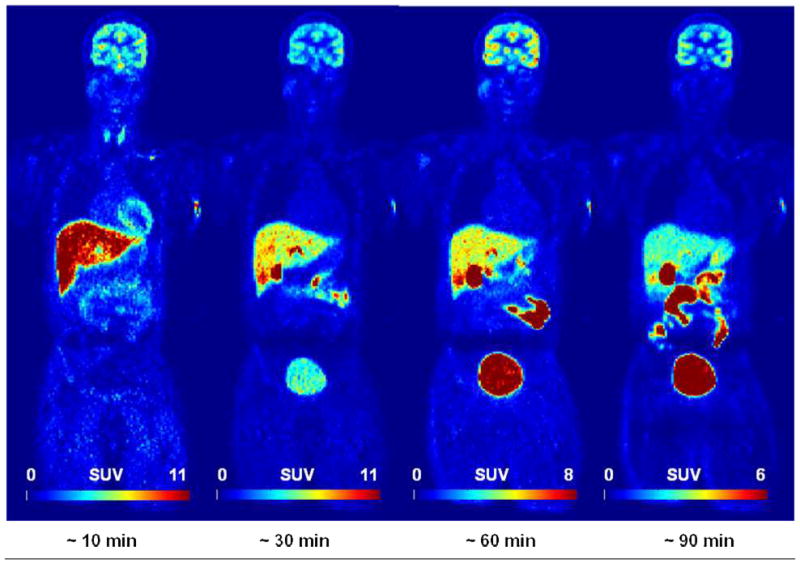


Figure 3A. [18F]FPEB whole-body PET images 0–10, 10–30, 30–60, and 60–90 min after injection of 177.6 MBq (4.8 mCi) in 33 year-old male (73 kg) with specific activity of 15.0 Ci/μmol and FPEB mass of 0.07 μg. GB was the critical organ for SUV ranges. (Decay non-corrected at four time points and decay-corrected within each time point).
Figure 3B. Tissue time-activity curves of non-decay corrected 18F activity using standardized uptake values for various organs (GB, Gallbladder; UB, Urinary Bladder; SI, Small Intestine; LV, Liver; BR, Brain; KD, Kidney; BM, Bone Marrow; HT, Heart; SP, Spleen; TH, Thyroid). Values are mean (± standard error of the mean (SEM)) standardized uptake values (in grams per milliliter)
Figure 3C. Comparison of radiation dose estimates of [18F]FPEB in human, based on PET images (this work) with the dose estimated from non-human primate (rhesus monkey) (12) and [18F]SP203 in humans (14). Absorbed radiation doses (μGy/MBq) were changed to equivalent doses (μSv/MBq). Values are expressed as mean ± SEM.
TABLE 1.
Output from OLINDA for Mean (± SD) Residence Times (hours) of [18F]FPEB (n=6) from WB PET Images.
| Source organ | [18F]FPEB |
|---|---|
| Brain | 0.1092 ± 0.0430 |
| Gallbladder Contents | 0.1147 ± 0.1307 |
| LLI | 0.0117 ± 0.0031 |
| Small Intestine | 0.1164 ± 0.0312 |
| ULI | 0.0638 ± 0.0171 |
| Heart Wall | 0.0039 ± 0.0022 |
| Kidneys | 0.0137 ± 0.0067 |
| Liver | 0.2820 ± 0.2269 |
| Bone Marrow | 0.0197 ± 0.0186 |
| Spleen | 0.0014 ± 0.0006 |
| Thyroid | 0.0003 ± 0.0001 |
| Urinary Bladder | 0.1080 ± 0.0687 |
| Remainder | 1.8333 ± 0.3920 |
TABLE 2.
Output from OLINDA for Mean (± SD) Radiation Doses (μSv/MBq) of [18F]FPEB from PET images and OLINDA/EXM.
| Target organ | [18F]FPEB | |
|---|---|---|
| μSv/MBq | mrem/mCi | |
| Adrenals | 13.9 ± 1.5 | 51.6 ± 5.5 |
| Brain | 20.2 ± 6.8 | 74.6 ± 25.1 |
| Breasts | 8.1 ± 0.9 | 29.9 ± 3.4 |
| Gallbladder Wall | 191.4 ± 210.4 | 708.1 ± 708.1 |
| LLI Wall | 21.1 ± 4.6 | 78.1 ± 17.2 |
| Small Intestine | 40.0 ± 11.7 | 147.8 ± 43.3 |
| Stomach Wall | 12.9 ± 0.5 | 47.7 ± 1.9 |
| ULI Wall | 44.4 ± 13.1 | 164.3 ± 48.5 |
| Heart Wall | 9.9 ± 1.5 | 36.7 ± 5.5 |
| Kidneys | 17.3 ± 5.6 | 64.0 ± 20.9 |
| Liver | 41.1 ± 28.2 | 152.1 ± 104.4 |
| Lungs | 10.3 ± 0.7 | 38.0 ± 2.8 |
| Muscle | 10.4 ± 0.9 | 38.6 ± 3.3 |
| Ovaries | 16.5 ± 2.3 | 61.0 ± 8.6 |
| Pancreas | 15.4 ± 1.9 | 56.9 ± 6.9 |
| Red Marrow | 11.6 ± 1.0 | 43.0 ± 3.7 |
| Osteogenic Cells | 15.7 ± 1.4 | 58.1 ± 5.1 |
| Skin | 7.7 ± 0.9 | 28.5 ± 3.5 |
| Spleen | 8.3 ± 0.8 | 30.8 ± 3.0 |
| Testes | 9.8 ± 1.5 | 36.2 ± 5.4 |
| Thymus | 9.6 ± 1.3 | 35.7 ± 4.9 |
| Thyroid | 8.0 ± 0.7 | 29.6 ± 2.8 |
| Urinary Bladder | 52.3 ± 12.2 | 175.2 ± 77.0 |
| Uterus | 16.9 ± 1.9 | 62.5 ± 6.9 |
| Total Body | 12.0 ± 0.2 | 44.4 ± 0.6 |
| Equivalent Dose | 30.9 ± 13.1 | 114.4 ± 48.6 |
| Effective Dose | 16.9 ± 1.8 | 62.4 ± 6.8 |
Dynamic Brain Imaging and mGluR5 Quantification
Radioactive metabolites and plasma TACs
Total radioactive metabolites were ~ 60% at 15 min after injection, ~ 75% at 30 min, and ~ 80% at the end of the scan (90 min) (Figure 4, Panel A). Plasma TACs peaked within 1 min of injection and decreased monotonically (Figure 4, Panel B).
Figure 4.

Metabolism of [18F]FPEB. Plot of the percent of radioactive metabolites present during the scan is shown in Panel A. Total radioactivity in the plasma, and plasma corrected for metabolism, is shown in Panel B, over the 90 minute acquisition during the dynamic PET scan phase.
Tissue TACs
Figure 5 shows decay corrected tissue TACs in % SUV for selected brain regions. TACs of good retention regions (e.g., insula cortex and caudate nucleus) peaked around 20 min then gradually declined. TACs of medium retention regions (e.g., thalamus) peaked within 10 min of the injection and declined monotonically. TACs of low retention regions (e.g., cerebellum and pons) peaked within 10 min of injection, and decreased mono-exponentially.
Figure 5.

Average SUV (%) TACs for [18F]FPEB (from test-retest study, n=7). Average SUVs in representative regions are shown. The data for thalamus includes SEM bars (the SEM in the thalamus is representative of the magnitude of error for all regions).
Selection of Methods for PET Outcome Variables
Akaike information criteria (AIC) (35) supported TTCM-C over OTCM in all brain regions, including pons, which showed the lowest accumulation of radioactivity. TTCM yielded relatively unstable estimates of VT at 60 min in time-consistency tests (y = 1.1·× − 1.1; R2=0.964, where x and y stand for VT values given by PET frames 0 to 90 and 60 min, respectively), compared to TTCM-C and PRGA. Therefore, TTCM might not be appropriate for 90 min scans. TTCM-C and PRGA showed comparable results on time consistency tests for VT (TTCM-C: y = 1.0·× − 0.51, R2=0.987; PRGA: y = 1.0·× −0.86, R2=0.988) as well as for BPND (TTCM-C: y = 1.0·× − 0.08, R2=0.964; PRGA: y = 1.0·× −0.01, R2=0.986). The cerebellum was used for VND for TTCM-C, while pons was used to calculate BPND with PRGA because it showed the lowest VT among tested regions.
Test-retest variability (TRV)
TTCM-C and PRGA showed similar TRV estimates across regions (Figure 6, Panel A). TRV estimates were < 10% criteria in most regions except for frontal and occipital cortices, and caudate nucleus. PRGA showed lower TRV estimates in temporal, parietal, cingulate, and insula cortices and putamen (Figure 6, Panel B). PRGA showed TRV estimates that were < 10% criteria in most regions except for regions with low BPND (occipital cortex, and globus pallidus) or small regions (amygdala). Therefore, PRGA was chosen as the optimal method for obtaining regional BPND values.
Figure 6.

Histograms (means with SEM bars) of regional estimates of test-retest variability (equation provided in Methods section) and Test-/Retest Variability for VT (Panel A) and BPND (Panel B) given by TTCM-C and PRGA. A 10% level, generally accepted criteria for reproducibility, is shown by horizontal dotted lines.
Regional VT and BPND values
Regional VT and BPND are shown in Figure 7A. VT, which includes not only binding but also blood-brain transport properties, was a secondary variable for [18F]FPEB because PRGA yielded robust estimates of BPND. Insula, temporal, and cingulate cortices showed high BPND values that can be visually identified on averaged BPND maps (Figure 7B).
Figure 7.

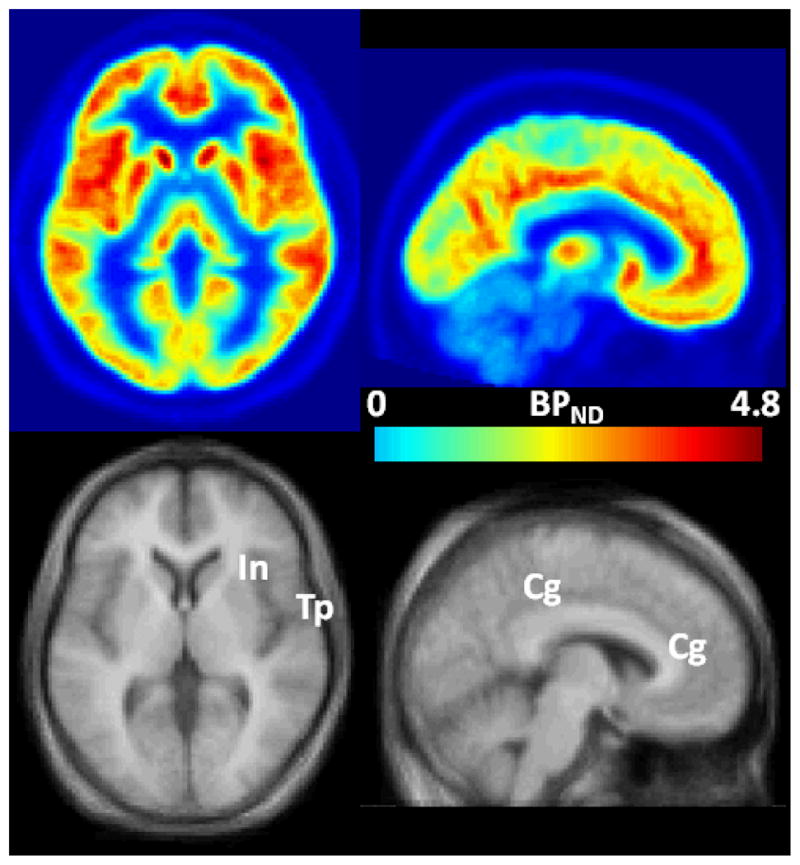
Figure 7A. Histograms of regional value of VT (Panel A) and BPND (Panel B) given by TTCM-C (VT alone) and PRGA.
Figure 7B. Trans-axial (left column) and sagittal BPND images of [18F]FPEB (upper rows), and matching MRIs in the SPM standard space. Regions with high BPN values, namely insula (In), temporal (Tp), and cingulate (Cg) cortices are indicated on the coregistered MRI.
DISCUSSION
The present study confirmed that PET imaging with [18F]FPEB, prepared in high radiochemical yield and purity (12), seems safe and feasible. The organ and WB radiation dose was lower than that of our preclinical study (15). Non-human primates had higher doses to the intestinal walls and testes, and a lower dose in the gallbladder wall than in this human study. We found that 185 MBq (5 mCi) of [18F]FPEB at 8 administrations is < the annual 50 mSv (5 rem) allowable WB EDE by U.S. FDA guidelines. We also confirmed that it is possible to routinely obtain specific activities of 222000–296000 MBq/μmol (6000–8000 mCi/μmol) and an average injected dose of ~185 MBq.
The metabolism of [18F]FPEB was not atypical, with metabolism % in plasma of 75% and 80% at 30 and 90 minutes, respectively, and no lipophilic metabolites, allowing a concrete characterization of the radioactivity plasma input function.
The evaluation of kinetic models indicated that PRGA might be the optimal method for quantifying VT. Pons showed the lowest VT, which may make it an appropriate reference region for obtaining BPND with PRGA, whereas cerebellum is widely used for [11C]ABP 688 (e.g., 8). Volumes of distribution kinetic modeling using PRGA demonstrated VND and BPNP consistent with that for human mGluR5. Most importantly, our test-retest variability in 7 human subjects was quite favorable and <10%, in contrast to another mGluR5 PET radiotracer (36).
Although mGluR5 occupancy was not evaluated in this pilot study, studies in non-human primates demonstrated that mGluR5 antagonists can block the regional brain uptake of this radiotracer (12). Measurement of mGluR5 occupancy with therapeutic candidates is also important and should be feasible with [18F]FPEB. Novartis’ AFQ056 (mGluR5 antagonist) has shown improvements in several Fragile X syndrome behavioral symptoms; STX 107, an mGluR5 blocker, for early testing of Fragile X, is being developed by Seaside Therapeutics; and RO4917523, another mGluR5 antagonist, is being developed by Roche.
CONCLUSION
PET scanning with [18F]FPEB was shown in this first-in-human study to be safe and well tolerated as all post-scan clinical safety tests remained unremarkable. Regional brain uptake was consistent with known mGluR5 sites, and within-subject test-retest variability for most regions was very favorable (<10%). The initial quantification of BPND values and excellent test-retest estimates strongly support its use in clinical imaging studies of mGluR5.
Acknowledgments
We thank Maria Guevara, Anil Kumar, William Willis, Stephen Condouris, Maria Thomas, and Emily Gean for technical support and recruitment. We also thank Dr. Igor Grachev and Dr. Richard Hargreaves from Merck for their collaboration and scientific advice. Michael Stabin, of Vanderbilt University, Changlae Lee and Hee-Joung Kim of Yonsei University, Wonju, Korea contributed to the radiation dosimetry calculations. Parexel, Inc., accrued and cared for the subjects. They performed most of the pharmacological safety studies. This study was supported in part by NIH Grant R33 MH66623P (RW); NIH grant K24DA000412 (DFW); and NIBIB, NIDA, NIAAA Training grant for Clinician Scientists in Imaging Research (5T32EB006351-05) (JK). Data was presented (H. Kuwabara) in part at the Society of Nuclear Medicine Annual Meeting, San Antonio, TX, June 4–8, 2011.
References
- 1.Anwyl R. Metabotropic glutamate receptors: Electrophysiological properties and role in plasticity. Brain Res Rev. 1999;29(1):83–120. doi: 10.1016/s0165-0173(98)00050-2. [DOI] [PubMed] [Google Scholar]
- 2.Bordi F, Ugolini A. Group I metabotropic glutamate receptors: Implications for brain diseases. Prog Neurobiol. 1999;59(1):55–79. doi: 10.1016/s0301-0082(98)00095-1. [DOI] [PubMed] [Google Scholar]
- 3.Cleva RM, Olive MF. Positive allosteric modulators of type 5 metabotropic glutamate Receptors (mGluR5) and their therapeutic potential for the treatment of CNS disorders. Molecules. 2011;16(3):2097–106. doi: 10.3390/molecules16032097. [DOI] [PMC free article] [PubMed] [Google Scholar]
- 4.Simonyi A, Schachtman TR, Christoffersen GR. The role of metabotropic glutamate receptor 5 in learning and memory processes. Drug News Perspect. 2005;18(6):353–361. doi: 10.1358/dnp.2005.18.6.927927. [DOI] [PubMed] [Google Scholar]
- 5.Manahan-Vaughan D, Braunewell KH. The metabotropic glutamate receptor, mGluR5, is a key determinant of good and bad spatial learning performance and hippocampal synaptic plasticity. Cereb Cortex. 2005;15(11):1703–1713. doi: 10.1093/cercor/bhi047. [DOI] [PubMed] [Google Scholar]
- 6.Palucha A, Pilc A. Metabotropic glutamate receptor ligands as possible anxiolytic and antidepressant drugs. Pharmacol Ther. 2007;115(1):116–147. doi: 10.1016/j.pharmthera.2007.04.007. [DOI] [PubMed] [Google Scholar]
- 7.Christoffersen GR, Simonyi A, Schachtman TR, et al. mGlu5 antagonism impairs exploration and memory of spatial and non-spatial stimuli in rats. Behav Brain Res. 2008;191(2):235–245. doi: 10.1016/j.bbr.2008.03.032. [DOI] [PubMed] [Google Scholar]
- 8.Ametamey SM, Treyer V, Streffer J, et al. Human PET studies of metabotropic glutamate receptor subtype 5 with 11C-ABP688. J Nucl Med. 2007;48:247–252. [PubMed] [Google Scholar]
- 9.Simeon FG. Synthesis and simple 18F-labeling of 3-fluoro-5-(2-(2-(fluoromethyl)thiazol-4-yl)ethynyl)benzonitrile as a high affinity radioligand for imaging monkey brain metabotropic glutamate subtype-5 receptors with positron emission tomography. J Med Chem. 2007;50(14):3256–3266. doi: 10.1021/jm0701268. [DOI] [PubMed] [Google Scholar]
- 10.Shetty HU, Zoghbi SS, Siméon FG, et al. Radiodefluorination of 3-fluoro-5-(2-(2-[18F](fluoromethyl)-thiazol-4-yl)ethynyl)benzonitrile ([18F]SP203), a radioligand for imaging brain metabotropic glutamate subtype-5 receptors with positron emission tomography, occurs by glutathionylation in rat brain. J Pharmacol Exp Ther. 2008;327(3):727–735. doi: 10.1124/jpet.108.143347. [DOI] [PMC free article] [PubMed] [Google Scholar]
- 11.Lucatelli C, Honer M, Salazar JF, Ross TL, Schubiger PA, Ametamey SM. Synthesis, radiolabeling, in vitro and in vivo evaluation of [18F]-FPECMO as a positron emission tomography radioligand for imaging the metabotropic glutamate receptor subtype 5. Nucl Med Biol. 2009;36(6):613–622. doi: 10.1016/j.nucmedbio.2009.03.005. [DOI] [PubMed] [Google Scholar]
- 12.Hamill TG, Krause S, Ryan C, et al. Synthesis, characterization, and first successful monkey imaging studies of metabotropic glutamate receptor subtype 5 (mGluR5) PET radiotracers. Synapse. 2005;56:205–216. doi: 10.1002/syn.20147. [DOI] [PubMed] [Google Scholar]
- 13.Treyer V, Streffer J, Ametamey SM, et al. Radiation dosimetry and biodistribution of 11C-ABP688 measured in healthy volunteers. Eur J Nucl Med Mol Imaging. 2008;35(4):766–770. doi: 10.1007/s00259-007-0638-4. [DOI] [PubMed] [Google Scholar]
- 14.Kimura Y, Simeon FG, Hatazawa J, et al. Biodistribution and radiation dosimetry of a positron emission tomographic ligand, 18F-SP203, to image metabotropic glutamate subtype 5 receptors in humans. Eur J of Nucl Med Mol Imaging. 2010;37:1943–1949. doi: 10.1007/s00259-010-1447-8. [DOI] [PMC free article] [PubMed] [Google Scholar]
- 15.Belanger MJ, Krause SM, Ryan C, et al. Biodistribution and radiation dosimetry of [18F]F-PEB in nonhuman primates. Nucl Med Commun. 2008;29:915–919. doi: 10.1097/MNM.0b013e3283060c72. [DOI] [PubMed] [Google Scholar]
- 16.Hilton J, Yokoi F, Dannals RF, Ravert HT, Szabo Z, Wong DF. Column-switching HPLC for the analysis of plasma in PET imaging studies. Nucl Med Biol. 2000;27:627–630. doi: 10.1016/s0969-8051(00)00125-6. [DOI] [PubMed] [Google Scholar]
- 17.Cristy M, Eckerman KF. Rep No ORNL/TM-8381/V1. Oak Ridge National Laboratory; 1987. Specific absorbed fractions of energy at various ages from internal photon sources. [Google Scholar]
- 18.Foster DM. Developing and testing integrated multicompartment models to describe a single-input multiple-output study using the SAAM II software system. Adv Exp Med Biol. 1998;445:59–78. doi: 10.1007/978-1-4899-1959-5_4. [DOI] [PubMed] [Google Scholar]
- 19.Stabin MG, Sparks RB, Crowe E. OLINDA/EXM: the second-generation personal computer software for internal dose assessment in nuclear medicine. J Nucl Med. 2005;46:1023–1027. [PubMed] [Google Scholar]
- 20.Ashburner J, Friston KJ. High-dimensional image warping. In: Frackowiak RSJ, Friston KJ, Frith K, et al., editors. Human Brain Function. Academic Press; 2003. pp. 673–694. [Google Scholar]
- 21.Maes F, Collignon A, Vandermeulen D, Marchal G, Suetens P. Multimodality image registration by maximization of mutual information. IEEE Trans Med Imaging. 1997;16:187–198. doi: 10.1109/42.563664. [DOI] [PubMed] [Google Scholar]
- 22.Innis RB, Cunningham VJ, Delforge J, et al. Consensus nomenclature for in vivo imaging of reversibly binding radioligands. J Cereb Blood Flow Metab. 2007;27:1533–1539. doi: 10.1038/sj.jcbfm.9600493. [DOI] [PubMed] [Google Scholar]
- 23.Berthele A, Platzer S, Laurie DJ, et al. Expression of metabotropic glutamate receptor subtype mRNA (mGluR1-8) in human cerebellum. Neuroreport. 1999;10:3861–3867. doi: 10.1097/00001756-199912160-00026. [DOI] [PubMed] [Google Scholar]
- 24.Shigemoto R, Mizuno N. Metabotropic glutamate receptorsimmunocytochemical and in situ hybridization analyses. In: Ottersen OP, Storm-Mathisen J, editors. Handbook of chemical neuroanatomy, vol 18. Glutamate. Elsevier; New York: 2000. pp. 63–98. [Google Scholar]
- 25.Koeppe RA, Holthoff VA, Frey KA, Kilbourn MR, Kuhl DE. Compartmental analysis of [11C]flumazenil kinetics for the estimation of ligand transport rate and receptor distribution using positron emission tomography. J Cereb Blood Flow Metab. 1991;11:735–744. doi: 10.1038/jcbfm.1991.130. [DOI] [PubMed] [Google Scholar]
- 26.Abi-Dargham A, Laruelle M, Seibyl J, et al. SPECT measurement of benzodiazepine receptors in human brain with iodine-123-iomazenil: kinetic and equilibrium paradigms. J Nucl Med. 1994;35:228–238. [PubMed] [Google Scholar]
- 27.Logan J, Fowler JS, Volkow ND, et al. Graphical analysis of reversible radioligand binding from time-activity measurements applied to [N-11C-methyl]-(−)-cocaine PET studies in human subjects. J Cereb Blood Flow Metab. 1990;10(5):740–747. doi: 10.1038/jcbfm.1990.127. [DOI] [PubMed] [Google Scholar]
- 28.Wang GJ, Volkow ND, Fowler JS, Logan J, Pappas NR, Wong CT, et al. Reproducibility of repeated measures of endogenous dopamine competition with [11C]raclopride in the human brain in response to methylphenidate. J Nucl Med. 1999;40:1285–1291. [PubMed] [Google Scholar]
- 29.Soares JC, van Dyck CH, Tan P, et al. Reproducibility of in vivo brain measures of 5-HT2A receptors with PET and. Psychiatry Res. 2001;106:81–93. doi: 10.1016/s0925-4927(01)00071-3. [DOI] [PubMed] [Google Scholar]
- 30.Hirvonen J, Nagren K, Kajander J, Hietala J. Measurement of cortical dopamine d1 receptor binding with 11C[SCH23390]: a test-retest analysis. J Cereb Blood Flow Metab. 2001;21:1146–1150. doi: 10.1097/00004647-200110000-00002. [DOI] [PubMed] [Google Scholar]
- 31.Yasuno F, Sanabria SM, Burns D, et al. PET imaging of neurokinin-1 receptors with [(18)F]SPA-RQ in human subjects: assessment of reference tissue models and their test-retest reproducibility. Synapse. 2007;61:242–251. doi: 10.1002/syn.20361. [DOI] [PMC free article] [PubMed] [Google Scholar]
- 32.Lundberg J, Halldin C, Farde L. Measurement of serotonin transporter binding with PET and [11C]MADAM: a test-retest reproducibility study. Synapse. 2006;60(3):256–263. doi: 10.1002/syn.20297. [DOI] [PubMed] [Google Scholar]
- 33.Burns HD, Van LK, Sanabria-Bohorquez A, et al. [18F]MK-9470, a positron emission tomography (PET) tracer for in vivo human PET brain imaging of the cannabinoid-1 receptor. Proc Natl Acad Sci USA. 2007;104:9800–9805. doi: 10.1073/pnas.0703472104. [DOI] [PMC free article] [PubMed] [Google Scholar]
- 34.Brown AK, Kimura Y, Zoghbbi SS, et al. Metabotropic Glutamate Subtype 5 Receptors Are Quantified in the Human Brain with a Novel Radioligand for PET. J Nucl Med. 2008;49 (12):2042–2048. doi: 10.2967/jnumed.108.056291. [DOI] [PMC free article] [PubMed] [Google Scholar]
- 35.Akaike H. A new look at statistical model identification. IEEE Trans Automat Contr. 1974;19:716–722. [Google Scholar]
- 36.Kuwabara H, Chamroonrat W, Mathews W, et al. Evaluation of 11C-ABP688 and 18F-FPEB for imaging mGluR5 receptors in the human brain. Presented at: Society of Nuclear Medicine Annual Meeting; San Antonio, TX. June 4–8, 2011. [Google Scholar]