Abstract
Continuous manufacturing, an emerging technology in the pharmaceutical industry, has the potential to increase the efficiency, and agility of pharmaceutical manufacturing processes. To realize these potential benefits of continuous operations, effectively managing materials, equipment, analyzers, and data is vital. Developments for continuous pharmaceutical manufacturing have led to novel technologies and methods for processing material, designing and configuring individual equipment and process analyzers, as well as implementing strategies for active process control. However, limited work has been reported on managing abnormal conditions during operations to prevent unplanned deviations and downtime and sustain system capabilities. Moreover, although the sourcing, analysis, and management of real-time data have received growing attention, limited discussion exists on the continued verification of the infrastructure for ensuring reliable operations. Hence, this work introduces condition-based maintenance (CBM) as a general strategy for continually verifying and sustaining advanced pharmaceutical manufacturing systems, with a focus on the continuous manufacture of oral solid drug products (OSD-CM). Frameworks, such as CBM, benefit unified efforts towards continued verification and operational excellence by leveraging process knowledge and the availability of real-time data. A vital implementation consideration for manufacturing operations management applications, such as CBM, is a systems architecture and an enabling infrastructure. This work outlines the systems architecture design for CBM in OSD-CM and highlights sample fault scenarios involving equipment and process analyzers. For illustrative purposes, this work also describes the infrastructure implemented on an OSD-CM testbed, which uses commercially available automation systems and leverages enterprise architecture standards. With the increasing digitalization of manufacturing operations in the pharmaceutical industry, proactively using process data towards modernizing maintenance practices is relevant to a single unit operation as well as to a series of physically integrated unit operations.
Keywords: Continuous manufacturing, Oral solid dose, Manufacturing operations management, Process monitoring, Maintenance, Continued process verification, Systems integration
1. Introduction
Manufacturing innovations in the pharmaceutical industry have proliferated since the mid-2000 s following the initiatives on Quality by Design (QbD) and Process Analytical Technology (PAT) of the United States Food and Drug Administration (FDA) (FDA, 2004; Ierapetritou et al., 2016; Troup and Georgakis, 2013; Yu et al., 2019). One such set of manufacturing innovations that is helping industry progress towards operational excellence is the design and operations of integrated continuous processes (Yu and Kopcha, 2017). The ultimate goal of such integrated systems is to ensure that the individual elements function collectively as a whole and satisfy the design properties or characteristics of the overall system (SEBoK, 2019a). The implementation challenges and fault scenarios of the subsystems do impact the operations of the integrated system; notably, a failure or unplanned downtime in one of the subsystems could result in a downtime of the entire process. Failures in advanced pharmaceutical manufacturing systems could lead to uncertain quality, resulting in the requirement for increased offline quality testing or issuing recalls, which impacts time to market and consumer reach. Hence, the complexities of the individual components and their integration into a larger system warrant comprehensive safety and reliability efforts for ensuring the functioning of every component to prevent systemic failures (Venkatasubramanian, 2011). To address these complexities, this work introduces Condition-Based Maintenance (CBM) as a strategy for continued verification and sustainment of process operations. The continuous manufacture of oral solid doses (OSD-CM) is used as a case study to illustrate CBM. Six drug products produced through OSD-CM have been approved by the FDA in recent years, yet limited work has been reported on the management of abnormal conditions during operations, preventing unplanned deviations and downtime, and system sustainment (Gupta et al., 2013; Hamdan et al., 2012, 2010).
OSD-CM involves a systematized integration of solids processing unit operations, process analyzers, and information technology systems (CDER US FDA, 2019; Giridhar et al., 2014; Singh et al., 2014; Su et al., 2019c). Research efforts since the 2000s have resulted in data-driven and mechanistic models as well as heuristics for the design and operations of the process (Ierapetritou et al., 2016). The real-time process management (RTPM) applications that enable process automation, such as process control, material tracking, fault management, and knowledge management, rely on process data from direct measurements as well as a combination of methods and models for soft-sensing. The sensor network, an integrated system for process monitoring encompassing the data sources built into the unit operations equipment, field devices and process analyzers, and the data architectures and infrastructre, all enable the data flow required for managing the process and facility operations. Risk assessment is vital to ensure reliable operation of the sensor network for effective supervisory control of critical process parameters (CPPs) and critical quality attributes (CQAs) (Su et al., 2017). Although PAT tools and the data management infrastructure and system architectures have been developed for implementing OSD-CM (Brodbeck, 2018; Cao et al., 2018; Laske et al., 2017; Su et al., 2019c); there has been limited literature reporting on continued verification and robustness of the sensing infrastructure (Liu et al., 2018; Moreno et al., 2019, 2018; Su et al., 2019a). Hence, this work builds on the advances in RTPM for OSD-CM and aims to emphasize the system integration and maintenance aspects required to assure sensor network robustness.
Maintenance management is an integration of technical, administrative, and managerial actions during a system’s life cycle to ensure the functional utility of an asset. Maintenance activities can be broadly classified as reactive or proactive. Reactive maintenance involves corrective or emergency maintenance, which is to correct a problem once an imminent risk has manifested as a failure. Proactive strategies aim to manage the failure modes and the ensuing consequences before they occur using measures such as time-based or age-based inspection and replacement of components, or on detection using prognostic information of a condition that may lead to failure or degradation of the functionality of the system (Kothamasu et al., 2006). Maintenance activities for life cycle management of assets are not new to pharmaceutical manufacturing facilities, and both calendar-based and inter-batch preventive maintenance are generally employed (De Felice et al., 2014; Friedli et al., 2010). However, product dependent modular integration of unit operations and applicable monitoring technologies, potential increased run times as a scale-up strategy, and risks associated with material handling require additional considerations for qualification, maintenance, and cleaning of individual physical assets and the overall continuous manufacturing system (ASTM Committee E55, 2014; CDER US FDA, 2019).
The advances towards Smart Manufacturing or Industry 4.0 for the digitalization of process operations management (Davis et al., 2012; Isaksson et al., 2018) are enabling the availability and accessibility of real-time process data for proactive practices in fault monitoring, diagnosis, and maintenance (Anand et al., 2019; Baur and Wee, 2015; Moyne and Iskandar, 2017; Venkatasubramanian, 2019). With increasing digitalization of process operations in the pharmaceutical industry, strategies for system reliability and proactive maintenance, such as CBM, offer numerous benefits for continuous process improvements through systematized management of assets and manufacturing operations (BioPhorum Operations Group, 2019; Herwig et al., 2017; Romero-Torres et al., 2017; Vann et al., 2018).
CBM is a proactive maintenance strategy for critical assets or those assets that have significant repair and replacement costs or cause significant impact on the process when they fail as identified through reliability centered maintenance analysis (Márquez, 2007). While maintenance tasks can be performed following organizational philosophies such as total productive maintenance, CBM involves the methods for continuous or periodic assessment of system conditions to trigger a fault condition based on a measured parameter limit and further respond to the fault with a subsequent maintenance activity (Ahmad and Kamaruddin, 2012; Bengtsson and Lundström, 2018; Moubray, 1999; Shin and Jun 2015). The awareness of system conditions in order to trigger appropriate maintenance action enables reducing the failure risks in the initial stages of operation introduced from frequent preventive maintenance. Furthermore, the real-time assessment of process and maintenance data leads to lean operations of the manufacturing process by reducing the time required to perform a root cause analysis and the ensuing restoration activity. CBM has evolved since the mid-1900s with the growth in sensing and communication technologies as a key asset optimization and reliability improvement tool and is an enabler for predictive maintenance (Center for Chemical Process Safety, 2007; Márquez, 2007; Moubray, 1999; Moyne et al., 2012; OSIsoft LLC, 2018). It is worth highlighting that CBM, under the name of CBM Plus, is the maintenance policy of the United States Department of Defense for the assessment, sustainment, and operations of defense systems (Office of the Assistant Secretary of Defense for Sustainment, 2008) and is recognized as an efficient and effective method of maintenance by the International Society of Automation (ISA) Technical Report 108 for Intelligent Device Management (ISA, 2015a).
The remainder of this article is organized as follows. First, Section 2 defines the CBM framework and provides an overview of the associated data flow. This is followed by a proposed systems architecture for implementing CBM to support OSD-CM. Section 3 discusses the sensor network risks for OSD-CM and the necessary developments to implement the systems architecture for CBM. This discussion uses a pilot-scale advanced manufacturing testbed for tablet processing for illustration purposes. This section also emphasizes the enterprise-control system integration, while briefly discussing sample faults that may require continued verification during process operations. Section 4 provides concluding remarks. CBM is a mature maintenance management strategy, which could use a wide variety of analysis techniques, methods, and tools within the diagnosis, prognosis, and decision support systems. However, a detailed review and investigation of all of this methodology is beyond the scope of this work, which restricts focus to those methods and tools most relevant to OSD-CM.
2. Design of a CBM framework for OSD-CM
2.1. Data flow
The data flow for CBM, illustrated in Fig. 1, is comprised of three main steps. This data flow adopts the general workflows for fault detection and digitalization of process operations from the published literature (ISA, 2015a; Márquez, 2007; United States Department of Defense, 2008; Venkatasubramanian et al., 2003c). These three steps are briefly described in this subsection, which also highlights relevant contemporary developments in RTPM for OSD-CM. The supporting infrastructure for implementing manufacturing operations functions could often be geographically distributed across a site and require considerations for an enterprise architecture for system integration. Standardizing the architecture and procedures could allow for adopting a common approach to integrate the various components of OSD-CM into a manufacturing facility for commercial operations, as well as support maintenance, repair, and operations of the systems. A systems architecture to facilitate implementing the data flow for CBM and additional manufacturing operations functionalities is addressed subsequently.
Fig. 1.
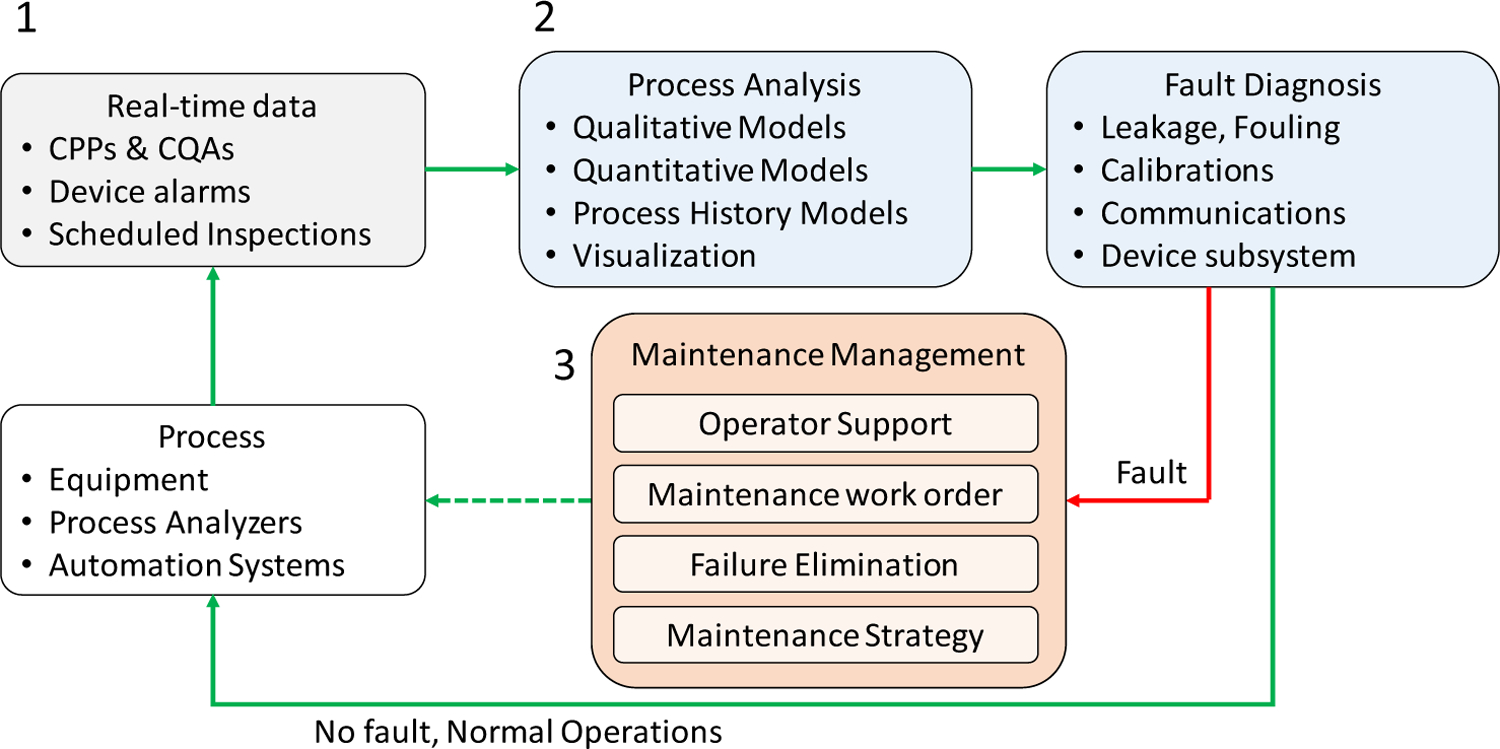
Data flow for continued verification and condition-based maintenance.
2.1.1. Real-time data: sensors, communications, and data management
The first step of the CBM framework is to ensure the ability to source the data and expand the communication network and databases for collecting and contextualing real-time process data (Romero-Torres et al., 2018). Advances in sensing systems for OSD-CM processes (Laske et al., 2017) and using data management and networked communications facilitate this step (Anand et al., 2019; Cao et al., 2018; Ganesh and Hausner, 2019; Su et al., 2019c).
To this end, while active process control strategies for product quality assurance require CPP and CQA data, proactive maintenance additionally requires leveraging the asset condition data for diagnostics. Process operating condition data—such as device running status and alarms, run hours, motor speeds, individual tablet punch forces and standard deviations, device temperature and vibrations, oil levels, greasing frequency, spectroscopic instrument device temperatures, and light intensities—may already be configured by equipment vendors as performance and safety indicators for system health monitoring, troubleshooting, and preventive maintenance. Real-time diagnostics from all the individual assets, along with the operational knowledge of the integrated system, provides a pathway to continued process verification and proactive maintenance planning. Furthermore, monitoring material flow rate across the system using inline mass flow sensors, such as discussed in (Ganesh et al., 2017), enables evaluating process yield in real-time and detecting flow leakage or process variations. Asset condition data, along with the CPPs and CQAs, facilitates integrated process and asset monitoring at multiple hierarchical levels, such as plant operators, plant managers, control room engineers, and research and development personnel, for continued process verification and further process improvements. It is important to note that integrating data sources for proactive maintenance policies in OSD-CM requires active collaboration between the technology vendors and users for identifying the failure modes of the assets and enabling additional sensors and communications links.
2.1.2. Process analysis and fault diagnosis
The second step of CBM is qualitatively and quantitatively assessing potential failure modes in real-time. The maturity in process knowledge enables extending diagnostic indicators to prognostic monitoring, thereby facilitating predictive maintenance. While reviewing specific methods for fault detection is beyond the scope of this work, the Guidance for Industry documents provided by the FDA, such as PAT (FDA, 2004) and Q9 Quality Risk Management (FDA, 2006), highlight multiple tools for risk management in developing and implementing pharmaceutical manufacturing processes.
Recent developments in OSD-CM include frameworks, such as the exceptional events management (EEM) and intelligent alarm system (IAS), to address the issues of fault detection, diagnosis, and mitigation of abnormal events (Giridhar et al., 2014; Gupta et al., 2013; Hamdan et al., 2012, 2010). Here, qualitative model-based methods, such as signed directed graphs, and process history-based qualitative trend analysis and quantitative methods, such as wavelet analysis and principal component analysis, were demonstrated to diagnose faults caused primarily by material blockage and buildup in OSD-CM subsystems. Methods to monitor sensor failures, such as robust state estimation, data reconciliation, and gross error detection, were recently introduced and further demonstrated for OSD-CM applications (Moreno et al., 2019, 2018; Su et al., 2019a). Statistical process and quality control methods (Montgomery, 2012) have further enabled detecting deviations in the process and product (Almaya et al., 2017; Laske et al., 2017).
Fault monitoring methods, along with the ability to diagnose the associated root cause, provide the required capability to prescribe a maintenance activity or necessitate additional condition assessment to support predicting specific downtime event types. Fault diagnosis is vital in proactively managing the consequences of a fault, such as the need for maintenance actions or emergency responses, instead of reactively responding to unsafe conditions and unplanned downtime. For a detailed review of qualitative and quantitative methods for fault detection and diagnosis in the chemical processing industries, refer to the published literature (Venkatasubramanian et al., 2003c, 2003a, 2003b).
2.1.3. Maintenance management
The third step of the CBM framework encompasses the feedback path for continued assurance of system conditions or triggering appropriate notifications, such as an alert, an alarm, or a prompt, for corrective or preventive actions for restoring normal operations based on evidence. This maintenance management step involves using diagnostic checks to verify continued satisfactory operation of the system or to trigger operator and supervisor alerts or alarms for abnormal conditions and to further schedule a maintenance activity as a corrective or preventive task. These triggers enable the CBM framework to respond to alerts or alarms from measurements of the system rather than as a reaction to unplanned downtime events (Kothamasu et al., 2006).
Maintenance tasks rely on the identified conditions and subsequent corrective actions provided by the technology vendors as well as on the reliability assessments performed during process engineering. An automated system could execute these tasks or may require the assistance of supporting technical operations teams (ISA, 2015a). Maintenance activities may require verifying the compliance of a subsystem, performing routine tasks (such as tightening connections or checking liquid levels and lubrication), or overhauling or rebuilding an asset (Márquez, 2007). Performing these tasks may require spare parts, calibration references, and tooling as well as a work order to perform and record the tasks. Moreover, possibly shutting down the process may be required, including updating manufacturing schedules for performing the maintenance action to restore the asset to its required level of operation. Further, real-time risk mapping, such as recently introduced for OSD-CM in (Su et al., 2017), can be used to prioritize the conditions for maintenance activity.
Importantly, maintenance actions only restore the system to its initial functionality. Hence, in addition to proactivley using data and maintenance records to continually verify current system conditions, assessing potential system improvements to eliminate root causes leading to failures and update maintenance strategies for effectively using the assets and resources is vital for improving system capabilities. Computerized Maintenance Management Systems (CMMS) and knowledge management systems aid in managing and optimizing these activities (Andrews, 2018; Center for Chemical Process Safety, 2007; Joglekar et al., 2017; Márquez, 2007).
2.2. System architecture
2.2.1. Approach
Many hardware and software components together enable the required data flow of the CBM framework. To that end, a credible and comprehensive system architecture is essential for the interoperability of the component pieces in the overall process, and it facilitates the implementation by providing guidance for structuring, classifying, and organizing information (SEBoK, 2019b). Notably, the considerations for maintaining machinery and enterprise architectures are captured in multiple industry standards, provided by the International Standards Organization (ISO), International Electrotechnical Commission (IEC), Society of Automotive Engineers (SAE), Machinery Information Management Open Systems Alliance (MIMOSA), Department of Defense Architecture Framework (DoDAF), ISA, User Association of Automation Technology in Process Industries (NAMUR), and other industry-specific standards. While a detailed review of these standards is beyond the scope of this work, some ISA standards are outlined to highlight the considerations of communication and network architectures, human–machine interfaces, equipment modes, and intelligent device configurations required in the systems integration for CBM applications.
Fig. 2 shows a high-level operational concept graphic for the data and information flow required for systems integration and highlights select ISA standards. The concepts from the “functional hierarchy” and “manufacturing operations management” models of the ISA-95 Standard on Enterprise-Control System Integration (ISA, 2010a) are primarily adopted for this architecture. The functional hierarchy model of ISA-95 suggests the hierarchical classification of a manufacturing facility into three main domains: process control (levels 0–2), manufacturing operations management (Level 3), and business planning and logistics (Level 4). The process control domain involves considering physical assets and monitoring and controling the production process, while activities such as maintenance are a Level 3 function, in addition to production, quality, and inventory management. Information exchange must take place between the hierarchical levels for executing operations in the manufacturing facility. Recent architectures continue to expand on the basic idea of ISA-95 mainly through advances in sensing and information technology systems that facilitate the secure integration of Levels 2 and 3 for real-time information exchange. Such integration advances RTPM implementation towards the Industry 4.0 paradigm (Isaksson et al., 2018; Lopez et al., 2018). For example, architectures are increasingly referred to as edge (Levels 0–2 comprising the physical location of manufacturing assets and additional measurement devices, such as the at-line and off-line sensors) and the cloud (Levels 2–4 comprising the network of tools used for implementing the analyses required for advanced process control, manufacturing operations management, and enterprise resource planning). Integrating multiple automation and information technology tools that address these hierarchical levels enables the overall operations management of the system.
Fig. 2.
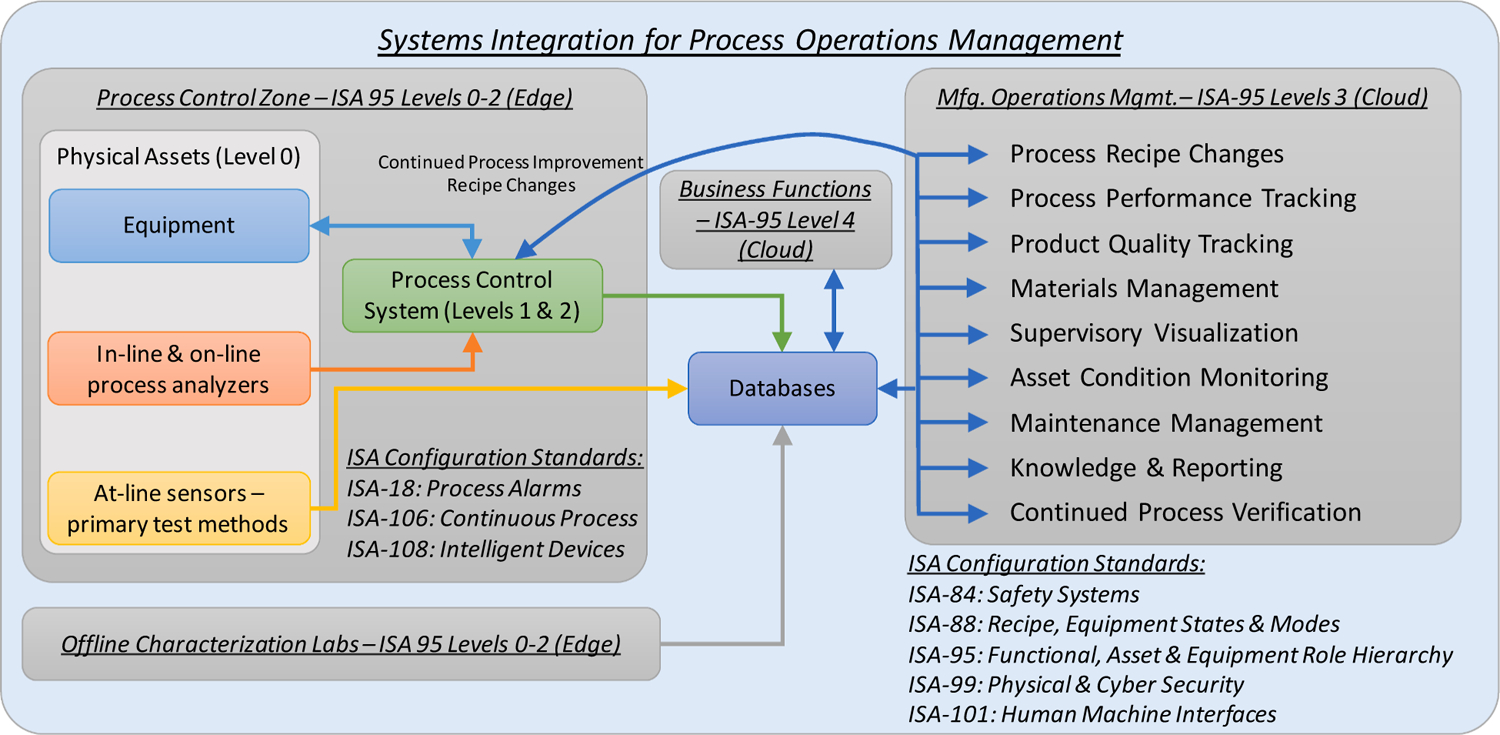
Systems integration for process operations management highlighting ISA Standards for implementing an integrated continuous manufacturing system.
Maintenance management often requires vendor assistance and using product manuals with the support of specialists connected remotely from widely distributed geographical sites. Hence, in addition to the hierarchical ISA-95 models, the “zone and conduit model” of ISA-99 Standard on Security for Industrial Automation and Control Systems (ISA, 2007) is leveraged to guide the network configurations, enabling connectivity between functions while ensuring cybersecurity. Furthermore, the aspects of functional areas, intelligent devices and maintenance processes described in ISA-108 Technical Report for Intelligent Device Management (ISA, 2015a), are leveraged. As defined in ISA-108, an intelligent device has digital communication and supplementary functions, such as diagnostics, in addition to its basic functionality. Diagnostics is defined as an automated function to detect faults, malfunctions, deviations, and variations of hardware or software components of the device. Hence, the goal for OSD-CM is to emphasize using diagnostics from built-in systems in the equipment, sensors, and automation tools to guiding operators and control rooms on infrastructure faults. Furthermore, with the rise of intelligent sensing technologies as “Internet of Things” (IoT) devices, the above considerations from ISA-95, ISA-99, and ISA-108 enable hierarchical integration into the system architecture.
Additional ISA standards facilitate implementing the architecture; however, they are not employed in this work given its focus on proactive maintenance management. The equipment state models defined in the ISA-88 Standard for Batch Control (ISA, 2010b) and the ISA-106 Technical Report on Procedure Automation for Continuous Process Operations (ISA, 2013) can assist in defining the current asset operating scenario. The ISA-101 Standard on Human Machine Interfaces for Process Automation Systems (ISA, 2015b) can be leveraged in the context of human–machine interface. The ISA-18 Standard on Alarm Management in the Process Industries (ISA, 2016) and the ISA-84 Standard on Identification of Mechanical Integrity of Safety Controls, Alarms and Interlocks in the Process Industry (ISA, 2012) further benefit in (1) standardizing the engineering and implementation of sensors and methods for fault detection and (2) configuring process alarms and operator notifications of abnormal process conditions or equipment malfunctions using measurements of process conditions and logic.
Notably, some recent works in OSD-CM have proposed adopting such ISA standards. Frameworks adopting the ISA-88 Standard for Batch Control (ISA, 2010b) in defining equipment operation modes for managing recipes and supervising device states were recently addressed (Brodbeck, 2018; Cao et al., 2018). Previous work from our research group proposed adopting the Process Condition Model from ISA-18 for intelligent alarm management in OSD-CM (Gupta et al., 2013), as well as Quality by Control, a hierarchical framework following ISA-95 for QbD implementation (Su et al., 2019c, 2017).
2.2.2. A CBM architecture for OSD-CM
With the approach to systems integration described previously, Fig. 3 shows a proposed high-level view following the CBM + OV-1 architecture (Office of the Assistant Secretary of Defense for Sustainment, 2008) for the data and information flow required in implementing CBM in OSD-CM. The architecture is a general representation and can be applied to both batch and continuous manufacturing processes. Specific details of this application depend on the system of interest. These details are the subject of ongoing research, but are not addressed in this work.
Fig. 3.
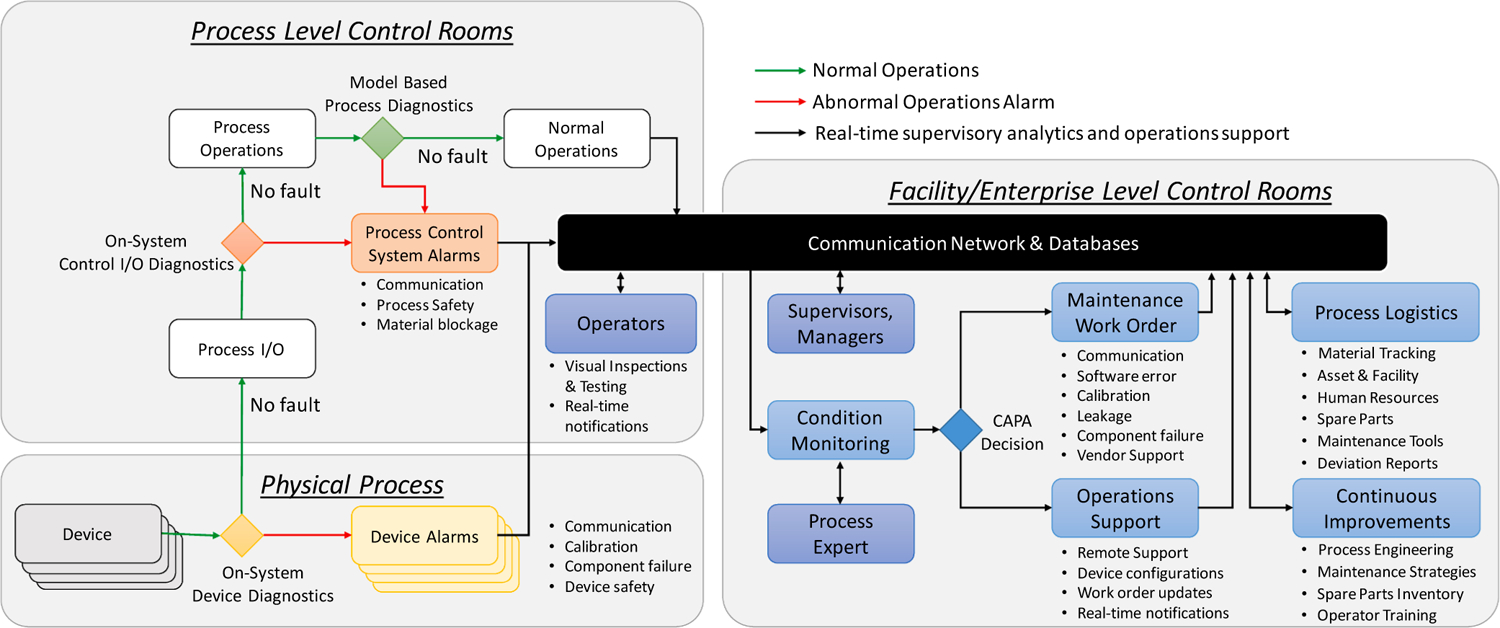
Data architecture for proactive maintenance management in CM.
An OSD-CM process operation comprises multiple physical devices at the Level 0 of ISA-95, such as equipment and sensors constituting the “Physical Process.” Incorporating these physical devices at Levels 1 and 2 of ISA-95 enables the integrated OSD-CM process, shown as “Process Level Control Rooms.” Systematic frameworks for supervisory control of pharmaceutical processes at Levels 0–2, referred to as Quality by Control, was recently presented (Su et al., 2019c). For functional use in the integrated OSD-CM process, the individual equipment and sensors usually require configuration with capabilities for digital communications and supplementary functions, such as diagnostics, in addition to the basic material processing or sensing function. These device-level diagnostics are essential in ensuring effective functioning and identifying abnormalities, such as communication errors, calibration expiration, subsystems or component failures, or breach of device safety in the subsystems. Further, diagnostics for control systems input and output communications (I/O) and of the overall process are crucial for continually verifying normal operations in the integrated system. Alarms in response to disruptions in process conditions, such as those related to safety, material blockage, and communication failures, are reported to the process level operator stations or control rooms, which consequently require intervention steps to return the process to normal operations.
“Facility or Enterprise-level Control Rooms,” or technical operations command centers at ISA-95 Levels 3–4, enable procedures for managing the consequences of failures for CAPA. These include activities such as composing deviation reports, issuing maintenance work orders, providing operator support, updating process logistics, tracking inventory of spare parts and maintenance aids, and executing process reengineering for continuous improvements. The “Communication Network and Databases” facilitate automating Level 3 applications for improved operations support at Levels 0–2 in real-time. Notably, this integration enables access to real-time data from the physical process for enterprise transactions, thereby exposing the process to cybersecurity concerns. Thus, a reliable infrastructure for communications and data management to bridge the two domains is vital. Recent developments in industrial automation, resulting in the availability of capable and reliable information technology systems to bridge these two domains, is one of the major enablers of CBM and additional RTPM applications following Industry 4.0 practices.
3. Implementation in a OSD-CM testbed
3.1. Sensor network risks for OSD-CM operations
Structural malfunctions that occur due to wear in individual equipment could result in a change in the information flow between various variables (Venkatasubramanian et al., 2003c). Hence, the operational risks in the sensor network components, as well as the impacts of material handling on the sensing infrastructure, such as those summarized in Fig. 4, and others, if not adequately addressed, may render advanced process control and strategies for real-time product quality assurance ineffective. Because these failures can degrade the utility of the integrated system, it is essential to take steps that would ensure stability during operations, such as system performance monitoring, calibration verifications, and device maintenance (Su et al., 2019c). Some of these risk considerations affecting the components of the sensor network are briefly outlined next.
Fig. 4.
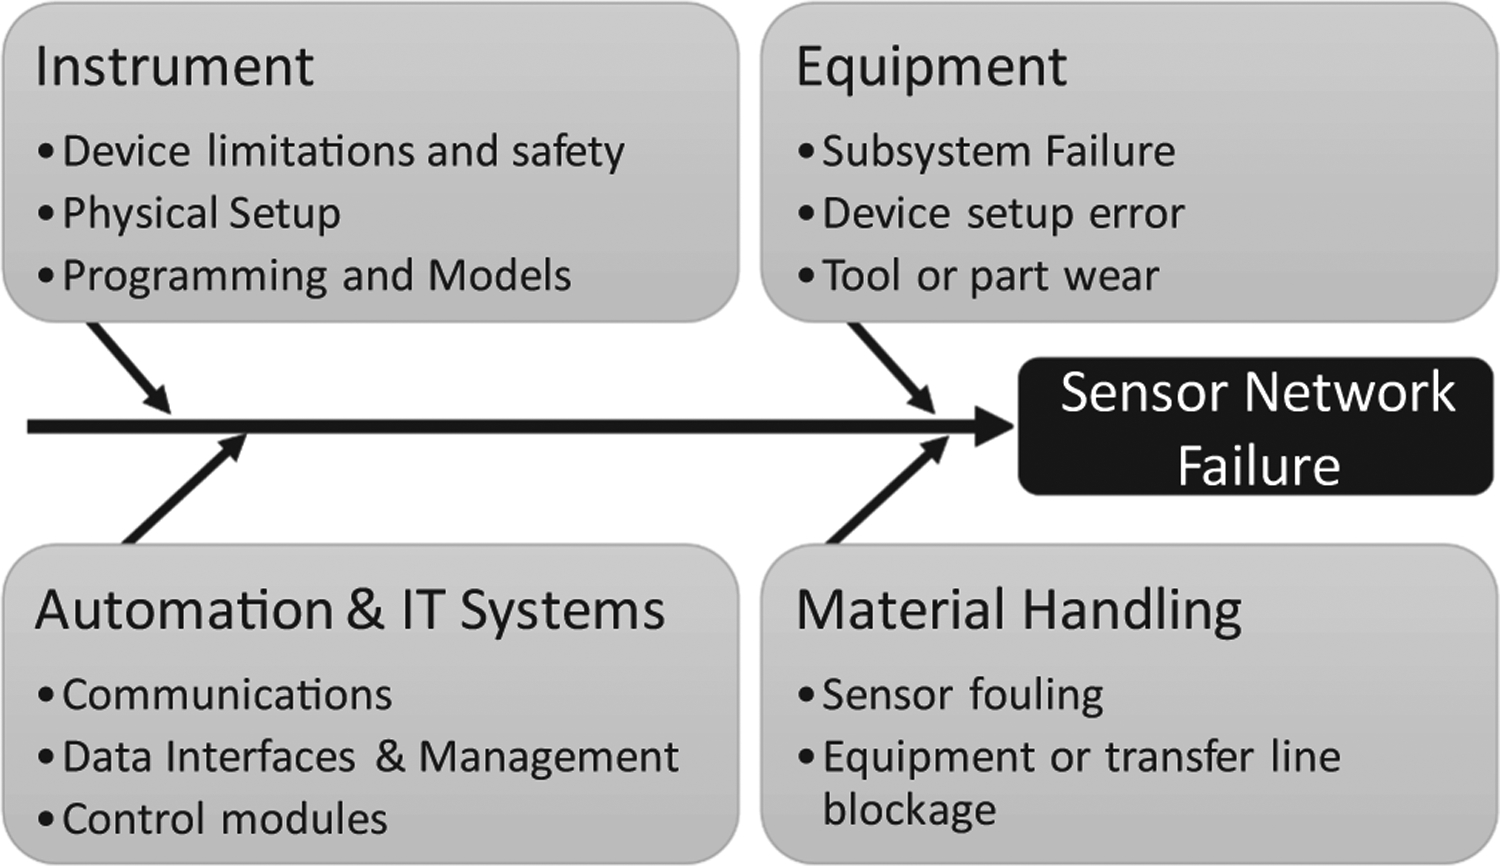
Failure root causes in the sensor network components requiring solid design and diagnostics for continued verification in process operations.
3.1.1. Equipment
Process equipment, such as feeders, granulators, and tablet presses, used in OSD-CM are critical, not only for material processing, but also for enabling plantwide control and providing data for process diagnostics and additional operations management functions. The equipment rely on efficient functioning of their corresponding subsystems and components, such as load cells, solenoids, wear strips, gaskets, retainers, motors, bearings, lubrication systems, electrical connections, and internal controllers among others. However, the assurance that these components are functioning as required is not always easy to attain, and the sheer number of these subsystems and components in an integrated OSD-CM system increase system complexity. Process operations are further challenged by the risks associated with handling particulates, such as fouling, caking, segregation, and rat-holing. In addition, wear in machinery tooling could result in unacceptable product quality, cause product leakage, and thus affect process performance and the information flow for quality assurance. Furthermore, the subsystems for device-level control of CPPs may fail due to poor equipment handling or safety design. The subsystems for lubrication and temperature control of the moving parts may further experience leakage, which could affect the product quality. Consequently, verifying equipment performance during operations and between runs after cleaning cycles is imperative to ensure reliable conditions of the equipment and avoid the need for unplanned shutdowns.
3.1.2. Instruments
Process analyzers or PAT tools are critical for OSD-CM operations because these provide direct or inferential measurements of CPPs and CQAs. The data from these tools facilitate aspects of real-time quality assurance, advanced process control, and additional manufacturing operations management functions. More importantly, these instruments consist of electronic and mechanical components, light sources, optic cables, measurement probes and interfaces, and additional analysis methods and software to acquire and analyze the data in real-time. Device age, such as reaching the limit of the average rated life of the light source, damages to the optic fibers, calibration models and certifications, device safety, and exposure limits, require considerations for proactive asset management. For example, for a fault in the inline near-infrared (NIR) sensors, the mitigation could require cleaning the sensing window and routinely verifying the calibration model, as well as further updating the sensor design to manage and mitigate the fouling conditions. However, if a light source is approaching its rated average life, corrective or preventive actions may require providing inventory of critical components and scheduling the corresponding PAT experts for recalibrations to facilitate short downtimes. These events are generally manageable during operations through device startup and shutdown procedures, and by configuring real-time diagnostic indicators in the programs running the analytics for continued verification. Moreover, managing the parametric changes in the models of these analytical system that could affect the decisions of the supervisory control strategies requires effective model maintenance (García-Muñoz et al., 2017; Miyano et al., 2015). The activities associated with the maintenance of analytical models is an important area of concern for the OSD-CM community, however these details are beyond the scope of this work, which focuses on the holistic architecture for system integration.
In addition to instrument degradation and chemometric model management, process measurements from field devices include random errors arising from sources such as power supply fluctuations, network transmission and signal conversion noise, analog input filtering, and changes in ambient conditions that increase overall complexity (Narasimhan and Jordache, 1999). Furthermore, handling powders is an inherent challenge in all solid processing facilities. Non-stationary events or gross errors, such as frequent sensor fouling arising from particulate processing, affect measurement accuracy. These events could result in a sensor network that is no longer observable, thereby affecting real-time process monitoring systems and subsequent data-driven applications (Bagajewicz, 2010) and necessitate continued verification of the real-time process data sources during operations.
3.1.3. Integrated system
Although an individual item of equipment or PAT tool may be configured satisfactorily in standalone mode, OSD-CM necessitates communications between the individual components and a suite of information technologies for the continuous flow and processing of material and data. Automation systems and the information technology infrastructure, including hardware, software, and network devices, require reliable communication architectures and systematized implementation. Real-time data analytics and decision making at multiple hierarchical levels and functional roles for quality assurance further require additional considerations for systematic data management, such as configurations of data connectors and cybersecurity on an automation network, transient faults, buffer/memory or data packet loss in the network, and multiple database handling. Furthermore, the underlying hardware and software associated with automation systems could have abrupt unpredictable failures, raising consideration of network and component redundancy, as well as proactive strategies for ensuring effective functioning. Also, implementing control strategies in supervisory control systems may require systematic approaches to engineering updates and maintenance of software programs, or control modules, for reliable operations. These modules may rely on tuning parameters that are also affected by equipment age and operating conditions. Failures of the control system are addressed as one of the main challenges for Quality by Control (QbC), necessitating considerations for system integrity such as control performance monitoring, control structure re-organizing and overall system maintenance for targeted improvements to achieve tighter tracking of CQA, and more effective plant-wide control (Su et al., 2019c).
3.2. Testbed description
The case study discussed in this work uses the advanced manufacturing testbed of the Center for Particulate Products and Processes at Purdue University (Purdue CP3). As discussed in Section 2, a system architecture enables using real-time process data for proactive fault analysis and maintenance management, hence CBM. The case study discusses an implementation example of the enterprise-control system integration architecture. The study also provides example fault scenarios in equipment and process analyzers that may require continued verification during process operations and proactive maintenance considerations. As noted earlier, this work aims to emphasize the system integration and maintenance aspects for sensor network integrity. Subsequent publications will report additional ongoing research on failure modes of the process, and corresponding condition monitoring and maintenance considerations.
Fig. 5 provides a conceptual schematic of the process for OSD-CM in the Purdue CP3 facility, incorporating direct compaction and dry granulation processing alternatives (Ganesh et al., 2018). The testbed is comprised of assets from multiple vendors and therefore requires a modular and vendor-agnostic integration of the unit operations, PAT tools, and supervisory control systems for the continuous flow and processing of material and data (Ganesh et al., 2018; Moreno et al., 2019; Su et al., 2019a, 2019c, 2019b).
Fig. 5.
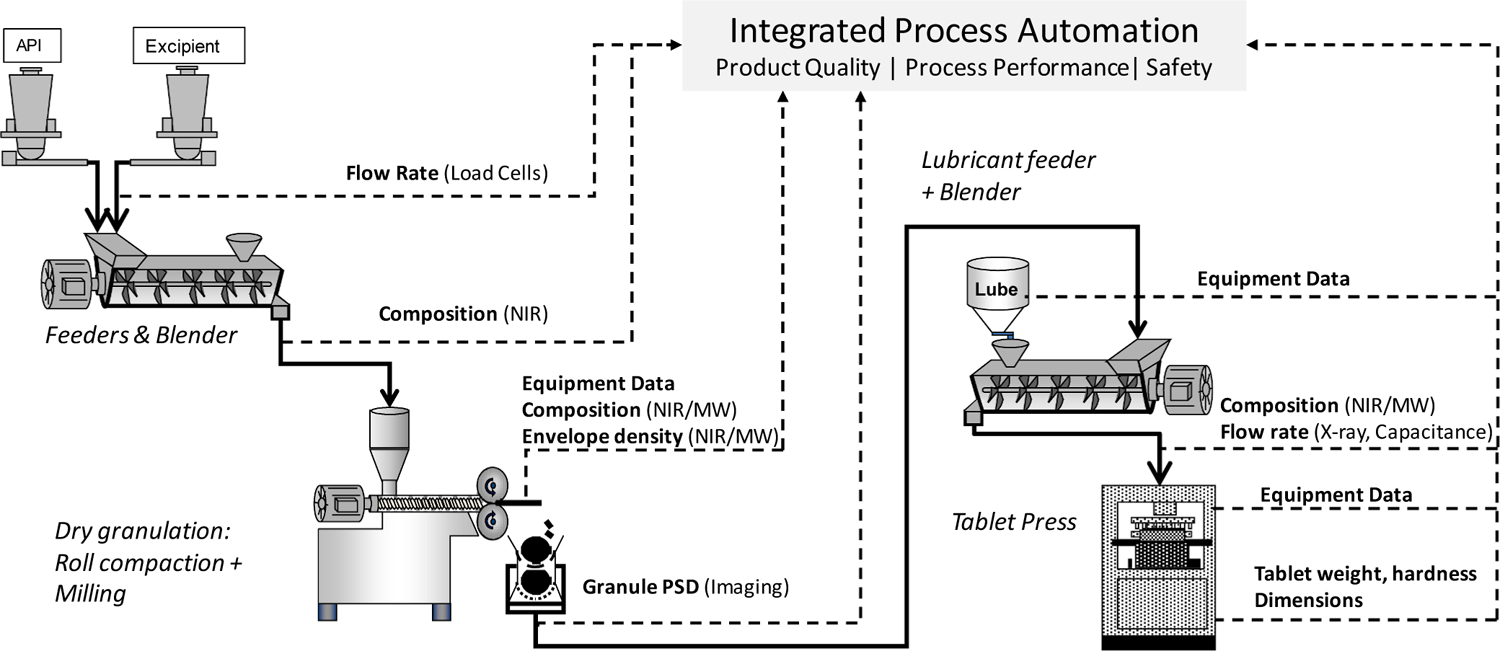
Schematic of CM with direct compaction and dry granulation processing routes (Ganesh et al., 2018).
The case study explores a subset of the process to illustrate the systems architecture for CBM. Fig. 6 shows the physical setup. Specifically, a Natoli NP-400 22 station rotary tablet press is used for directly compacting the blend, which is fed continuously using a K-Tron KT-20 loss-in-weight feeder. An in-house design for real-time tablet weight measurement, based on a Mettler Toledo ME 4001E balance, and the Innopharma Multieye2 NIR sensor were used as representative inline PAT tools. The exit of the tablet press is also connected to a Sotax AT-4 for at-line sampling of tablets to provide weight, thickness, and hardness measurements to the supervisory control system.
Fig. 6.
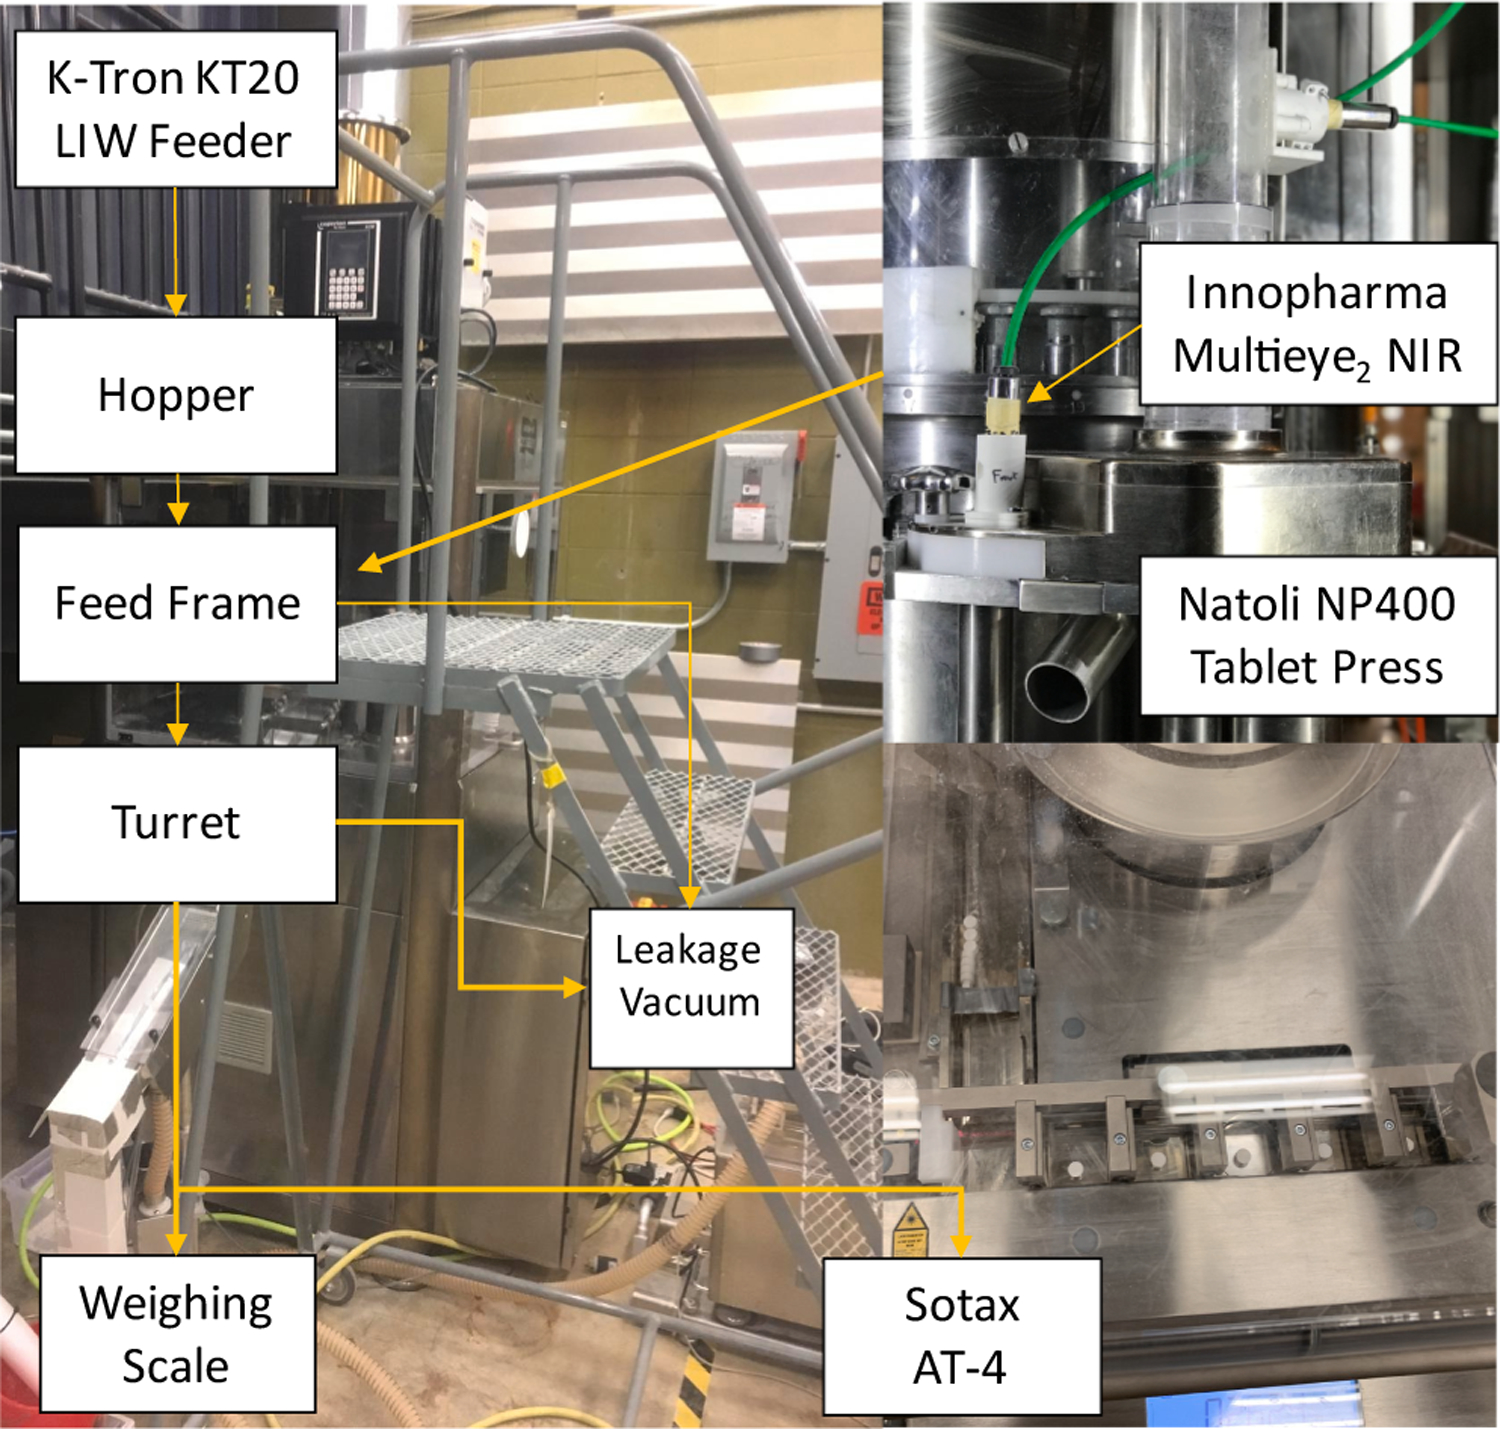
A photo of a subset of the OSD-CM process to illustrate CBM systems architecture.
3.3. Enterprise-Control system integration
Implementing the systems architecture proposed and illustrated in Figs. 2 and 3 requires three vital infrastructural considerations. The first involves integrating the equipment and sensors at the process control domain at Levels 0–2; second, integrating the process into the manufacturing operations management domain at Level 3; and third, implementing Level 3 functions. To this end, DeltaV 13.3 (Emerson) is used for the data management and plant-wide automation through the “Process Level Control Room,” while OSIsoft PI System (OSIsoft, LLC) and SmartFactoryRx (Applied Materials, Inc.) are employed for setting up the “Facility/Enterprise Level Control Room.” Figs. 7 and 8 show an overview of the data flow, and Fig. 9 illustrates the “zone and conduit” diagram for the network connections. While each of these tools has multiple capabilities, they are implemented for specific purposes in the testbed to leverage the existing control systems in the testbed, which is described subsequently. Note from these figures that (1) the functional data flow follows ISA-95 to integrate process equipment that are configured as (2) intelligent devices as defined in ISA-108 for material processing and sensing, while (3) network architectures to host the machines and enable machine to machine communications follow ISA-99.
Fig. 7.
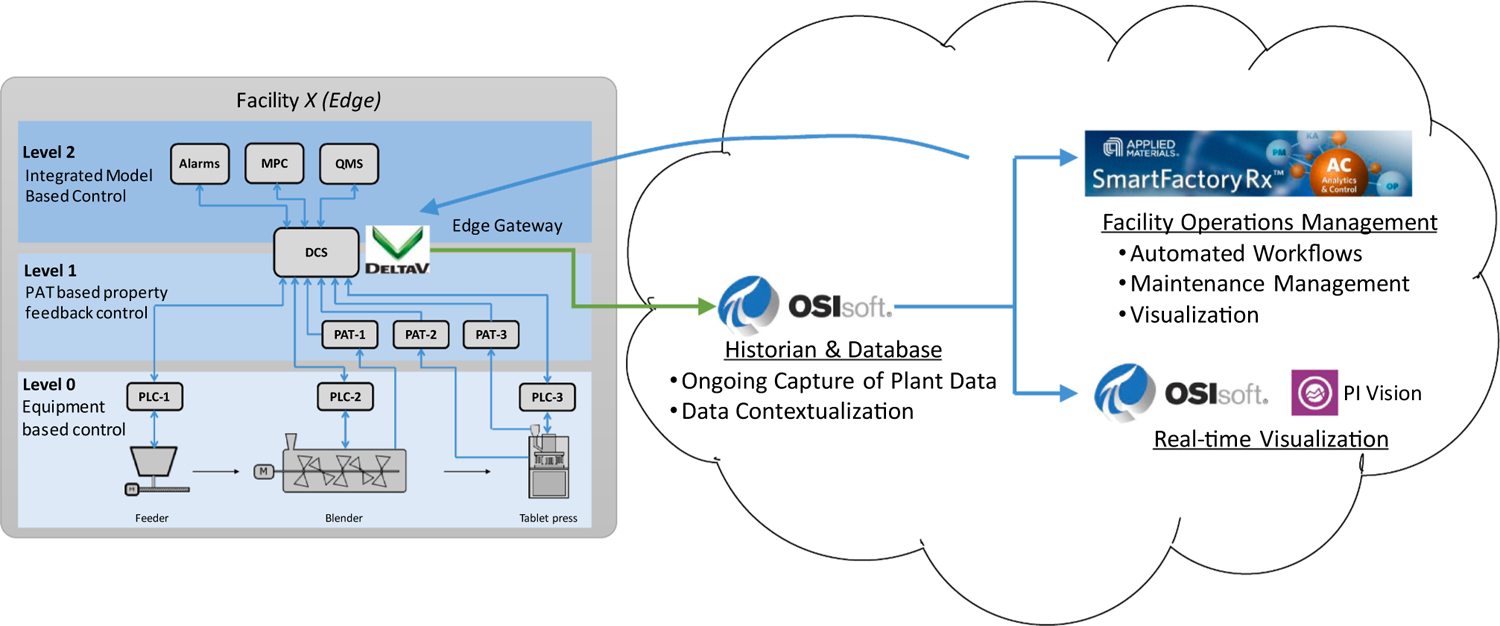
Data flow from assets to control platforms in the testbed.
Fig. 8.
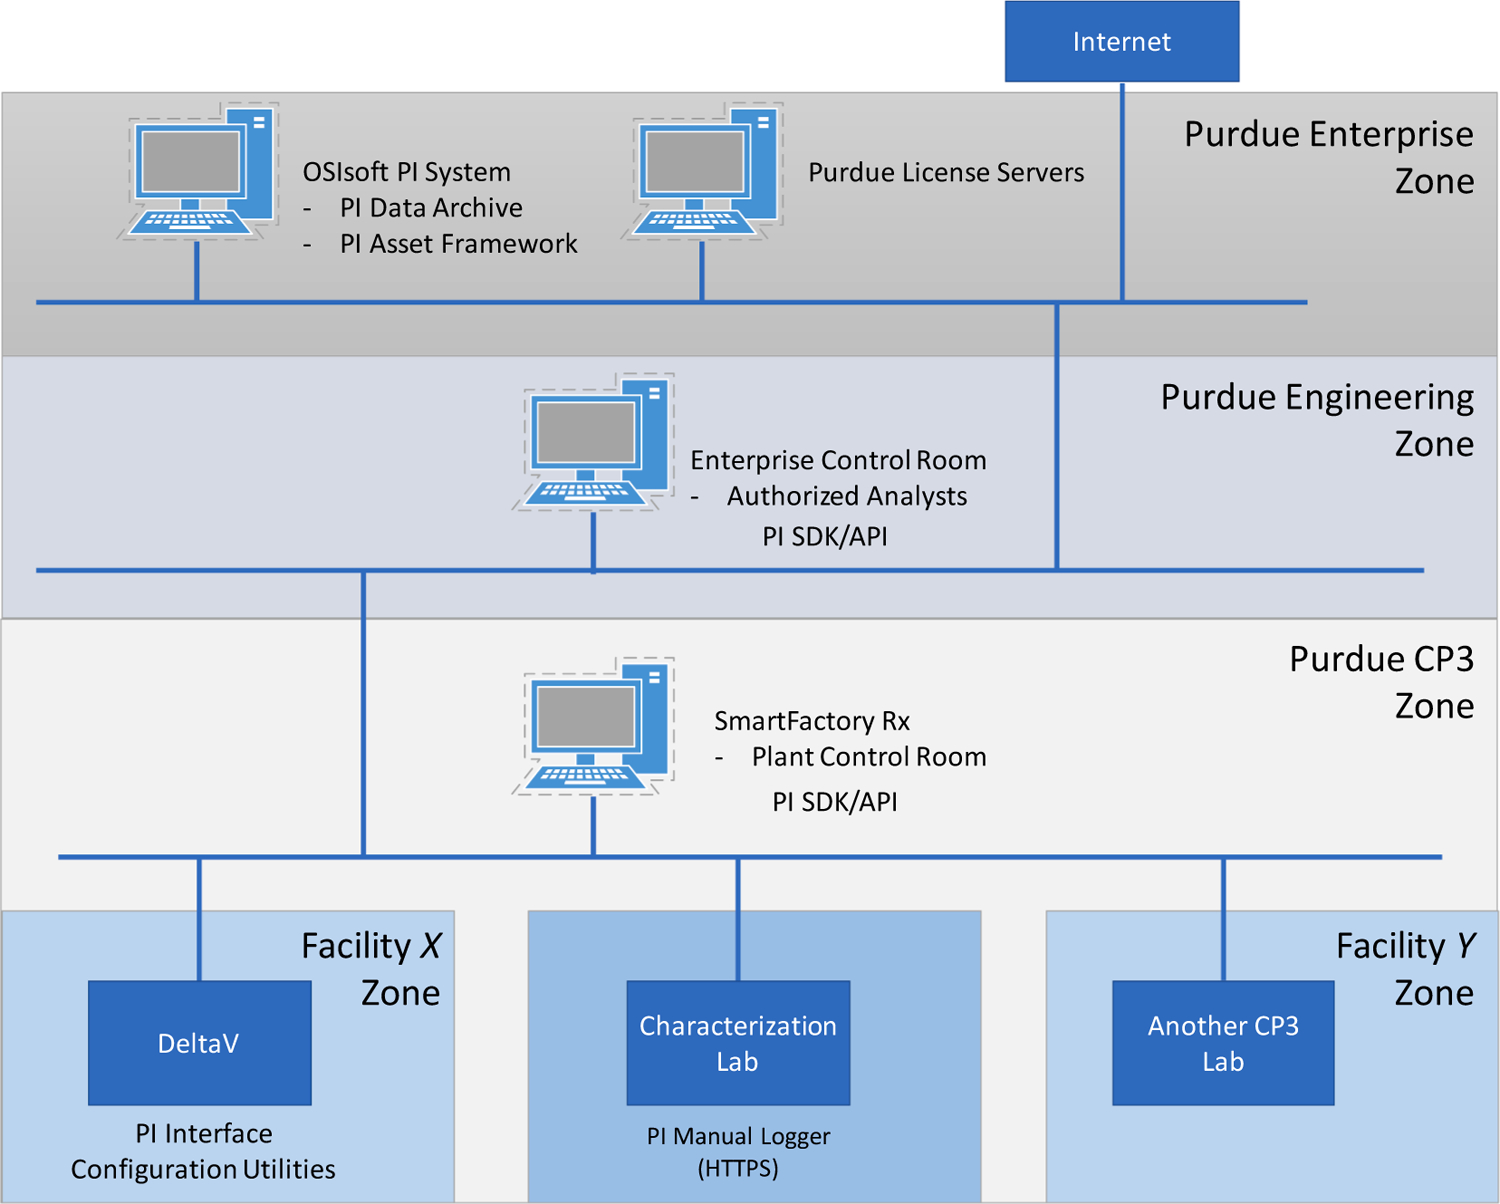
Network connectivity of the CM process facility as part of an enterprise.
Fig. 9.
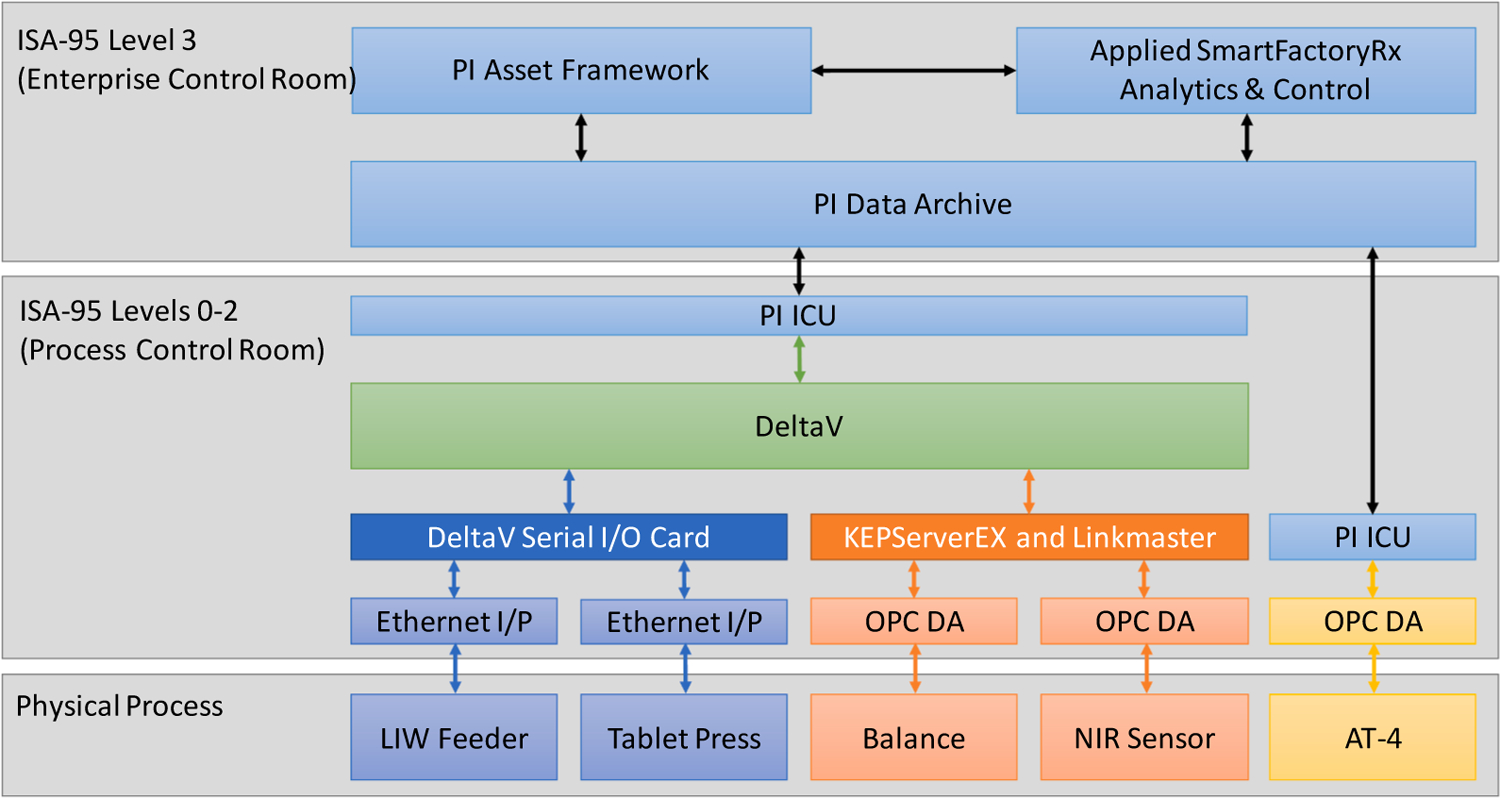
An overview of the data flow from assets to control platforms in the testbed.
3.3.1. Process/site level control room
Architectures to systematically implement Levels 0–2 using equipment level and supervisory controllers for maintaining the normal operating conditions and product quality specifications were recently introduced by the research group and established as the Quality by Control (QbC) framework. To this end, DeltaV 13.3 distributed control system (DCS) provided by Emerson is used for the modular integration of the individual units to result in an integrated OSD-CM process for implementing QbC. The DCS is configured to integrate equipment and PAT tools with the controller for plant-wide process control. The DeltaV controller is physically installed in the pilot plant facility, and the workstations are deployed using virtualization technologies. The control modules and operator interfaces for plant-wide control applications are configured using DeltaV Control Studio in the DeltaV ProPlus Workstation, while the data access server and the continuous historian are accessed using the DeltaV Application Station. The KT-20 loss-in-weight feeder and Natoli NP-400 tablet press equipment communicate with DeltaV through ethernet I/P, while the object linking and embedding for process control (OPC) data access (DA) protocol is used for communications with the PAT tools, as shown in Fig. 9. The different colored arrows representing data flow are intended to indicate the different communication protocols required to establish the integrated system. As shown, communication must be harmonized as the data flow progresses from the physical process to the DCS. Establishing these connections usually requires physical communication cards based on the protocol or access to the OPC DA server of the system. While the physical I/O cards used to connect the equipment are stable communications, directly accessing the OPC servers to connect PAT tools raises cybersecurity considerations. Connecting PAT tools to the DeltaV OPC server thus required applying data transfer adapters using tools such as KepServerEX, LinkMaster (both Kepware, PTC Inc.), and MATLAB Instrument Control Toolbox (MathWorks Inc.). Product guidance documents such as the DeltaV Security Manual were used to manage the complexity of integrating the devices with the DCS. More detailed descriptions of the network architecture at Levels 0–2 for active process control applications are reported in our previous works (Moreno et al., 2019; Su et al., 2019c, 2019a).
3.3.2. Facility/enterprise level control room
While integrating Levels 0–2 of ISA-95 enables the supervisory control of OSD-CM, applications such as CBM involve integrating the process with the manufacturing operations management domain corresponding to Level 3 of ISA-95. Integrating Levels 0–2 with Level 3–4 to implement this work required expanding the infrastructure. To this end, the DeltaV system is implemented as the edge control system of “Facility X,” and the PI System provided by OSIsoft is used to bridge the process control domain and manufacturing operations domain. As shown in Fig. 9, this “Facility X” houses the OSD-CM process and forms a part of the “Purdue CP3” facility zone. The SmartFactory Rx (SFRx) platform provided by Applied Materials is then implemented to use data from the PI System for ISA-95 Level 3 applications. The SFRx platform enables the development and systematized implementation of data-driven and mechanistic analyses in a drag-and-drop workflow-based strategy engine for asset and facility management functions. Applications such as process performance monitoring, maintenance management, and knowledge management can be implemented using its built-in functionalities, interfaces with external proprietary and open source programs, and web service interfaces (Moyne et al., 2012; Vann et al., 2018). The data flow for Level 3 systems is harmonized using the PI System, as shown with the data flow colors in Fig. 9.
As shown in Fig. 8, to replicate a cloud environment for data aggregation and analyses, the PI System and SmartFactoryRx workstations configured using virtualization technologies are hosted in Purdue’s Enterprise Network and in the lab managed “Purdue CP3” Zone. Zoning networks facilitates configuring network security protocols. Moreover, layering the control zones enables leveraging resources provided by Purdue in the form of software licenses for tools such as MATLAB that may be required for developing the data-driven applications. Ongoing research on using the integrated infrastructure for applications in the testbed will be discussed in later manuscripts, while this work uses the PI System in subsequent illustrations as a representative process visualization tool at the facility control room.
The PI System is comprised primarily of the PI Data Archive, the time-series historian and PI Asset Framework, a repository for asset-centric models, hierarchies, objects, and equipment (OSIsoft LLC, 2018). The PI Interface Configuration Utilities (PI-ICU) enable the data connection between data sources and the PI Data Archive. The data tags are configured as PI Points in the Data Archive. Additionally, the Data Archive is an essential security layer between the edge and the systems for Level 3 applications. The corresponding PI Points are accessed using the PI Asset Framework in real-time. The PI Asset Framework is used to contextualize the PI Points as Asset Models and define user access to the databases to facilitate cybersecurity and enable further analysis. PI Vision, a PI System tool is used for visualization and to interface with external software such as SFRx using System Development Kits (SDKs). As the integration layer of data sources from the process domain for manufacturing operations management, the PI Data Archive is configured to harmonize tag naming for systematizing data access, security, and use.
3.3.3. Fault scenarios in data flow
Developing process automation systems for OSD-CM necessitates data exchange at multiple hierarchical levels. Moreover, to connect to the different communication protocols in each of the unit systems, multiple hardware and software components are required. Table 1 summarizes some fault scenarios arising in the IT infrastructure and automation systems experienced in the testbed. These scenarios necessitate the continued verification of data quality for assuring the usability of real-time data from the field sources towards supervisory applications.
Table 1.
Sample fault scenarios that occur in the IT infrastructure and automation systems.
| Failure Root Causes | Diagnostic Sources | Maintenance Actions | |
|---|---|---|---|
| Data adapters | Communication failureCybersecurity Network configuration |
Infrastructure software flags | Inspect I/O card Inspect cables Inspect security settings and network configurations Verify architecture |
| Control modules | Control module error | Control module flags | Model maintenance |
| Model and tuning error | Model flags | Review software |
For example, a fault in the data adapters could have root causes such as communication failure, network settings causing cybersecurity concerns, and network mapping conflicts. Fortunately, the automation systems enable configuring flags to monitor these faults, triggering alerts. These flags can then be integrated into fault trees for root cause identification. However, failures in the components of automation systems usually require offline updates to the respective modules, replacement of the associated hardware, and also potentially a complete reconfiguration of the system that may result in downtime. Aspects such as stable and secure network architectures, redundancy, time-based inspection of the hardware components, and proactive maintenance of IT systems can aid in preventing or reducing such downtimes. Similar considerations for the control modules require control performance monitoring (Su et al., 2019c). For CBM, the components of OSD-CM process are configured taking into account the data flow diagnostics; however, it is also important to consider the devices that are not available as off-the-shelf intelligent devices. Following Fig. 9, the tablet press is used to illustrate the data flow from equipment in the physical process at Level 0 to the facility level control room at Level 3, while the NIR sensor is used to illustrate the same for a PAT tool.
The NP-400 is equipped by Natoli with an Allen Bradley ControlLogix PLC that controls the subsystems of the tablet press. Indeed, the tablet press itself is a combination of multiple subsystems configured as an intelligent device by the vendors to provide diagnostic data in addition to performing its tablet processing functionality. The PLC is connected to the DeltaV DCS using Ethernet I/P. Establishing this connection requires an ethernet cable, a communication network with the VIM2 I/O card, and corresponding data adapters. The VIM2 card requires its own set of communication adapters with the DCS that are configured using the DeltaV ProPlus workstation to map the process variables from the tablet press into the DCS. In addition to its use in developing plant-wide control strategies, the DCS data tags are accessible from the OPC DA server through the DeltaV Application Station. This data flow enables implementing Levels 0–2 functions. Similarly, the Multieye2 NIR provided by InnopharmaLabs is configured with Quanta, proprietary software that controls the spectrometer, records spectral data, and enables CQA predictions using suitable models. The OPC DA3 server provided with the Quanta software communicates the data to the DeltaV DCS in real-time. Therein, data adapters using KEPServerEX and LinkMaster are used to establish the communication between the Quanta OPC DA 3 server and DeltaV OPC DA 2 server. For secure connections between the workstations, an OPC unified architecture (OPC UA) adapter through KEPServerEX is used. Limitations in KEPServerEX require LinkMaster to write data into the DeltaV OPC server for process control purposes. For Level 3 applications, a PI-ICU to directly read from KEPServerEX in the Application Station is implemented.
As evident from the previous description, the communication variety among the component equipment and analyzers results in a complicated data flow to the DCS. Standardizing the interfaces for this data on the part of the PAT tool and DCS vendors could simplify the maintenance requirements of these interfaces. However, in a modular setup such as the testbed used in this case study, software flags at each of these interfaces allow for continued verification of the data flow. These software flags, such as a time stamp or connection status tags from the equipment and automation systems, are used in abstraction hierarchies—a qualitative model-based fault detection method to configure triggers for abnormal conditions and the corresponding prescriptive actions to minimize the resources required for corrective action. Furthermore, proactive considerations for this data flow involves regular time-based inspection of the cables and communication hardware, as well as collaborating with Purdue Engineering Computers Network for IT Securities. At present, unfortunately, failures in the data flow can be detected only after a component itself fails, but the condition triggers at the data interfaces enable a quick resolution of the root cause for maintenance activities.
The data integration in the DeltaV DCS enables developing automation modules for the supervisory control of the integrated process, facilitating the implementation of a “Process Level Control Room.” To integrate the process into a technical operations command center or the “Facility Level Control Room” for Level 3–4 functions, a PI-ICU is configured to access the OPC servers hosted in the DeltaV Application Station. The PI-ICU enables collecting and storing data in the PI Data Archive, following appropriate considerations of security and data compression. The data tags from PI Server are then used in the PI Asset Framework to create the facility and equipment hierarchies. Fig. 10 shows a screenshot of the PI Asset Framework. PI Asset Analytics and PI Vision are then used to configure triggers on the real-time data for continually verifying data flow and displaying operator alerts in the facility using a traffic light system.
Fig. 10.
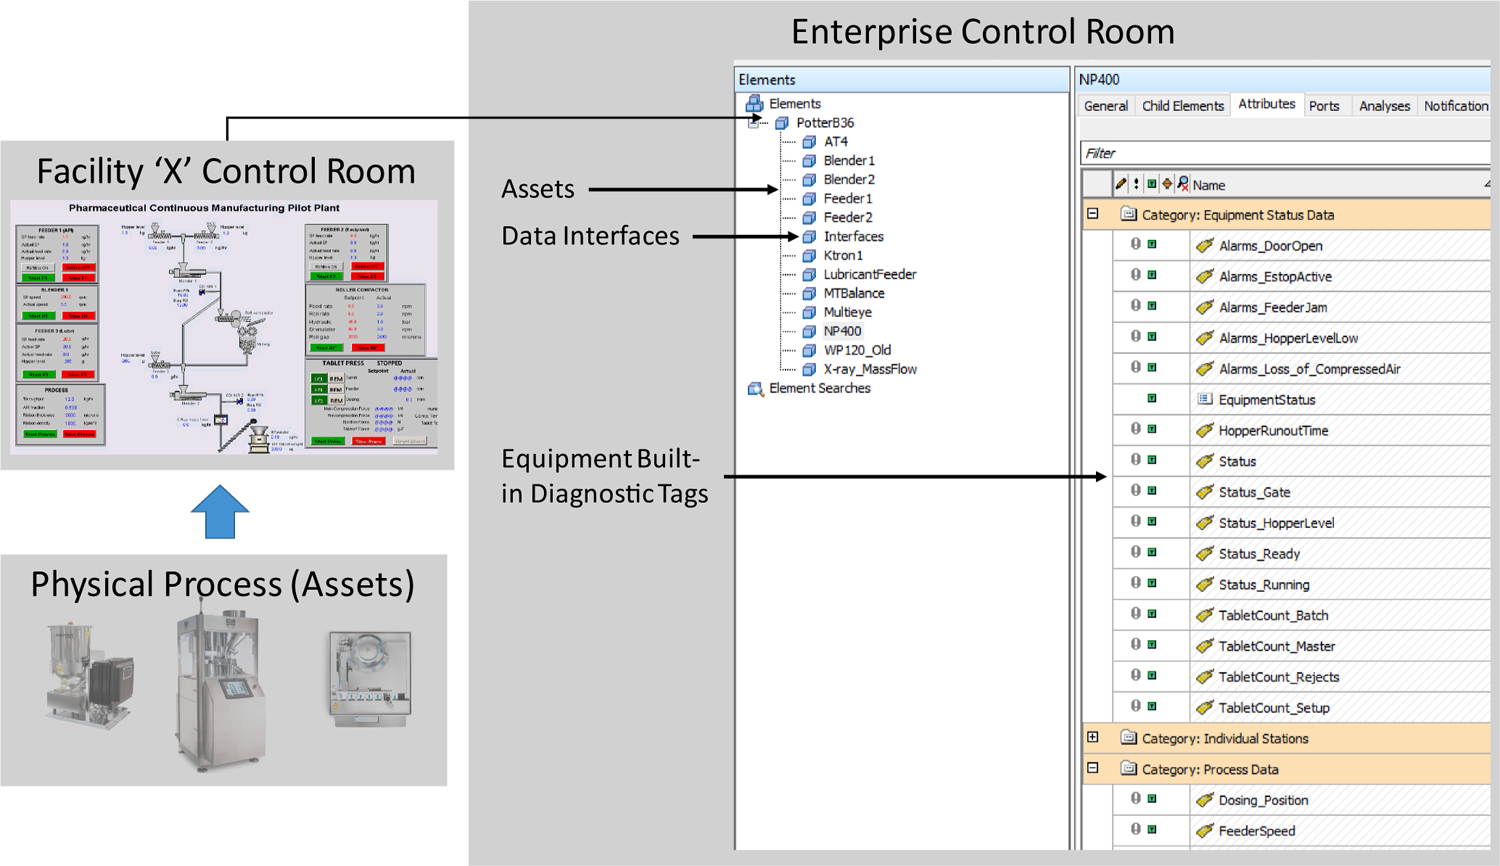
Data from assets of facility “X” for Level 3 applications.
Fig. 11 shows the operations dashboard for the entire process, which is simultaneously accessible on the process floor and enterprise control rooms. As shown, a green status indicates a working condition, while red indicates a system shutdown or fault status. Gray indicates stand-by status. In this illustration, the testbed researcher uses the traffic lights as alerts for the required corrective or preventive action. The ongoing configuration of SmartFactoryRx is designed to automate a workflow to use the triggers to not only alert the operator, but also initiate corresponding maintenance actions.
Fig. 11.
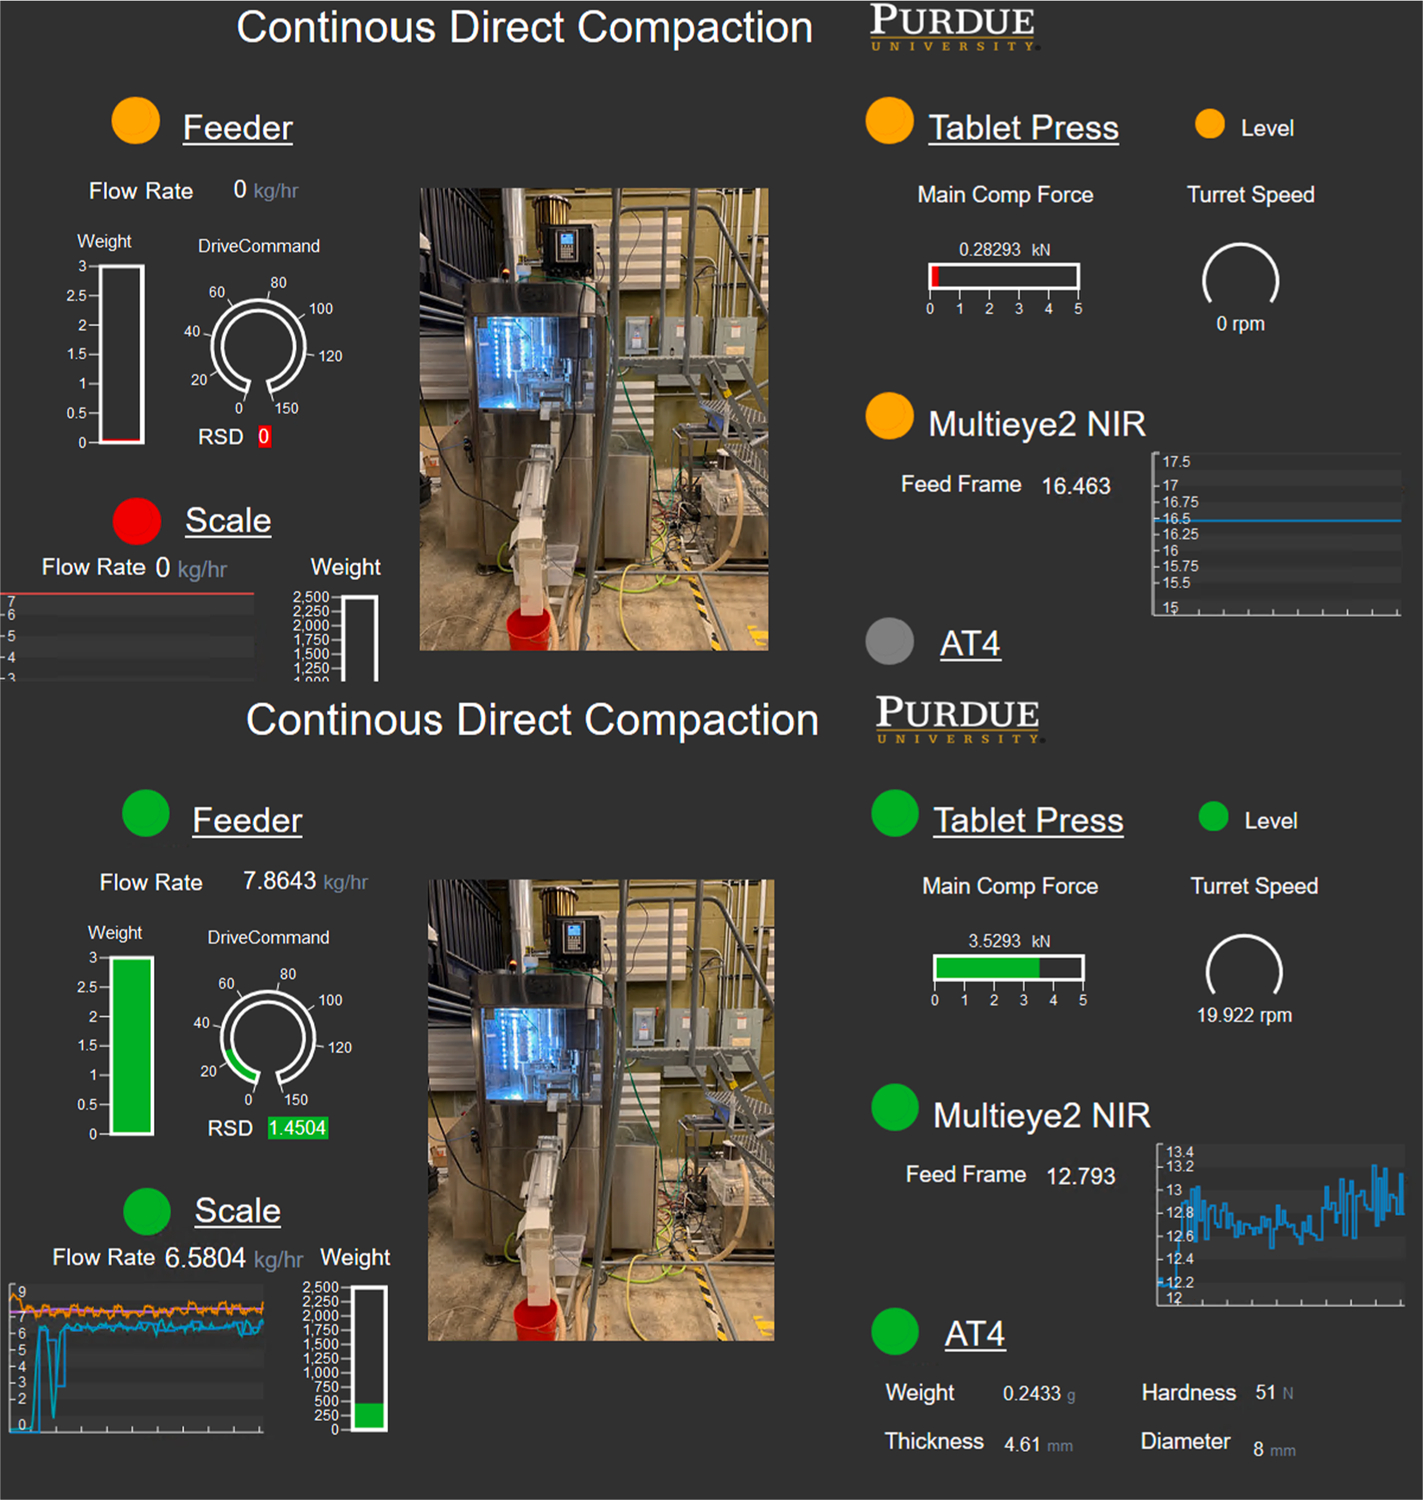
Dashboard of the process in the “Facility Level Control Room.” Top: Inactive or connection requiring a maintenance action. Bottom: Continued verification of data flow.
3.4. Fault scenarios in process instrumentation
Individual PAT tools used for inline and at-line monitoring of CPP or CQA usually consist of three components: (1) the sensing device, (2) a program to control the instrument and analyze the data, and (3) the cables connecting the sensor to the computer. For the measurement to be useful for real-time quality assurance and advanced process control of the integrated process, the measurements must be communicated to a supervisory control system and require additional considerations for data transfer. Each of these components has failure modes that may render the data unreliable or unavailable, requiring device diagnostics to identify abnormal conditions and their corresponding root causes. Table 2 lists some example faults in the process instrumentation and identifies potential data sources for fault diagnostics and maintenance actions. The failure scenarios are illustrated with a weighing balance and the AT-4. The simple weighing scale is used to collect tablets exiting the tablet press chute and to record the cumulative weight of the tablets produced, while the AT-4 is used as the at-line tablet property measurement tool, as shown in Fig. 12. The balance is configured in-house for this application and resembles a “non-intelligent” device in its setup, while the AT-4 system is an intelligent device provided by Sotax with its diagnostics and data exchange servers.
Table 2.
Sample fault scenarios that occur in individual PAT tools.
| Failure Root Causes | Diagnostic Sources |
Maintenance Actions |
|
|---|---|---|---|
| Device limitation | Maximum capacity Average rated life Temperature |
Device data | Calibrate sensors Change parts |
| Physical setup | Sensor holder design Blockage Communication failure |
Visual inspection Device software flags |
Change device setup Change cables |
| Programming and models | Device software issue Model failure |
Device software flags Model flags |
Review software Model maintenance |
Fig. 12.
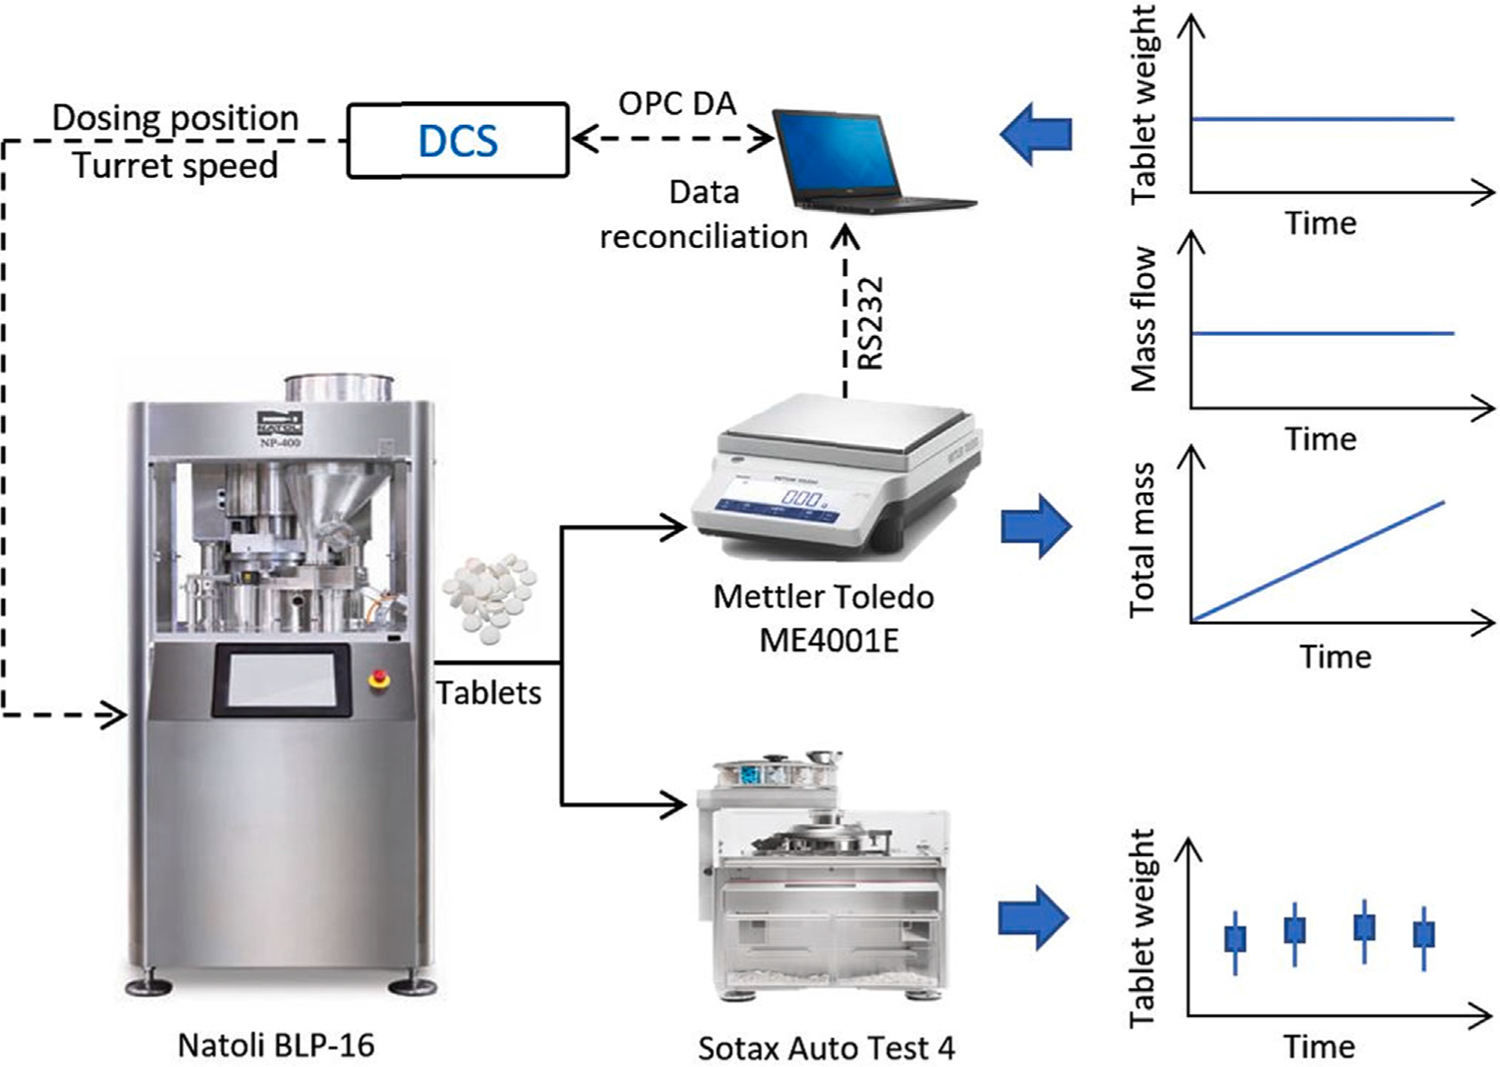
Tablet weight measurement for real-time monitoring and control (Su et al., 2019c).
The balance serves as a non-redundant mass flow rate measurement for the integrated sensor network; hence, a reliable measurement from this sensor is imperative for stable monitoring and control (Moreno et al., 2019; Su et al., 2019a). To record the flowrate measurement, the balance is connected to a laptop computer through a RS232 cable to collect the total weight on the scale, and then processed for the flow rate measurement using the MATLAB (MathWorks Inc.) Instrument Control Toolbox. For a reliable raw measurement from the sensor, from an asset setup point of view, first the total weight on the scale must be below the load cell’s rated limits. To obtain the flow rate measurement, the cables from the sensor have to be securely connected to the computer, and the program that collects and analyzes the data must be stable and efficient. More importantly, some of the analyses performed on the raw measurements of the sensor may require access to software licenses. Continually verifying the sensor’s reliable functioning requires visibility of the total weight on the scale and assurance that the physical connections and software enabling data acquisition data and processing are active. Triggers are configured for these device limitations to alert an operator for corrective action, such as a required change of the collection bucket during process operations to safeguard the load cell. While the operator can manage the total weight on the scale and because such a change is not a maintenance action, similar triggers can be configured to identify some safety concerns, preventing an unscheduled process downtime.
The AT-4 is used to sample tablets for at-line analysis, and these primary test method analyses provide vital data for quality assurance and model maintenance. However, while collecting and measuring samples are automated through the device, the physical setup and transfer chutes could result in a blockage. Such blockage results in a failed measurement from the process, requiring operator alerts and further considerations to improve the physical setup. The AT-4 system is provided as an intelligent device by the vendor, and the diagnostic data is accessed using the OPC DA2 server on the device. Furthermore, for potential additional “Internet of Things” devices, the AT-4 is set up to illustrate the data flow and fault considerations for such intelligent devices, as shown in Fig. 9. Data tags corresponding to device alerts and alarms are identified and used in the alerts to prevent an unplanned shutdown of the process. Fig. 13 illustrates the operator dashboard at the control room employing the device diagnostics.
Fig. 13.
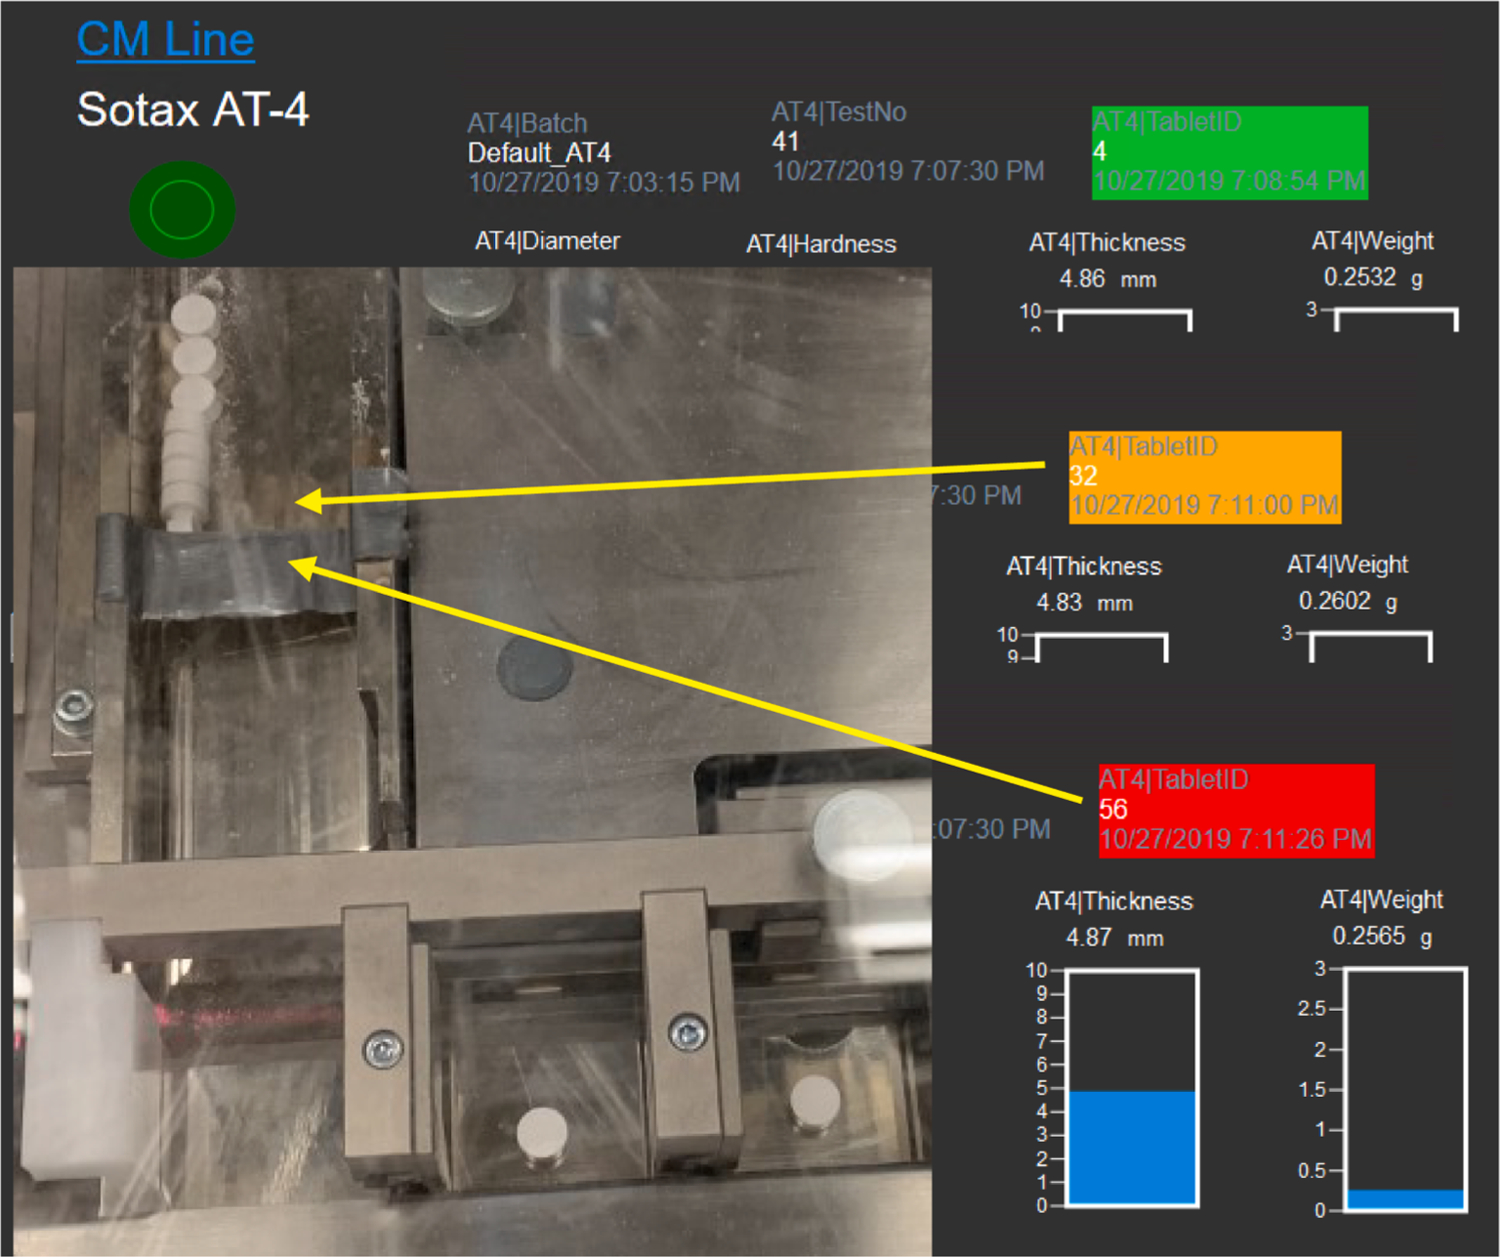
Alert indicating material blockage and measurement failure in the at-line sensor.
While the operator can manage the above tasks to ensure timely measurements from the analyzers, damage to the cable and physical connections, software, and calibrations require additional support or spare parts and subsequent maintenance considerations. Additionally, measurements provided by the load cells require periodic verifications using reference weights. For proactive maintenance, although damage to the cables or software failure cannot be predicted, a record of load cell recertification and license expiration dates provide information to proactively schedule the corresponding activities during a planned downtime. Additionally, with a frequency record of failure root cause occurrences, software maintenance to update the data transformation workflow or replace cables may be necessary.
3.5. Fault scenarios in process equipment
The tablet press, a critical asset in the integrated CM process, is, by itself, a multi-stage process and is treated as such in this illustration. The equipment consists of multiple stations for tablet compaction, during which material in each station undergoes the following major steps: die filling, metering, pre-compression, main-compression, and tablet ejection and take-off from the lower punch. The setpoints for the operating condition at each of these stages are implemented by a subsystem consisting of mechanical and electrical components, with alarms or system diagnostics built into the equipment control system to provide notice of abnormal conditions. Table 3 summarizes some fault scenarios in the equipment that could affect the functionality of the integrated process, potential diagnostic sources, and maintenance actions.
Table 3.
Sample fault scenarios that occur in the tablet press.
| Failure Root Causes | Diagnostic Sources | Maintenance Actions | |
|---|---|---|---|
| Subsystem failure | Subsystem safety design | Device data and alarms | Inspect subsystems |
| PLC & HMI error | Process models | Review software | |
| Communication failure | Verify device settings | ||
| Physical setup & operating conditions | Tool installation | Visual inspection | Verify device settings, subsystem calibrations, setup |
| Equipment leveling | Condition monitoring | ||
| Punch penetration | Process models | ||
| Consumables | Grease or lubricant levels | Device data and alarms | Replenish consumables |
| Dust handling | Visual inspection | ||
| Vacuum system inspection | |||
| Tool or part wear | Wear strip | Device data and alarms | Maintain tools |
| Tablet punch assembly | Visual inspection | Change parts | |
| Turret balancing | Process models |
Wear in the tablet press tooling—such as punches, subsystems, scrapers or dosing cams; alignment changes of the turret; consumption of grease and barrel oil—require regular equipment maintenance for effective operations (Bundenthal, 2017; Natoli Engineering Company Inc, 2019). Furthermore, the PLCs used for integrating and controling these multiple subsystems may require systematic approaches to software updates. The risk considerations for these subsystems are generally managed through equipment startup and shutdown procedures, operator training, and device maintenance. Furthermore, the equipment is configured as an intelligent device to provide alarms. Nevertheless, unanticipated downtime in the tablet press could result in an unplanned shutdown of the entire process and thus continued verification of performance and operator support for troubleshooting of the failure modes is important for quick turnaround. Moreover, gradual wear in the equipment could result in changes in the information flow between various variables (Venkatasubramanian et al., 2003c). To illustrate this possibility, a main compression force subsystem failure and wear of the turret assembly are discussed further.
A recent malfunction of the main compression thickness control loop was encountered but did not trigger an alarm in the device PLC. As the process was in operation under active process control, the process model, or digital twin, also used in model predictive control, detected this malfunction. The details of the process model were discussed in previous works (Su et al., 2019a, 2019b, 2018). Fig. 14 illustrates an early stage use of the digital twin for condition monitoring of this fault. The digital twin predicts the tablet weight (Twei), pre-compression force (Pcom), main compression force (Mcom), and tablet production rate (Prod) over a receding prediction horizon. The model prediction errors were calculated based on the real-time measurements of these controlled variables, populated in a moving-window time, and compared to the historical error distributions model prediction error distributions. As shown in Fig. 14 b, the unflagged main compression thickness control failure could be identified from a shift in the error distribution for main compression force and used for root cause analysis of the main compression stage.
Fig. 14.
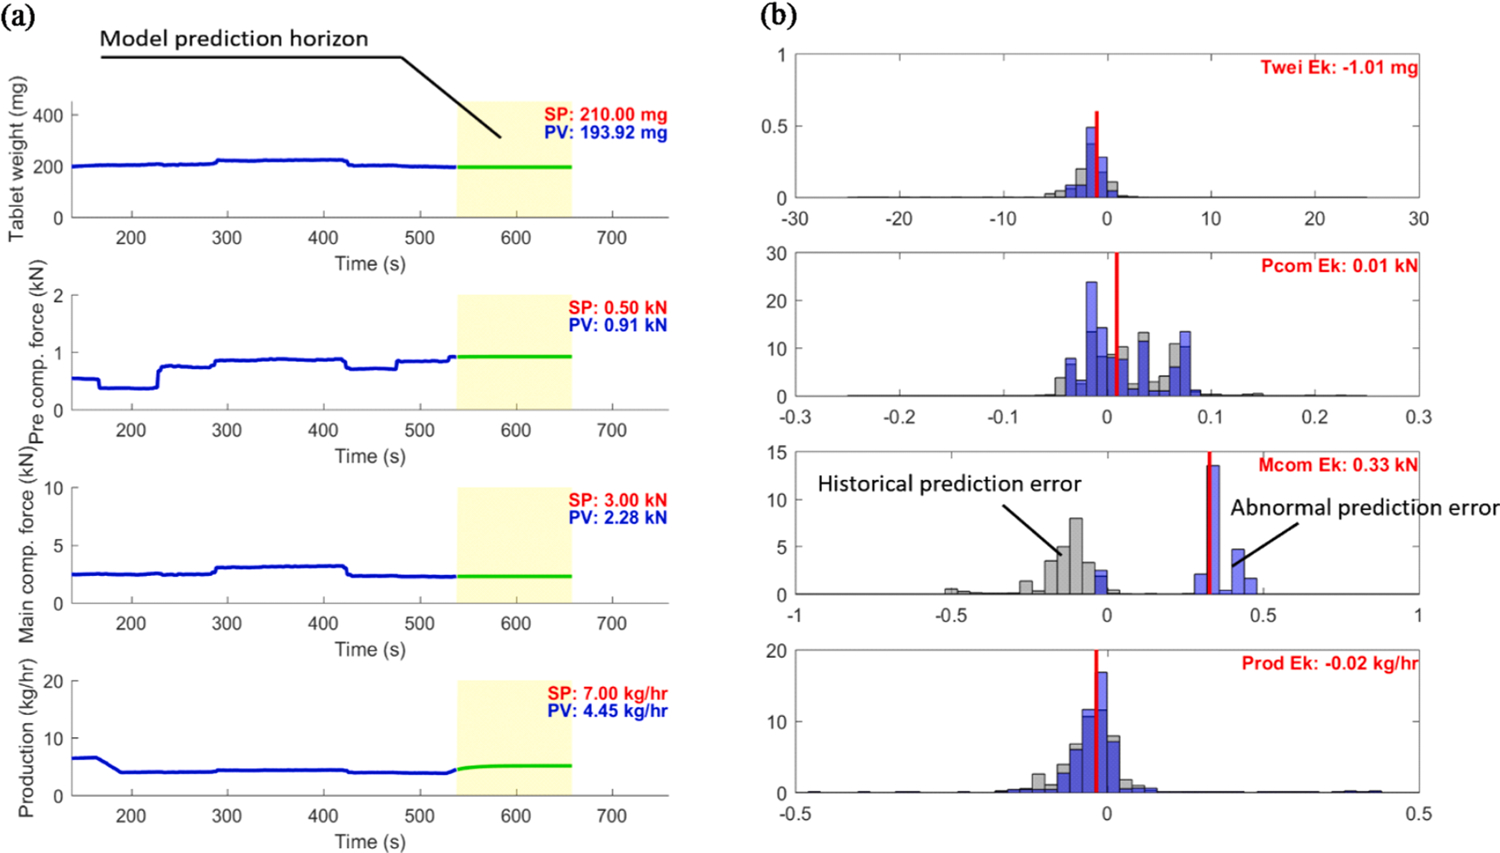
Model prediction error distribution based on a digital twin as a fault monitoring strategy.
Equipment troubleshooting, supported remotely by the tablet press vendor, recognized the above subsystem failure as a safety design for the main compression thickness assembly, which was caused by a previous improper equipment shutdown. As the gap between the punches was not accurately available after a thickness encoder failure, no setpoint changes were allowed to prevent crashing the lower punch into the upper punch. The immediate corrective action required disassembling the tablet punches and further verifying the calibrations for the thickness at the main compression station, which is usually performed as a maintenance activity. Additionally, the preventive action required updating the standard operating procedures for startup to ensure that the subsystem was operational before loading the material and performing a shutdown of the system. Note that troubleshooting with the vendors was performed remotely, which required a reliable and secure network to connect over the internet.
The physical setup between the feed frame and the turret of the tablet press uses a wear strip. The wear strip prevents the contact between moving parts and is subject to deterioration. Moreover, the turret assembly is supported by the main frame assembly, and regular operations necessitate rebalancing the inspections of these parts to prolong the life of the equipment and ensure the functionality of the subsystems for the process. As shown in Fig. 15, wear in these parts eventually is manifested as powder leakage in the tablet press. While the vendor and experienced users of the tablet press can identify these faults, such leakage reduces overall process yield. Leakage can be detected using level sensors in the hopper or by monitoring the material balance across the equipment in real-time. The dashboard in Fig. 15 shows the mass flow rates that are used as a trigger criterion in the testbed. After establishing the necessary maintenance, spare parts, tools, and maintenance procedures must be available to enable the maintenance activities.
Fig. 15.
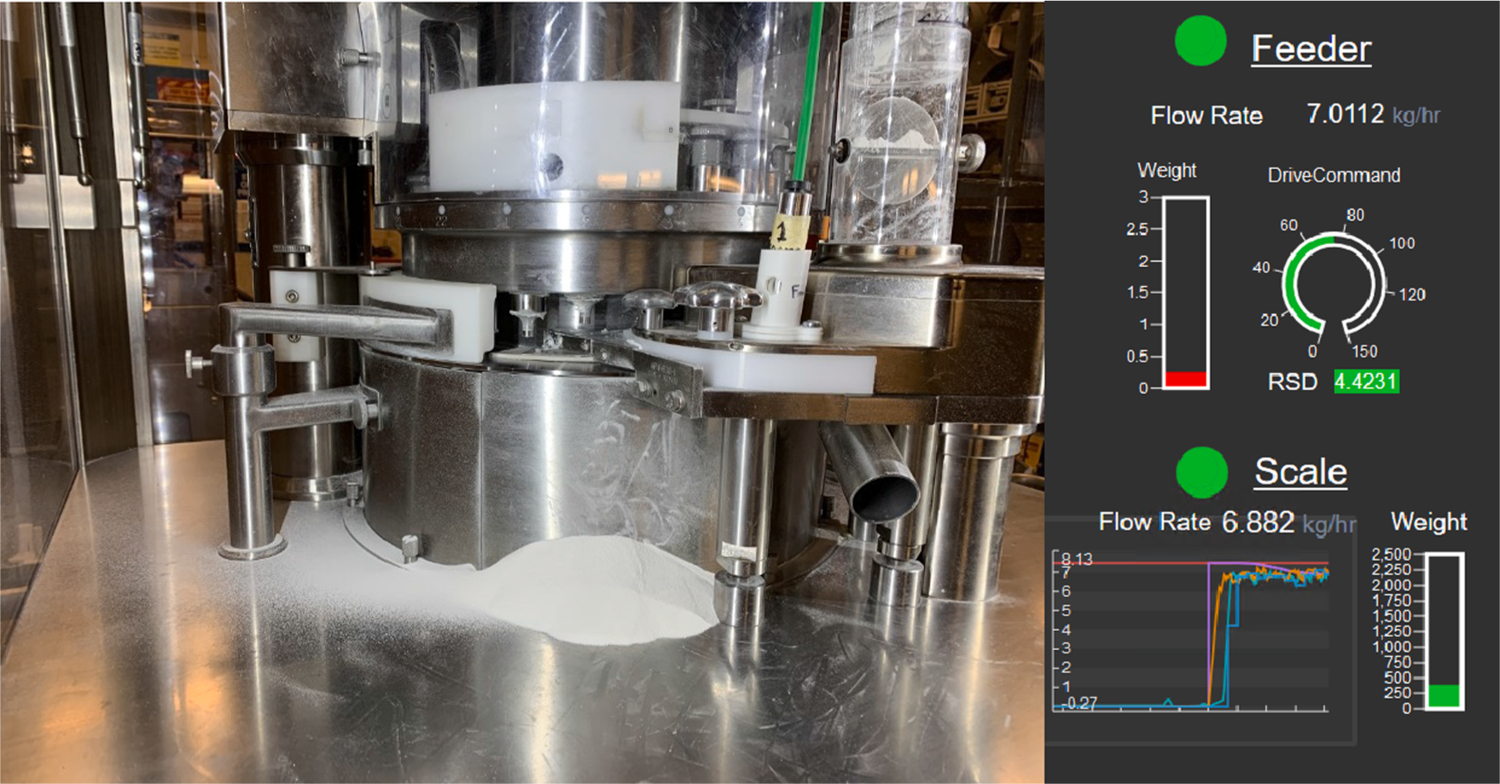
Leakage arising from wear in the tablet press, with usage of mass balance for condition monitoring.
4. Concluding remarks
OSD-CM processes enable the continuous flow and processing of material and information through the systematic integration of solids processing unit operations, supported by analytical systems, process knowledge, and automation methods. Some of the failure modes arising in these individual units during process operations of OSD-CM could result in unplanned downtime and further impact product quality or process productivity. Mitigating such disturbances necessitates continued system verification and developing and implementing maintenance strategies for reliable operations. Moreover, maintenance considerations are crucial to manage process risks during the product’s life cycle.
This work introduced CBM in terms of its rationale for continued verification and sustainment for reliable operations. CBM is a mature maintenance management strategy, intended to proactively monitor and manage the conditions that may lead to failure or diminished functionality of the system, instead of strictly relying on time-based inspection and replacing components or reacting to unplanned events. The data flow for CBM consists of three workflows for data sourcing, analysis for fault detection, and lastly, operations support. Developments in OSD-CM address multiple aspects of the CBM framework and thereby, facilitate proactive maintenance management. This work builds on these advances in RTPM for OSD-CM and emphasizes the system integration and maintenance aspects for sensor network integrity.
This work discussed a systems architecture required for the CBM data flow, illustrated its implementation in a testbed for OSD-CM, and highlighted some potential fault scenarios of the infrastructure. The implementation leverages the advances in emerging technologies that are integral to the current wave of Industry 4.0 practices for manufacturing operations management. Ongoing research includes using the infrastructure implemented in the testbed to address additional failure modes in the sensor network components and the corresponding methods for condition monitoring and subsequent maintenance. With increased implementations of continuous manufacturing, frameworks such as CBM, enabled by process knowledge and the availability of real-time data, can directly support continued verification, maintenance, and operational excellence. Manufacturing operations in the pharmaceutical industry—ranging from a single unit operation to a series of physically integrated unit operations, whether batch, hybrid, or continuous—can effectively exploit the proactive use of process data and modern maintenance practices.
Acknowledgments
This project was supported by the United States Food and Drug Administration through grant U01FD006487. The views expressed by the authors do not necessarily reflect the official policies of the Department of Health and Human Services; nor does any mention of trade names, commercial practices, or organization imply endorsement by the United States Government. The authors thank our colleagues Yash Shah, Rushali Saxena, Yasasvi Bommireddy, and Prof. Marcial Gonzalez at Purdue for their feedback and assistance in the project. We further extend our gratitude to the technology providers, particularly Doug Voss from Natoli; Joshua Harely, Shawn Whitaker, and Sundeep Rao from Purdue Engineering Communications Network; Mike Mihuc from OSIsoft; Amy Doucette and Richard Stafford from Applied Materials Inc.; and Gareth Clarke from InnopharmaLabs.
Abbreviations:
- CBM
Condition Based Maintenance
- DCS
Distributed Control System
- FDA
United States Food and Drug Administration
- ICH
International Council for Harmonization
- ISA
International Society for Automation
- IT
Information Technology
- OSD-CM
Continuous Manufacture of Oral Solid Doses
- OT
Operations Technology
- PAT
Process Analytical Technology
- PLC
Programmable Logic Control System
- QbD
Quality by Design
Footnotes
CRediT authorship contribution statement
Sudarshan Ganesh: Conceptualization, Methodology, Software, Investigation, Writing - original draft, Visualization, Project administration. Qinglin Su: Methodology, Software, Investigation, Writing - original draft, Visualization. Le Bao Dan Vo: Validation, Investigation, Data curation, Visualization. Nolan Pepka: Validation, Investigation, Data curation, Visualization. Ben Rentz: Validation, Investigation, Data curation, Visualization. Lucas Vann: Resources, Writing - review & editing. Nima Yazdanpanah: Writing - review & editing, Supervision, Resources. Thomas O’Connor: Writing - review & editing, Supervision, Resources. Zoltan Nagy: Conceptualization, Writing - original draft, Supervision, Funding acquisition. Gintaras Reklaitis: Conceptualization, Writing - original draft, Supervision, Funding acquisition.
Declaration of Competing Interest
The authors declare that they have no known competing financial interests or personal relationships that could have appeared to influence the work reported in this paper.
References
- Ahmad R, Kamaruddin S, 2012. An overview of time-based and condition-based maintenance in industrial application. Comput. Ind. Eng 63, 135–149. 10.1016/j.cie.2012.02.002. [DOI] [Google Scholar]
- Almaya A, De Belder L, Meyer R, Nagapudi K, Lin H-RH, Leavesley I, Jayanth J, Bajwa G, DiNunzio J, Tantuccio A, Blackwood D, Abebe A, 2017. Control Strategies for Drug Product Continuous Direct Compression—State of Control, Product Collection Strategies, and Startup/Shutdown Operations for the Production of Clinical Trial Materials and Commercial Products. J. Pharm. Sci 106, 930–943. doi: 10.1016/j.xphs.2016.12.014. [DOI] [PubMed] [Google Scholar]
- Anand R, Andrews MK, Bunzel M, DiMatteo S, Fraser B, Wenzel R, O’Hanlon T, 2019. A New Digitalization Strategy Framework to Advance Reliability and Asset Management. Uptime Mag. [Google Scholar]
- Andrews MK, Nahas S, 2018. The Value of Runtime Knowledge Management: Stop Business Insanity [WWW Document]. URL http://www.appliedmaterials.com/files/Applied_The_Value_of_Knowledge_Management_White_Paper.pdf (accessed 8.1.19).
- CommitteeE55,, A.S.T.M., 2014. ASTM E2968–14: Standard Guide for Application of Continuous Processing in the Pharmaceutical Industry. Annual Book of ASTM Standards. 10.1520/E2968. [DOI] [Google Scholar]
- Bagajewicz MJ, 2010. Data Reconciliation Practical Issues Smart Process Plants : Software and Hardware Solutions for Accurate Data and Profitable Operations. McGraw-Hill, New York, pp. 195–224. [Google Scholar]
- Baur C, Wee D, 2015. Manufacturing’s next act [WWW Document]. McKinsey Co. URL https://www.mckinsey.com/business-functions/operations/our-insights/manufacturings-next-act (accessed 3.1.19). [Google Scholar]
- Bengtsson M, Lundström G, 2018. On the importance of combining “the new” with “the old” – One important prerequisite for maintenance in Industry 4.0. Procedia Manuf. 25, 118–125. 10.1016/j.promfg.2018.06.065. [DOI] [Google Scholar]
- BioPhorum Operations Group, 2019. Smart Maintenance: Digital Evolution for Biopharma Manufacturing. Sheffield, United Kingtom. [Google Scholar]
- Brodbeck P, 2018. Flexible continuous manufacturing—based on S88 batch standards and object-oriented design, in. Computer Aided Chemical Engineering. Elsevier B.V, 489–515. 10.1016/B978-0-444-63963-9.00020-8. [DOI] [Google Scholar]
- Bundenthal M, 2017. Optimizing yields on modern tablet presses. Pharm. Technol 41 (66–68), 71. [Google Scholar]
- Cao H, Mushnoori S, Higgins B, Kollipara C, Fermier A, Hausner D, Jha S, Singh R, Ierapetritou M, Ramachandran R, 2018. A Systematic Framework for Data Management and Integration in a Continuous Pharmaceutical Manufacturing Processing Line. Processes 6, 53. 10.3390/pr6050053. [DOI] [Google Scholar]
- CDER US FDA, 2019. Quality Considerations for Continuous Manufacturing Guidance for Industry (Draft Guidance).
- Center for Chemical Process Safety, 2007. Guidelines for Risk Based Process Safety. John Wiley & Sons Inc, Hoboken, NJ, USA. 10.1002/9780470925119. [DOI] [Google Scholar]
- Davis J, Edgar T, Porter J, Bernaden J, Sarli M, 2012. Smart manufacturing, manufacturing intelligence and demand-dynamic performance. Comput. Chem. Eng 47, 145–156. 10.1016/j.compchemeng.2012.06.037. [DOI] [Google Scholar]
- De Felice F, Petrillo A, Autorino C, 2014. Maintenance strategies and innovative approaches in the pharmaceutical industry: An integrated management system (ims). Int. J. Eng. Bus. Manag 6, 1–9. 10.5772/59023. [DOI] [Google Scholar]
- FDA, 2006. Guidance for Industry. Q9 Quality Risk Management, Food and Drug Administration. [Google Scholar]
- FDA, 2004. Guidance for Industry PAT: A Framework for Innovative Pharmaceutical Development, Manufacuring, and Quality Assurance. FDA; Off. Doc. 16. doi:https://www.fda.gov/CDER/guidance/6419fnl.pdf. [Google Scholar]
- Friedli T, Goetzfried M, Basu P, 2010. Analysis of the implementation of total productive maintenance, total quality management, and just-in-time in pharmaceutical manufacturing. J. Pharm. Innov 5, 181–192. 10.1007/s12247-010-9095-x. [DOI] [Google Scholar]
- Ganesh S, Hausner D, 2019. OSIsoft PI System for Academic Research in Continuous Pharmaceutical Manufacturing [WWW Document]. 2019 - PI World - San Fr. - Acad. Symp. URL https://www.osisoft.com/Presentations/OSIsoft-PI-System-for-Academic-Research-in-Continuous-Pharmaceutical-Manufacturing-Rutgers-Purduex/ (accessed 4.15.19).
- Ganesh S, Moreno M, Liu J, Gonzalez M, Nagy Z, Reklaitis G, 2018. Sensor Network for Continuous Tablet Manufacturing, in: Proceedings of the 13th International Symposium on Process Systems Engineering PSE 2018. pp. 2149–2154. doi: 10.1016/B978-0-444-64241-7.50353-0. [DOI] [PMC free article] [PubMed] [Google Scholar]
- Ganesh S, Troscinski R, Schmall N, Lim J, Nagy Z, Reklaitis G, 2017. Application of x-ray sensors for in-line and non-invasive monitoring of mass flow rate in continuous tablet manufacturing. J. Pharm. Sci 9, 1–13. 10.1016/j.xphs.2017.08.019. [DOI] [PubMed] [Google Scholar]
- García-Muñoz S, Slade D, Butterbaugh A, Leavesley I, Manley LF, Bermingham S, Slade D, Bermingham S, 2017. A flowsheet model for the development of a continuous process for pharmaceutical tablets: An industrial perspective. AIChE J. 61, 1–15. 10.1002/aic.15967. [DOI] [Google Scholar]
- Giridhar A, Gupta A, Louvier M, Joglekar G, Nagy ZK, Reklaitis GV, 2014. Intelligent Process Management for Continuous Operations in Pharmaceutical Manufacturing. Computer Aided Chemical Engineering. 391–396. 10.1016/B978-0-444-63456-6.50066-1. [DOI] [Google Scholar]
- Gupta A, Giridhar A, Venkatasubramanian V, Reklaitis GV, 2013. Intelligent alarm management applied to continuous pharmaceutical tablet manufacturing: An integrated approach. Ind. Eng. Chem. Res 52, 12357–12368. 10.1021/ie3035042. [DOI] [Google Scholar]
- Hamdan IM, Reklaitis GV, Venkatasubramanian V, 2012. Real-time exceptional events management for a partial continuous dry granulation line. J. Pharm. Innov 7, 95–118. 10.1007/s12247-012-9138-6. [DOI] [Google Scholar]
- Hamdan IM, Reklaitis GV, Venkatasubramanian V, 2010. Exceptional events management applied to roller compaction of pharmaceutical powders. J. Pharm. Innov 5, 147–160. 10.1007/s12247-010-9087-x. [DOI] [Google Scholar]
- Herwig C, Wölbeling C, Zimmer T, 2017. A Holistic Approach to Production Control From Industry 4.0 to Pharma 4.0. Pharm. Eng, 44–49. [Google Scholar]
- Ierapetritou M, Muzzio F, Reklaitis G, 2016. Perspectives on the continuous manufacturing of powder-based pharmaceutical processes. AIChE J. 62, 1846–1862. 10.1002/aic.15210. [DOI] [Google Scholar]
- ISA, 2016. ANSI/ISA-18.2-2016, Management of Alarm Systems for the Process Industries. Research Triangle Park. [Google Scholar]
- ISA, 2015a. ISA-TR108.1-2015, Intelligent Device Management Part 1: Concepts and Terminology. Research Triangle Park. [Google Scholar]
- ISA, 2015b. ANSI/ISA-101.01-2015, Human Machine Interfaces for Process Automation Systems. Research Triangle Park. [Google Scholar]
- ISA, 2013. ISA-TR106.00.01-2013, Procedure Automation for Continuous Process Operations - Models and Terminology. Research Triangle Park. [Google Scholar]
- ISA, 2012. ANSI/ISA-84.91.01-2012, Identification and Mechanical Integrity of Safety Controls, Alarms, and Interlocks in the Process Industry. Research Triangle Park. [Google Scholar]
- ISA, 2010a. ANSI/ISA-95.00.01-2010 Enterprise-Control System Integration - Part 1: Models and Terminology. Research Triangle Park. [Google Scholar]
- ISA, 2010b. ANSI/ISA-88.00.01-2010, Batch Control Part 1: Models and Terminology. Research Triangle Park. [Google Scholar]
- ISA, 2007. ANSI/ISA-TR99.00.01-2007 Security Technologies for Industrial Automation and Control Systems. Research Triangle Park. [Google Scholar]
- Isaksson AJ, Harjunkoski I, Sand G, 2018. The impact of digitalization on the future of control and operations. Comput. Chem. Eng 114, 122–129. 10.1016/j.compchemeng.2017.10.037. [DOI] [Google Scholar]
- Joglekar G, Reklaitis GV, Giridhar A, Mockus L, 2017. Knowledge Management in Support of QbD, in: Comprehensive Quality by Design for Pharmaceutical Product Development and Manufacture. John Wiley & Sons, Inc., Hoboken, NJ, USA, pp. 361–386. doi: 10.1002/9781119356189.ch14. [DOI] [Google Scholar]
- Kothamasu Ranganath, Huang SH, Verduin William H., Kothamasu R, Huang -SH, Verduin WH, 2006. System health monitoring and prognostics -a review of current paradigms and practices Maintenance strategies and motivations for health monitoring. Int. J. Adv. Manuf. Technol 28, 1012–1024. 10.1007/978-1-84882-472-0_14. [DOI] [Google Scholar]
- Laske S, Paudel A, Scheibelhofer O, Sacher S, Hoermann T, Khinast J, Kelly A, Rantannen J, Korhonen O, Stauffer F, De Leersnyder F, De Beer T, Mantanus J, Chavez PF, Thoorens B, Ghiotti P, Schubert M, Tajarobi P, Haeffler G, Lakio S, Fransson M, Sparen A, Abrahmsen-Alami S, Folestad S, Funke A, Backx I, Kavsek B, Kjell F, Michaelis M, Page T, Palmer J, Schaepman A, Sekulic S, Hammond S, Braun B, Colegrove B, 2017. A Review of PAT Strategies in Secondary Solid Oral Dosage Manufacturing of Small Molecules. J. Pharm. Sci 106, 667–712. doi: 10.1016/j.xphs.2016.11.011. [DOI] [PubMed] [Google Scholar]
- Liu J, Su Q, Moreno M, Laird C, Nagy Z, Reklaitis G, 2018. Robust State Estimation of Feeding-Blending Systems in Continuous Pharmaceutical Manufacturing. Chem. Eng. Res. Des 134, 140–153. 10.1016/j.cherd.2018.03.017. [DOI] [PMC free article] [PubMed] [Google Scholar]
- Lopez F, Shao Y, Mao ZM, Moyne J, Barton K, Tilbury D, 2018. A software-defined framework for the integrated management of smart manufacturing systems. Manuf. Lett 15, 18–21. 10.1016/j.mfglet.2017.12.015. [DOI] [Google Scholar]
- Márquez AC, 2007. The Maintenance Management Framework: Models and Methods for Complex Systems Maintenance, Springer Series in Reliability Engineering. Springer London, London. doi: 10.1007/978-1-84628-821-0. [DOI] [Google Scholar]
- Miyano T, Nakagawa H, Watanabe T, Minami H, Sugiyama H, 2015. Operationalizing Maintenance of Calibration Models Based on Near-Infrared Spectroscopy by Knowledge Integration. J. Pharm. Innov 10, 287–301. 10.1007/s12247-015-9226-5. [DOI] [Google Scholar]
- Montgomery D, 2012. Statistical Quality Control, 7th Editio. ed.
- Moreno M, Ganesh S, Shah YD, Su Q, Gonzalez M, Nagy ZK, Reklaitis GV, 2019. Sensor Network Robustness Using Model-Based Data Reconciliation for Continuous Tablet Manufacturing. J. Pharm. Sci 108, 2599–2612. 10.1016/j.xphs.2019.03.011. [DOI] [PMC free article] [PubMed] [Google Scholar]
- Moreno M, Liu J, Su Q, Leach C, Giridhar A, Yazdanpanah N, O’Connor T, Nagy ZK, Reklaitis GV, 2018. Steady-State Data Reconciliation Framework for a Direct Continuous Tableting Line. J. Pharm. Innov 10.1007/s12247-018-9354-9. [DOI] [PMC free article] [PubMed] [Google Scholar]
- Moubray J, 1999. Reliability-Centered Maintenance. Butterworth-Heinemann. [Google Scholar]
- Moyne J, Iskandar J, 2017. Big Data Analytics for Smart Manufacturing: Case Studies in Semiconductor Manufacturing. Processes 5, 39. 10.3390/pr5030039. [DOI] [Google Scholar]
- Moyne J, Ward N, Hawkins P, 2012. Leveraging Advanced Process Control (APC) technology in developing Predictive Maintenance (PdM) systems. ASMC (Advanced Semicond. Manuf. Conf. Proc, 221–226. 10.1109/ASMC.2012.6212893. [DOI] [Google Scholar]
- Narasimhan S, Jordache C, 1999. The Importance of Data Reconciliation and Gross Error Detection, in: Data Reconciliation and Gross Error Detection. Elsevier, pp. 1–31. doi: 10.1016/B978-088415255-2/50002-1. [DOI] [Google Scholar]
- Natoli Engineering Company Inc, 2019. Tool Maintenance [WWW Document]. URL https://natoli.com/about/resources/tool-maintenance/ (accessed 9.4.19).
- Office of the Assistant Secretary of Defense for Sustainment, 2008. Condition Based Maintenance Plus [WWW Document]. URL https://www.acq.osd.mil/log/MPP/cbm+ (accessed 5.25.19).
- OSIsoft LLC, 2018. A Guidebook to Implementing Maintenance (CBM) Using Real-time Data eBook. San Leandro. [Google Scholar]
- Romero-Torres S, Moyne J, Kidambi M, 2017. Towards Pharma 4. 0; Leveraging Lessons and Innovation from Silicon Valley Advanced Manufacturing Practices in the Semiconductor Industry. Am. Pharm. Rev, 1–9. [Google Scholar]
- Romero-Torres S, Wolfram K, Armando J, Ahmed SK, Ren J, Shi C, Hill D, Guenard R, 2018. Biopharmaceutical Process Model Evolution- Enabling Process Knowledge Continuum from an Advanced Process Control Perspective [WWW Document]. Am. Pharm. Rev URL https://www.americanpharmaceuticalreview.com/Featured-Articles/352447-Biopharmaceutical-Process-Model-Evolution-Enabling-Process-Knowledge-Continuum-from-an-Advanced-Process-Control-Perspective/ (accessed 6.24.19). [Google Scholar]
- SEBoK, 2019a. System Integration [WWW Document]. SEBoK. URL https://www.sebokwiki.org/w/index.php?title=System_Integration&oldid=57419 (accessed 11.16.19). [Google Scholar]
- SEBoK, 2019b. System Architecture [WWW Document]. SEBoK. URL https://www.sebokwiki.org/wiki/System_Architecture (accessed 11.16.19). [Google Scholar]
- Shin JH, Jun HB, 2015. On condition based maintenance policy. J. Comput. Des. Eng 2, 119–127. 10.1016/j.jcde.2014.12.006. [DOI] [Google Scholar]
- Singh R, Sahay A, Muzzio F, Ierapetritou M, Ramachandran R, 2014. A systematic framework for onsite design and implementation of a control system in a continuous tablet manufacturing process. Comput. Chem. Eng 66, 186–200. 10.1016/j.compchemeng.2014.02.029. [DOI] [Google Scholar]
- Su Q, Bommireddy Y, Gonzalez M, Reklaitis GV, Nagy ZK, 2018. Variation and Risk Analysis in Tablet Press Control for Continuous Manufacturing of Solid Dosage via Direct Compaction. Proc. 13th Int. Symp. Process Syst. Eng. PSE 2018 2912. [DOI] [PMC free article] [PubMed] [Google Scholar]
- Su Q, Bommireddy Y, Shah Y, Ganesh S, Moreno M, Liu J, Gonzalez M, Yazdanpanah N, O’Connor T, Reklaitis GV, Nagy ZK, 2019. Data reconciliation in the Quality-by-Design (QbD) implementation of pharmaceutical continuous tablet manufacturing. Int. J. Pharm 563, 259–272. 10.1016/j.ijpharm.2019.04.003. [DOI] [PMC free article] [PubMed] [Google Scholar]
- Su Q, Ganesh S, Le Vo DB, Nukala A, Bommireddy Y, Gonzalez M, Reklaitis GV, Nagy ZK, 2019. A Quality-by-Control Approach in Pharmaceutical Continuous Manufacturing of Oral Solid Dosage via Direct Compaction, 29th European Symposium on Computer Aided Process Engineering. Elsevier Masson SAS. 10.1016/b978-0-12-818634-3.50222-8. [DOI] [PMC free article] [PubMed] [Google Scholar]
- Su Q, Ganesh S, Moreno M, Bommireddy Y, Gonzalez M, Reklaitis GV, Nagy ZK, 2019. A perspective on Quality-by-Control (QbC) in pharmaceutical continuous manufacturing. Comput. Chem. Eng 125, 216–231. 10.1016/j.compchemeng.2019.03.001. [DOI] [PMC free article] [PubMed] [Google Scholar]
- Su Q, Moreno M, Giridhar A, Reklaitis GV, Nagy ZK, 2017. A Systematic Framework for Process Control Design and Risk Analysis in Continuous Pharmaceutical Solid-Dosage Manufacturing. J. Pharm. Innov 1–20. 10.1007/s12247-017-9297-6. [DOI] [Google Scholar]
- Troup GM, Georgakis C, 2013. Process systems engineering tools in the pharmaceutical industry. Comput. Chem. Eng 51, 157–171. 10.1016/j.compchemeng.2012.06.014. [DOI] [Google Scholar]
- United States Department of Defense, 2008. Condition Based Maintenance Plus DoD Guidebook.
- Vann L, Shah N, Moyne J, 2018. Are You Running Your Equipment or is Your Equipment Running You? The Difference is Often a Matter of Predictive Maintenance, Santa Clara. [Google Scholar]
- Venkatasubramanian V, 2019. The promise of artificial intelligence in chemical engineering: Is it here, finally? AIChE J. 65, 466–478. 10.1002/aic.16489. [DOI] [Google Scholar]
- Venkatasubramanian V, 2011. Systemic failures: Challenges and opportunities in risk management in complex systems. AIChE J. 57, 2–9. 10.1002/aic.12495. [DOI] [Google Scholar]
- Venkatasubramanian V, Rengaswamy R, Kavuri SN, 2003. A review of process fault detection and diagnosis part II: Qualitative models and search strategies. Comput. Chem. Eng 27, 313–326. 10.1016/S0098-1354(02)00161-8. [DOI] [Google Scholar]
- Venkatasubramanian V, Rengaswamy R, Kavuri SN, Yin K, 2003. A review of process fault detection and diagnosis part III: Process history based methods. Comput. Chem. Eng 27, 327–346. 10.1016/S0098-1354(02)00162-X. [DOI] [Google Scholar]
- Venkatasubramanian V, Rengaswamy R, Yin K, Kavuri SN, 2003. A review of process fault detection and diagnosis part I: Quantitative model-based methods. Comput. Chem. Eng 27, 293–311. 10.1016/S0098-1354(02)00160-6. [DOI] [Google Scholar]
- Yu LX, Kopcha M, 2017. The future of pharmaceutical quality and the path to get there. Int. J. Pharm 528, 354–359. 10.1016/j.ijpharm.2017.06.039. [DOI] [PubMed] [Google Scholar]
- Yu LX, Raw A, Wu L, Capacci-Daniel C, Zhang Y, Rosencrance S, 2019. FDA’s new pharmaceutical quality initiative: Knowledge-aided assessment & structured applications. Int. J. Pharm. X 1. 10.1016/j.ijpx.2019.100010. [DOI] [PMC free article] [PubMed] [Google Scholar]


