Abstract
The shift from batch to continuous manufacturing, which is occurring in the pharmaceutical manufacturing industry has implications on process safety and product quality. It is now understood that fault-tolerant process control of critical process parameters (CPPs) and critical quality attributes (CQAs) is of paramount importance to the realization of safe operations and quality products. In this study, a systematic framework for fault-tolerant process control system design, analysis, and evaluation of pharmaceutical continuous oral solid dosage manufacturing is proposed. The framework encompasses system identification, controller design and analysis (controllability, stability, resilience, etc.), hierarchical three-level control structures (model predictive control, state estimation, data reconciliation, etc.), risk mapping, assessment and planning (Risk MAP) strategies, and control performance evaluation. The key idea of the proposed framework is to identify the potential risks associated with the control system design itself, the material property variations, and other process uncertainties, under which the control strategies must be evaluated. The framework is applied to a continuous direct compaction process, specifically the feeding-blending subsystem, wherein the major source of variance in the process operation and product quality arises. It is demonstrated, using simulations and experimentally, that the process operation failures and product quality variations in the feeding-blending system can be mitigated and managed through the proposed systematic fault-tolerant process control system design and risk analysis framework.
Keywords: Resilience, Risk analysis, Continuous manufacturing, Pharmaceutics, Process control
1. Introduction
The pharmaceutical manufacturing industries in the past decade have undergone a mindset change from batch to continuous manufacturing. This shift is justified on the basis of the significant advantages, which have been identified and discussed (Ierapetritou et al., 2016; Lee et al., 2015), mostly at the conceptual level or using simulations. To rigorously establish integrated continuous manufacturing processes that will consistently produce quality products, the efforts of regulators, academia, and industry are now focused on issues of quality control and risk management, e.g., guidance of ICH Q9 Quality Risk Management and Q10 Pharmaceutical Quality System (ICH-Q9, 2006; ICH-Q10, 2007). However, the risk-based assessments of the level of process automation and control system design, which would ensure robust operation and real-time release in continuous manufacturing has not been thoroughly developed (Ierapetritou et al., 2016; Singh et al., 2012). Such assessments might include the implementations of ISA-88 Batch Control Standard, ISA-95 Enterprise-Control System Integration Standard, or the ISPE GAMP 5.0 Good Automation Manufacturing Practice.
The pharmaceutical secondary manufacturing of oral solid-dosage has been progressing rapidly toward continuous manufacturing with several drugs now approved by the US Food and Drug Administration, e.g., Vertex Orkambi in 2015 and Janssen Darunavir in 2016 (Yu, 2016). Secondary manufacturing usually involves powder and granular materials processing steps, i.e., feeding, blending, granulation, tableting, etc., characterized by fast dynamics with time constants of seconds or minutes, thus requiring faster response from the control system. There is also a limited hold-up in each unit operation and thus the buffering provided by material inventory is limited. Additionally, stream recycling or substantial back mixing in the process must be avoided in the highly-regulated pharmaceutical secondary manufacturing process due to the requirements of material tracking (Lee et al., 2015). Therefore, aggressive control responses are often required to address process disturbances, potentially posing safety threats due to dust-generation in the manufacturing process (Singh et al., 2015a). Furthermore, variability in raw materials upstream also has a rapid and direct impact on downstream processes, which affects the in-process materials and final drug product qualities, making the consistent production of quality solid dosage challenging. Hence, the process control practice and experience in other fluid-based petroleum and chemical industries may or may not be directly transferable to the pharmaceutical secondary manufacturing process. In the past few years, a range of control techniques ranging from simple proportional-integral-derivative (PID) controllers to advanced model-based control (MPC) and real-time optimization (RTO) have been tested (Singh et al., 2015b; Ramachandran et al., 2011; Singh et al., 2014), in which performance in set point tracking and disturbance rejection was mostly evaluated to finalize the control system design. However, from the quality control and risk management point of view, a resilient and fault-tolerant plant-wide process control system design is very important to the safety and success of pharmaceutical continuous manufacturing.
There are existing frameworks for fault tolerant control in other continuous manufacturing industries, which have been applied over the last three decades that can accommodate faults among system components automatically while maintaining system stability along with a desired level of overall performance (Blanke et al., 1997; Jiang and Yu, 2012). Generally, there use one of two main approaches to deal with faults. One is to respond to the failure by re-organizing the remaining system elements in real-time to carry out necessary control functions. The other is to make the system failure-proof for a certain well-defined risk/fault sets at the design stage (Jiang and Yu, 2012). However, due to the rapidly emerging pharmaceutical continuous manufacturing technology, the practical implementation of fault-tolerant control, or even the basic process control, is largely uninvestigated for pharmaceutical processes. In addition to system stability, product quality under system component failures is even more important under the ICH Q9 Quality Risk Management guidance. Hence, these features provide the motivation for a systematic framework to combine existing fault-tolerant control practice with product quality concern for process control design and risk analysis in pharmaceutical continuous manufacturing processes (Singh et al., 2014; Lakerveld et al., 2013).
This manuscript is organized as follows. First, a systematic framework for resilient fault-tolerant control design and risk analysis will be defined, followed by the introduction to a continuous feeding-blending system, used as the illustrative case study. The application of the systematic framework to the feeding-blending system will be discussed in the Results and Discussion section. Finally, concluding remarks on the application of the systematic framework will be presented.
2. Resilient fault-tolerant control design and risk analysis
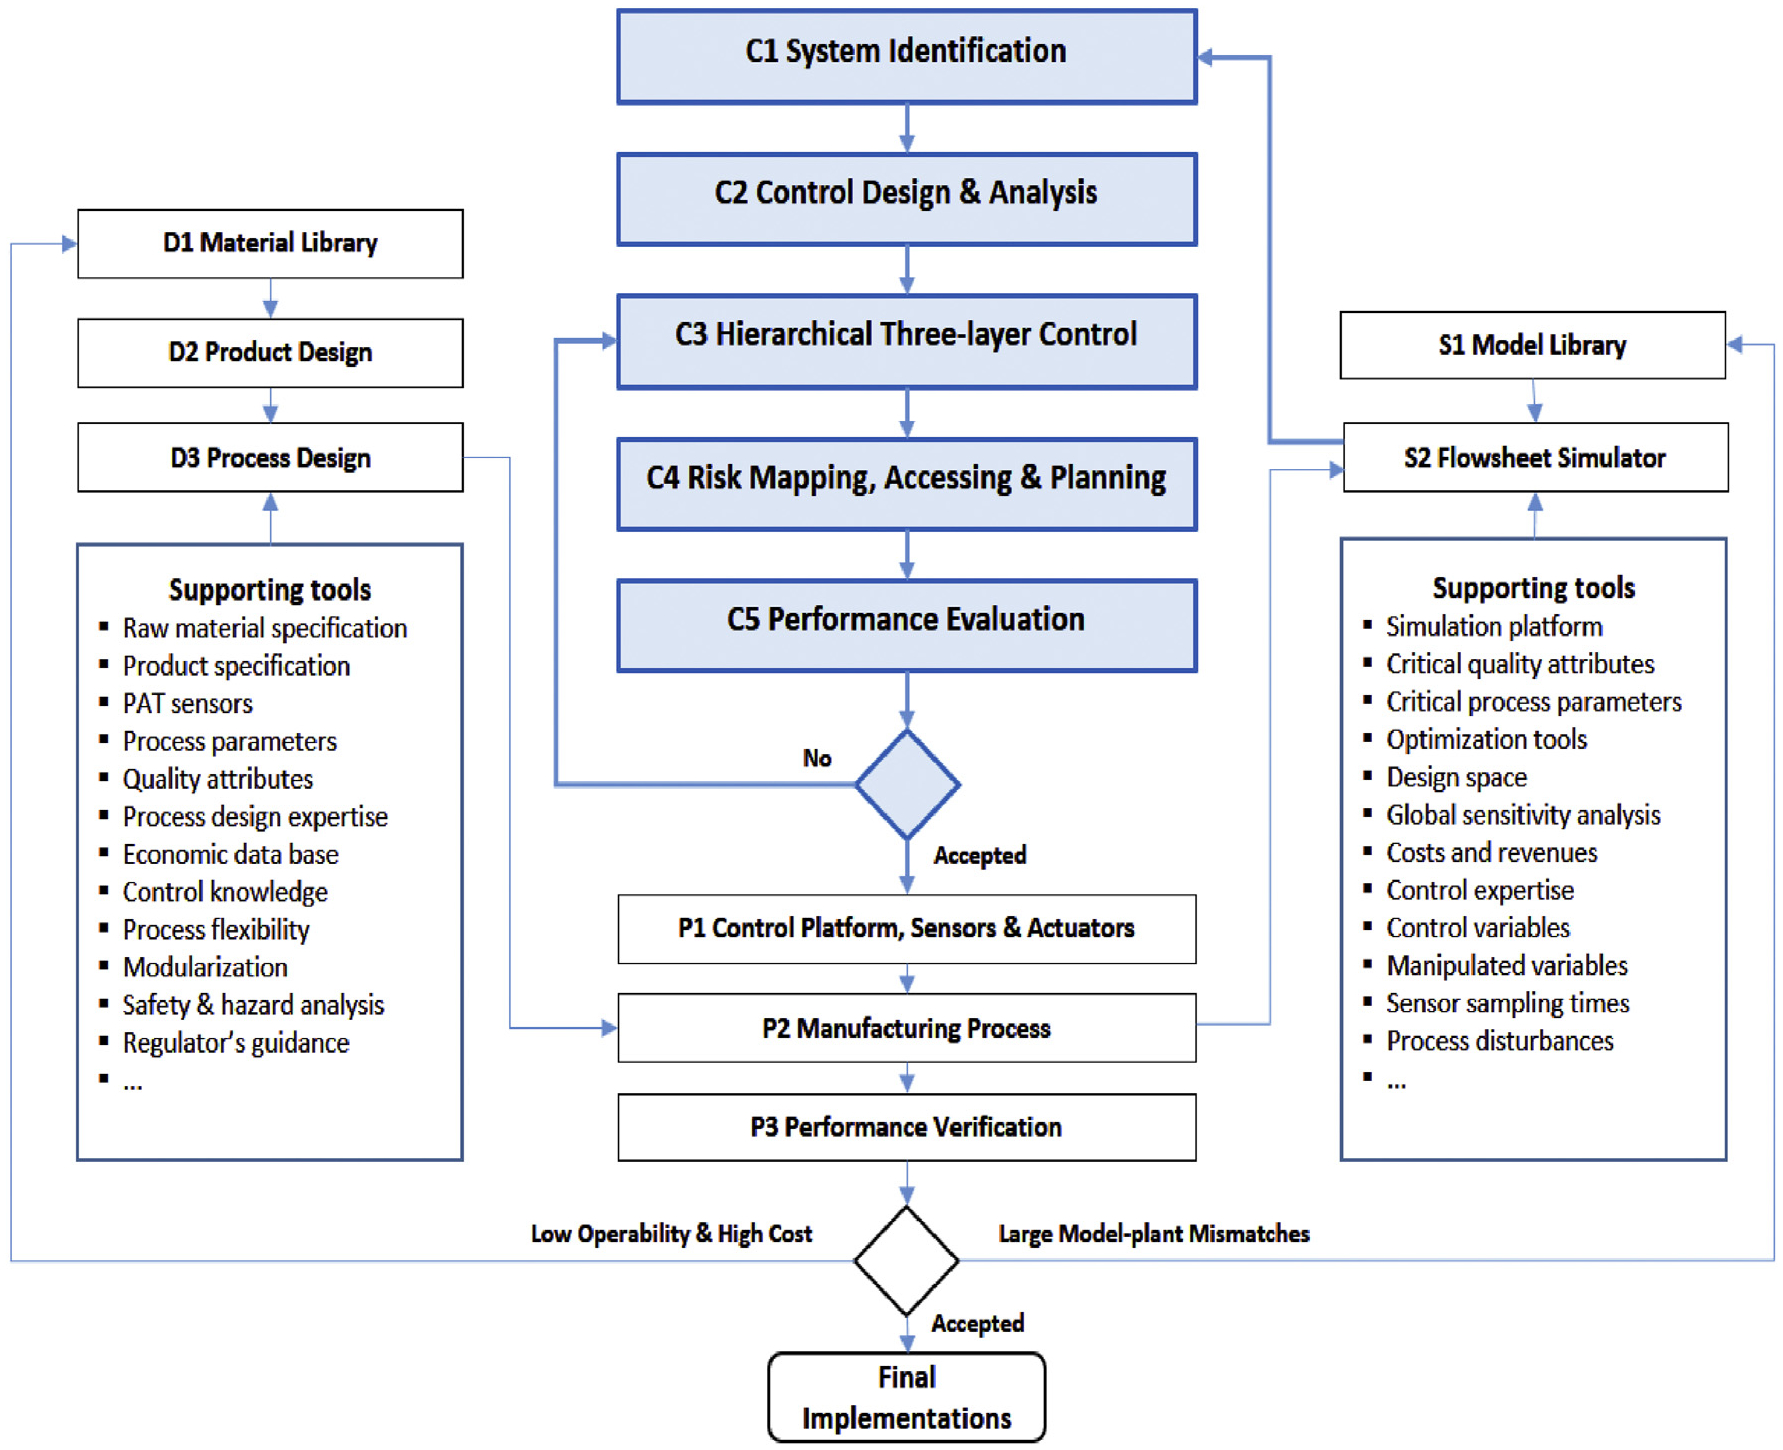
In a pharmaceutical continuous manufacturing process, the quality of the product and the intermediate streams leading to it should be monitored and controlled in real-time to maintain specified set points. The control system must respond well to the potential variations due to disturbances and risks in process variables, equipment conditions, incoming raw materials, or environmental factors over time to ensure that product quality specifications are met as the product exits the process train (Gupta et al., 2013; Yu et al., 2014; Lee et al., 2015). A systematic framework, employing appropriate process systems engineering tools, to develop and evaluate feasible control strategies will be briefly discussed in the following section (Su et al., 2017). The proposed systematic framework is general and thus can be applied to the design and analysis of process control systems for any continuous pharmaceutical process, as shown in Fig. 1.
Fig. 1.
Systematic framework for fault-tolerant process control design & risk analysis.
The framework interfaces with additional supporting knowledge and tools that facilitate the integration of software and hardware for control strategy design and implementation. After proper Product Design (D2) based on the knowledge drawn from the Material Library (D1), an appropriate formulation for the solid dosage will be generated, requiring a specific continuous manufacturing technology at the Process Design (D3) level. A pilot plant or Manufacturing Process (P2) will then be configured using modularized unit operations (feeding, blending, tableting, etc.) provided by equipment vendors with associated integration of control platform and PAT sensors in the P1 development step. Process modeling tools consisting of a Model Library (S1) and Flowsheet Simulation (S2) software play an important role in efficient plant-wide control strategy development by accelerating process design optimization and achieving desired control objectives. For example, global sensitivity analysis and System Identification (C1) based on Flowsheet Simulation (S2) can help to identify and address the potential challenges or risks in process control design, i.e., decentralization, pairing, stability, resilience, etc., through rational control design metrics in the Control Design & Analysis (C2), as shown in Fig. 2. System transfer function matrix G(s) can be first identified with the process input and output variables, followed by the three major steps of (1) selection of input/output variables to be included in the control design from all available critical process parameters (CPPs) and critical quality attributes (CQAs) based on condition number (CN) or Morari’s resilience index (MRI), etc., (2) pairing and interaction analysis of the selected input/output variables using control metrics such as relative gain array (RGA) or dynamic interaction measure (DIM), (3) closed-loop control system evaluation using dynamic flowsheet simulations, etc.
Fig. 2.
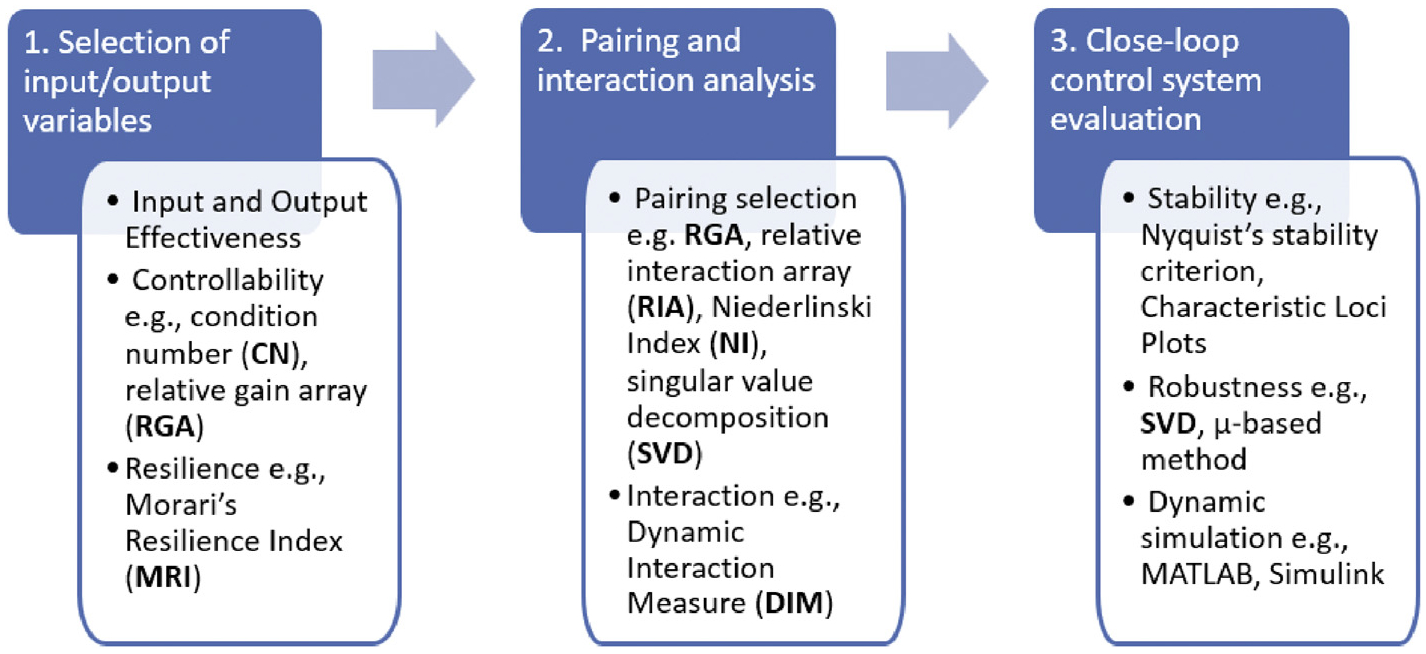
Three-step procedure for control design and interaction analysis.
A hierarchical three-level process control design (C3) and risk analysis (C4) must be followed with rigorous performance evaluation (C5), as shown in Figs. 3 and 4. Specifically, the hierarchical control structure is focused more on the implementation with the levels classified according to the scale of their control objectives, the process understanding needed and the potential capabilities in handling process disturbances and risks. For example, in a typical continuous direct compaction process, the Level 0 control includes single/multiple-loop single input single output (SISO) control, which is often implemented via a programmable logic control (PLC) panel built-into the equipment. Algorithms of simple feedback proportional, integral and derivative (PID) control, feedforward ratio control, or the advanced proprietary MPC control in case of highly nonlinear process dynamics can be implemented within the PLC of the equipment. This level of control is often designed and provided by the equipment vendor to control single/multiple critical process parameters, hence maintaining the nominal operating conditions of that equipment. The level 1 control also involves single or multiple SISO controllers. However, in most cases these loops rely on the use of PAT tools to measure and directly control CQAs and may encompass multiple unit operations. These control loops are commonly executed via supervisory control and data acquisition (SCADA) systems, e.g., the commercial OPC servers of DCS systems. An OPC server retrieves data from, or sends commands to all unit operation equipment or sensor in the field. Hence, the Level 1 control supervises the Level 0 control typically using cascaded loops with the aim of achieving desired set points for CQAs, which are measured in situ by PAT sensors. Level 1 control systems often span across unit operations and are designed using efficient feedback/feedforward control algorithms to reduce the impact of disturbance that otherwise may propagate downstream. In light of the Quality by Design (QbD) guidance, the distinguishing feature of the more advanced control approaches applied at Level 2 is the use of mathematical model/data-driven models for understanding/prediction of the effects of disturbances and changes in the CPPs on the CQAs, either measured or unmeasured. Level 2 typically employs a series of advanced process control techniques to manage multiple functions, such as plant monitoring, quality control, real-time optimization (RTO) and data reconciliation (DR) among others. Level 2 control approaches are often implemented using an independent software package that links through OPC servers to communicate with and supervise Level 1 or Level 0 controls.
Fig. 3.
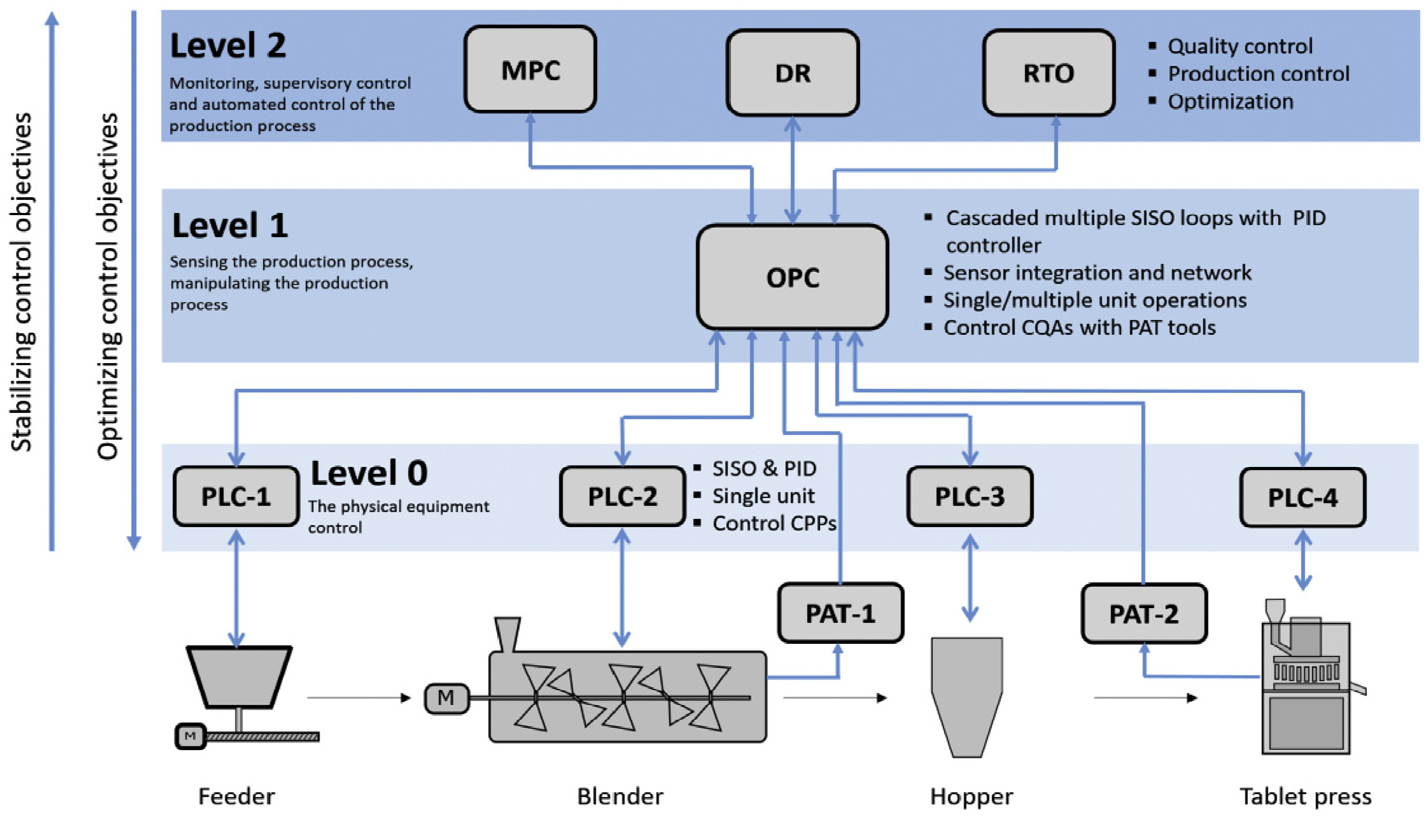
General three-level classification of control approaches.
Fig. 4.
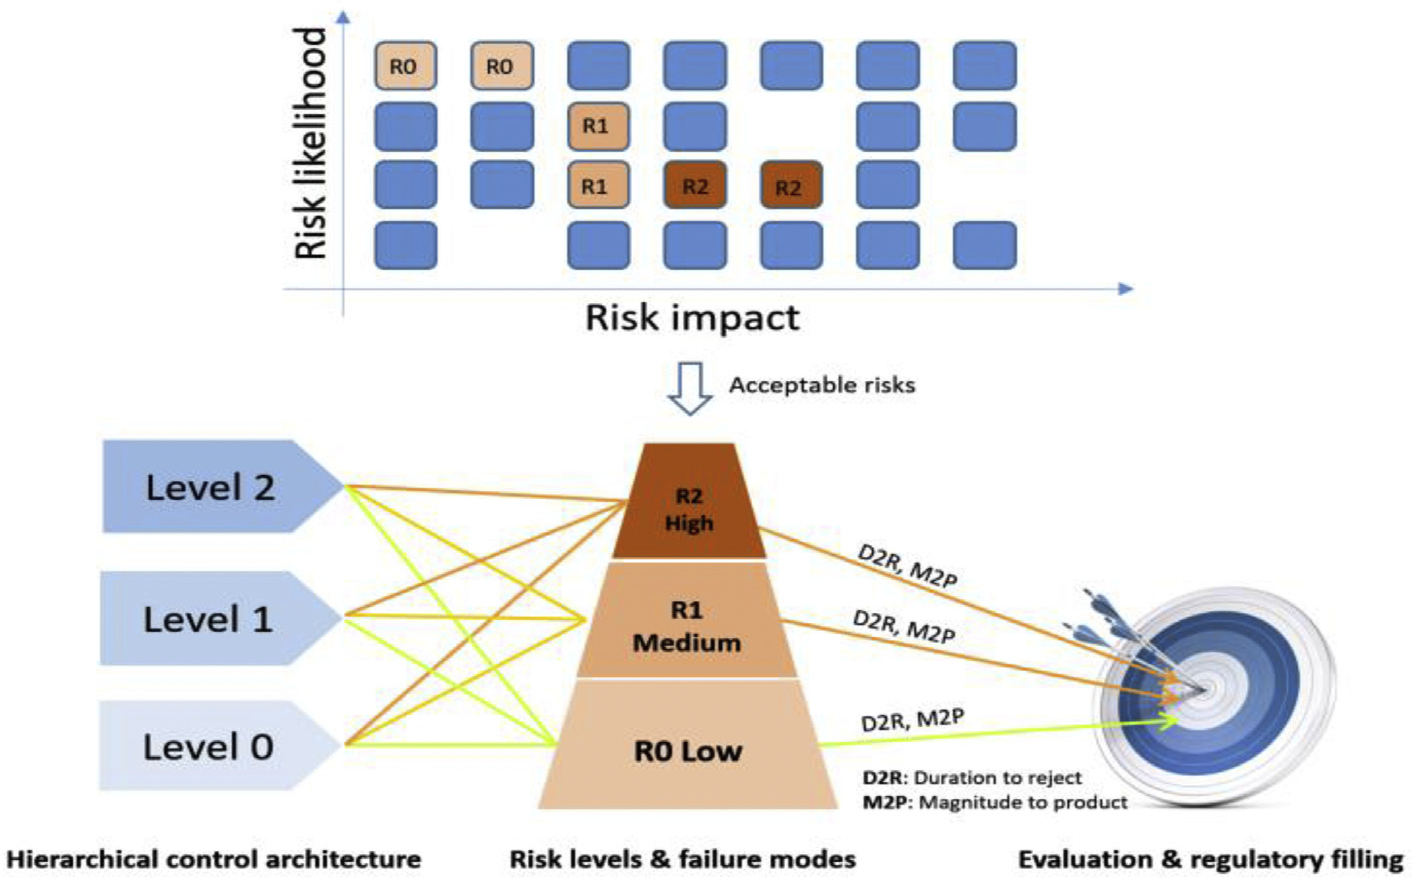
Framework for risk-based feedback control evaluation.
A risk map for the manufacturing process can be presented in the form of a matrix which characterizes the likelihood that a risk event will occur and describes its impact on production. Only the nominal risks that are acceptable to the continuous manufacturing are investigated. An acceptable risk is a risk that is understood and tolerated usually because the cost or difficulty of implementing an effective countermeasure exceeds the expected impact of the risk event on process operations. For instance, reduced flowability of powders may occur due to increased humidity in the environment during the rainy seasons of the year and this could have an adverse effect on the mixing uniformity of the API and excipient blend. However, it might be too costly to monitor moisture content in feed materials and to add a unit operation for reducing the water content to ensure specified flowability measures. The acceptable risk scenarios identified from the risk mapping, are further classified into three categories according to their frequency and severity: R0 low risk, R1 medium risk, and R2 high risk. Iterations between steps C3 to C5 will continue until a controller design, which meets real-time release requirements is established. It is expected that by implementing an active process control strategy at different levels using the risk assessment framework, these acceptable risks can be further evaluated and accommodated.
The resulting control design will then be implemented on the Manufacturing Process (P2) and verified experimentally in step P3. Continuous improvements in the manufacturing process (P2) will be pursued either by improving the model prediction accuracy or by enhancing the product formulation and process designs (D1 & D2).
3. The continuous feeding-blending system
Continuous blending is the first step in continuous solid-dosage manufacturing, wherein API content and its uniformity in the powder blend are the two important CQAs that must be strictly controlled in this subsystem. In this study, the proposed systematic framework was applied to a continuous feeding-blending system (Su et al., 2017) consisting of two Schenck AccuRate PureFeed® AP-300 loss-in-weight feeders that are capable of achieving and maintaining specified feed rates by measuring and using the changes in remaining powder weight in the combined hopper and feeder unit. This is achieved through an imbedded Level 0 PLC control system. The feeders continuously feed the API, Acetaminophen (APAP), and the excipient, Avicel Micro-crystalline Cellulose PH-200 (MCC 200), into a Gericke GCM-250 continuous blender, wherein the two components are mixed. The nominal operating conditions (NOC) consist of API flow of 1.0 kg/h, and excipient flow of 9.0 kg/h, and the blender rotation speed of 200 rpm. The API mass fraction was measured in situ using a Near Infrared spectrometer (Control Development, Inc.) at the exit of the blender (Austin et al., 2014; Vanarase et al., 2010). The content uniformity was statistically estimated in the form of relative standard deviation (RSD) using mean and variance of the API mass fraction measurements within a time window (Zhao et al., 2013). The powder flow is measured using an X-ray based mass flow meter (SETXvue XP-300, Enurga, Inc.) (Ganesh et al., 2017). These on-line sensors are integrated into the process and their process variable values were transmitted to the Emerson DeltaV system. An OPC DA protocol through LinkMaster and KepServer packages was also established to transmit real-time process data from Emerson DeltaV OPC server to MATLAB, where the data can be accessed by the Level 2 in-house developed supervisory control functions, e.g., data reconciliation, real-time optimization (Liu et al., 2018), as shown in Fig. 3.
4. Results and discussion
4.1. Control design and interaction analysis
A flowsheet model was developed for the feeding-blending system in SIMULINK, as shown in Fig. 5. The two loss-in-weight feeders were modeled using the first-order plus-time-delay (FOPTD) transfer functions and were both controlled in Level 0 using proportional-integral-derivative (PID) controllers to adjust the screw rotation speed. The PID gains for Level 0 control were automatically tuned with SIMULINK control design. The continuous blender was modeled with a two-dimensional compartmental model, with fluxes estimated for each component in forward, backward, and radial directions (Portillo et al., 2008). The blender rotation speed was also controlled at Level 0 by manipulating the motor current. The other process variables for Level 1 and 2 control designs are given in Table 1.
Fig. 5.
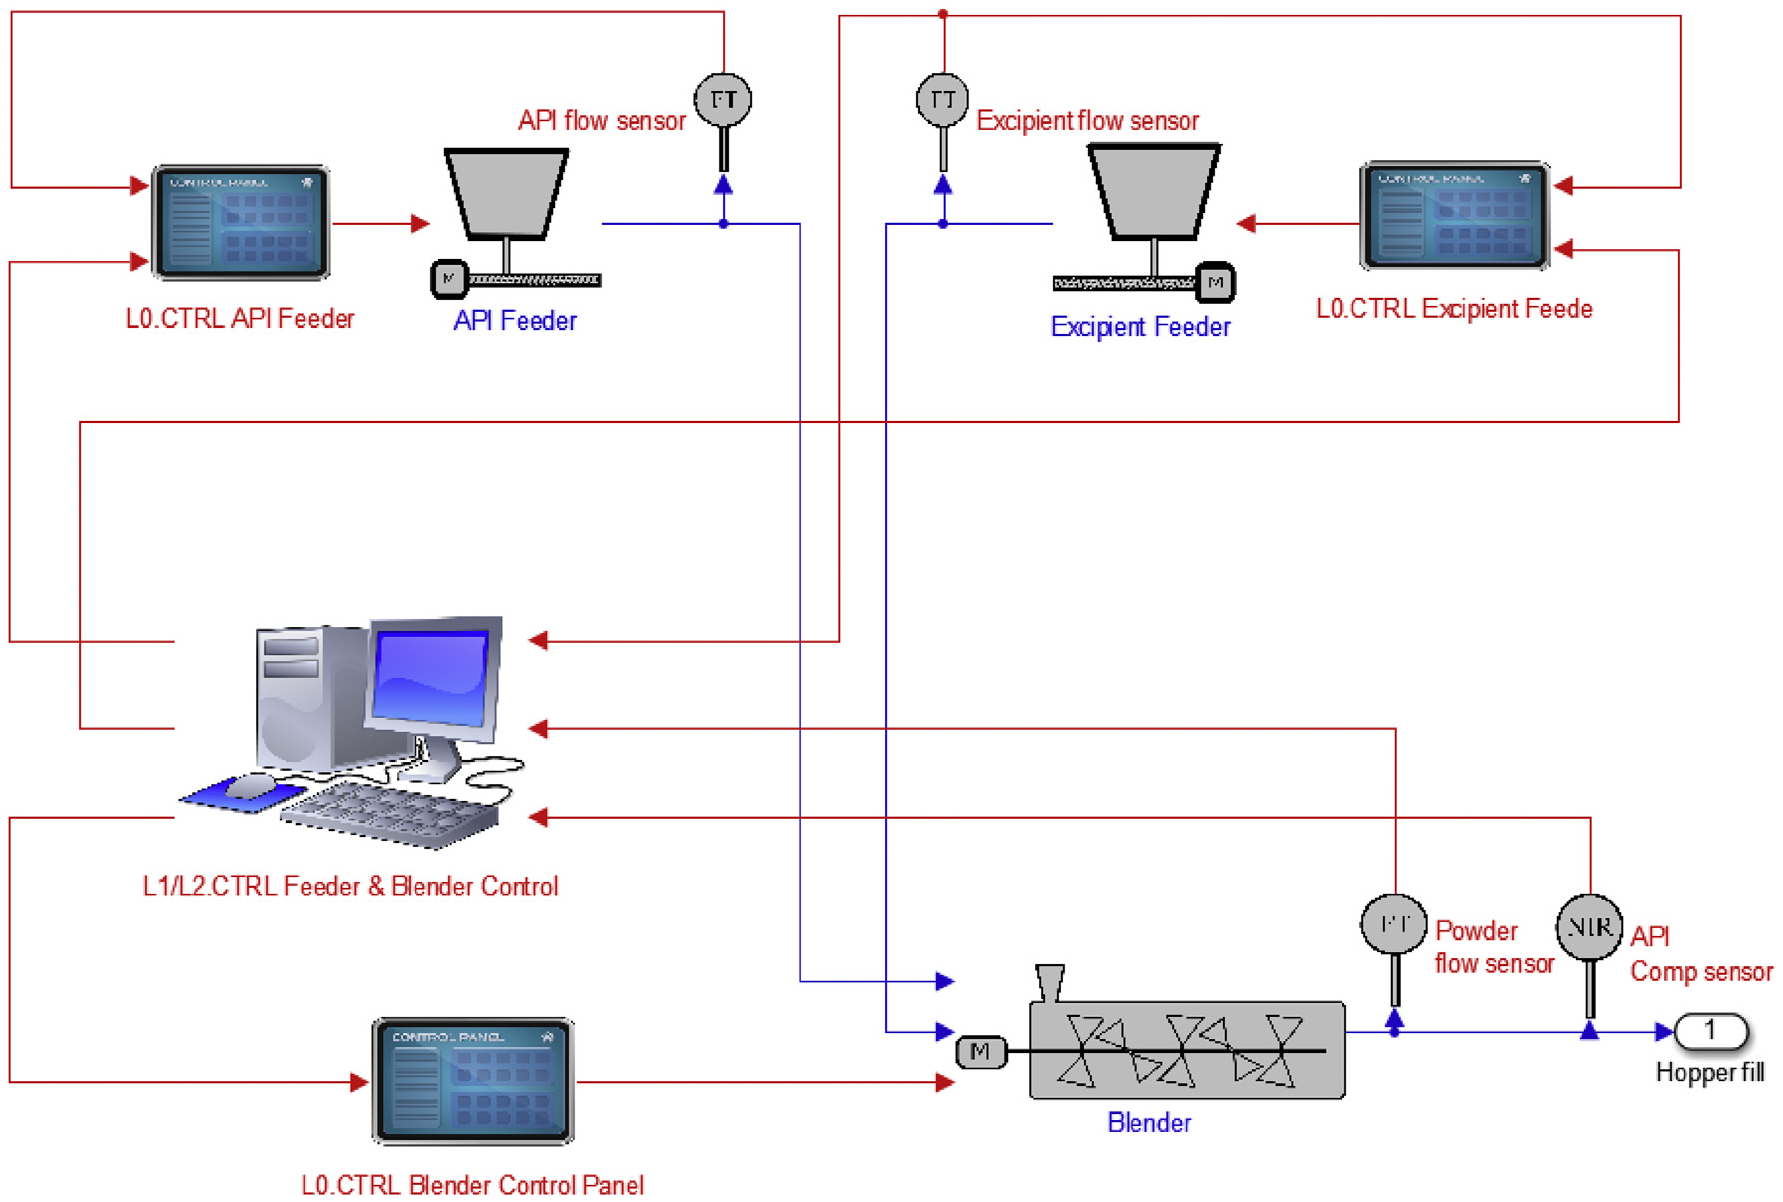
SIMULINK flowsheet model of the feeding-blending system.
Table 1.
The feeding-blending control system.
| Unit operation | Process output (y) | Process input (u) | Control Level | Controller type |
|---|---|---|---|---|
| API feeder | API flowrate | Screw rotation speed | L0 | PID |
| Exp. feeder | Exp. flowrate | Screw rotation speed | L0 | PID |
| Blender | API composition | API flowrate | L1/2 | PID, Ratio, MPC |
| Powder flowrate | Excipient flowrate | L1/2 | PID, MPC | |
| API mixing RSD | Rotation speed | L1/2 | PID, MPC | |
| Rotation speed | Motor current | L0 | PID |
For system identification, random step changes to the process input (u) were introduced in the SIMULINK flowsheet model to collect the process dynamic data. A system transfer function matrix G was then identified using the MATLAB system identification toolbox in the form of a state-space model. With the system transfer function matrix G, control design and analysis metrics were then applied, as mentioned in Fig. 2.
The condition number of 3.2945 (< 25) and Morari’s Resilience Index of 0.4372 show that the feeding-blending system was controllable and stable at the current nominal operating condition even with a decentralized SISO control loops at Level 1. Furthermore, the Niederlinski Index of 1.10 (> 0), the relative gain array (RGA), and the relative interaction analysis (RIA) pairing metrics all indicate that a stable design was achieved using a diagonal pairing under which the API composition was controlled by manipulating the API feeding flowrate, the blender powder flowrate by the excipient feeding flowrate, and the API mixing RSD by the blender rotation speed, as shown below.
| (1) |
| (2) |
For the chosen diagonal pairing at Level 1 control, the dynamic interaction measure (DIM) of 40.50 > 15 and the diagonal DIM of 60.25 > 15 both suggested that compensation was needed to reduce the interaction, and the μ interaction measure of 2.667 > 1 also indicated that the decentralized controllers at Level 1 may not be stable in closed loop. Furthermore, the performance interaction measure (PIM) of 2.00 suggested that there was considerable performance interaction in the system. To address these features, a Level 1 design in which the decentralized SISO PID control loops were compensated by a feedforward ratio controller was implemented. The Level 2 design with the identified system state-space model used the following MPC algorithm, wherein optimal control actions were calculated at the kth sampling time (Su et al., 2016).
| (3) |
| (4) |
| (5) |
| (6) |
where Y, Yd, and ΔU are the matrices of the controlled process variables y, desired set points for y, and the change in the input variables u, respectively. A sampling time Δt of 4 s was also used, which was the same as the one used in collecting the process data for system identification. Wp and Wu are the weight matrices for the controlled variables and the change in input variables to ensure smooth control actions, respectively; np and nu are the prediction and control horizons, respectively. The three level control designs are illustrated in Fig. 6.
Fig. 6.
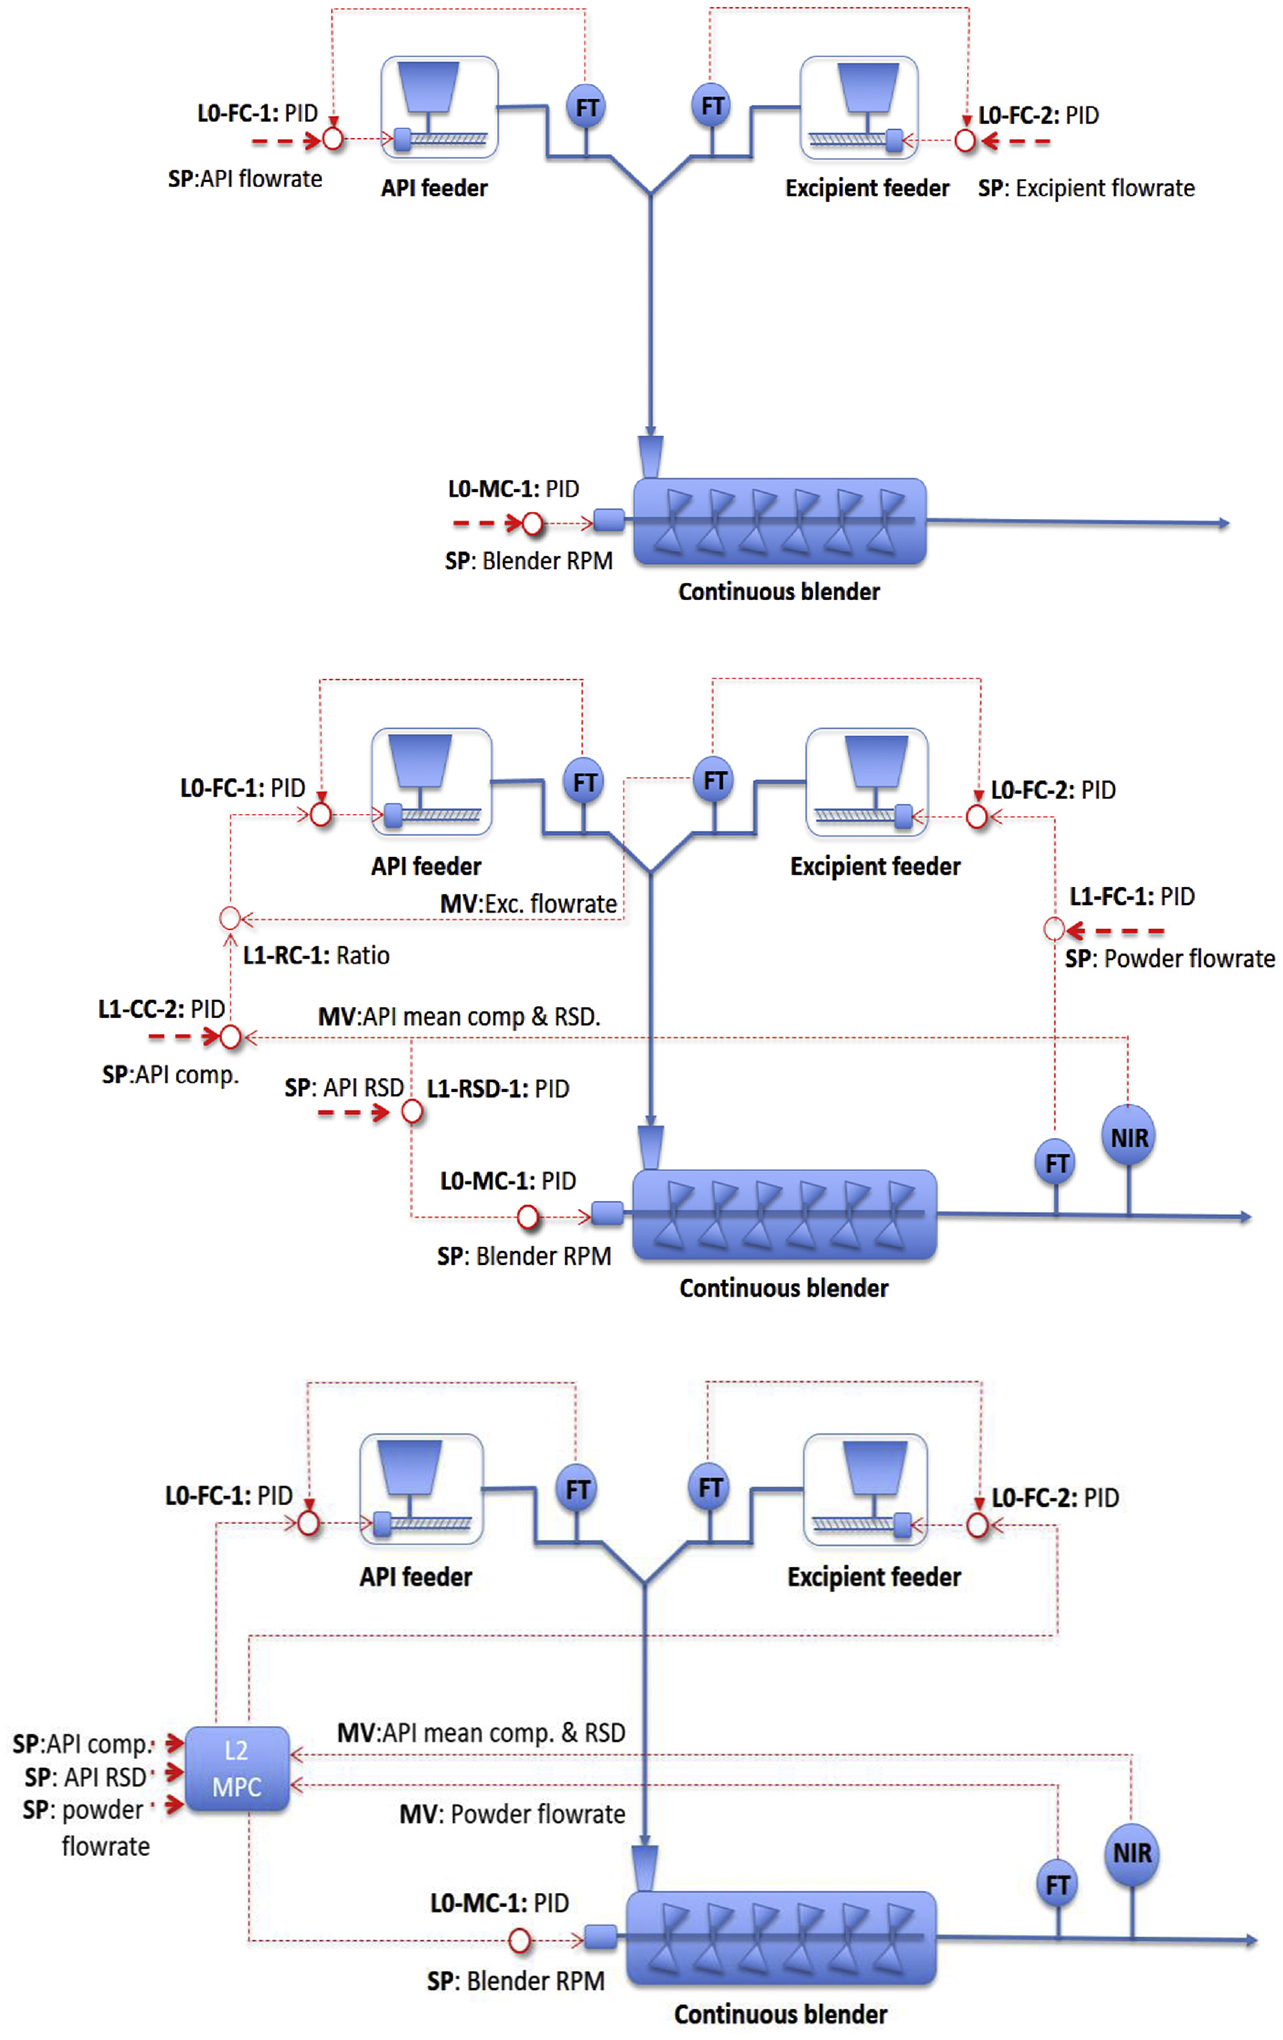
Level 0 (top), Level 1 (center), and Level 2 (bottom) control system designs for the feeding-blending system.
4.2. Control performance evaluation
Three risk scenarios arising from common cause errors in the feeding-blending system were identified as acceptable risks according to the proposed risk scoring scheme for the real-time release strategy in pharmaceutical continuous manufacturing (Potter, 2009), as shown in Table 2. They were considered in this study for evaluating the performance, e.g., in controllability, of the aforementioned three control designs.
Table 2.
Common cause errors risk scoring for the real-time release strategy in continuous manufacturing.
| Rate | Severity | Probability | Controllability | |||
|---|---|---|---|---|---|---|
| 1 | No effect | None | < 1 occurrence during the continuous production in 5 years (e.g., control instrument failure) | Very rare | All the applicable measurements & controls are in place | Always under control |
| 3 | No patient effect Process performance decreasing (e.g., divert of non-conforming product) | Low | 1 occurrence during the continuous production in 1–2 years (e.g., calibration errors) | Rare | Most of the applicable measurements & controls are in place | High credibility of under control |
| 5 | No patient effect Process performance decreasing (e.g., large amount of non-conforming product, process shut-down) | Medium | < 1 occurrence during a single continuous production campaign (e.g., variance in raw material properties) | Sometimes | Some of the applicable measurement & controls are in place | Moderate credibility of under control |
| 7 | Potential patient effect (e.g., large variance in critical quality attributes) | High | > 1 occurrence during a single continuous production campaign (e.g., raw material reloading) | Frequent/No information | Few of the applicable measurements & controls are in place | Remote credibility of under control |
| 9 | Significant patient effect (e.g., large variance in target product quality profile, loss of clinical performance) | Very high | At any time during the continuous operation (e.g., machinery vibration) | High frequent | None of the applicable measurements & controls are in place | No control |
First, when the loss-in-weight feeder hopper was under reloading (Zhao et al., 2013), a short period of disturbance in feeding can arise, which was considered to be a R0 low risk, viz., a detectable disturbance. Herein, a R0 risk scenario consisting of a pulse disturbance to both API and excipient feeders was imposed on the feeding-blending system from the simulation time of 60 s–90 s as shown in Fig. 7, during which the API feeding flowrate was reduced by 15% and the excipient flowrate was increased by 15%. Secondly, the vibrations in the feeder produced by the screw rotation could considerably disturb the load cell measurement, which may lead to a calibration error in the feed flowrate. This was regarded as a R1 medium risk in this study. A risk scenario of R1 was assumed to occur with the feeders from simulation time of 500–1500 s, during which time measurement errors of up to −25% and 25% were introduced to the API and excipient feeders, respectively. The third risk scenario, a higher R2 risk, assumed that under the occurrence of calibration errors of R1, the API component also suffered a reduced mixing uniformity in the blender due to, perhaps powder cohesion, and the flux flow in the radial direction in the blender model was decreased by 8.0% from the simulation time of 1000–1500 s in Fig. 7. In addition, during the flowsheet simulation, random noises were added to the API composition and blender powder flow variables to represent the sensor noise in the process.
Fig. 7.
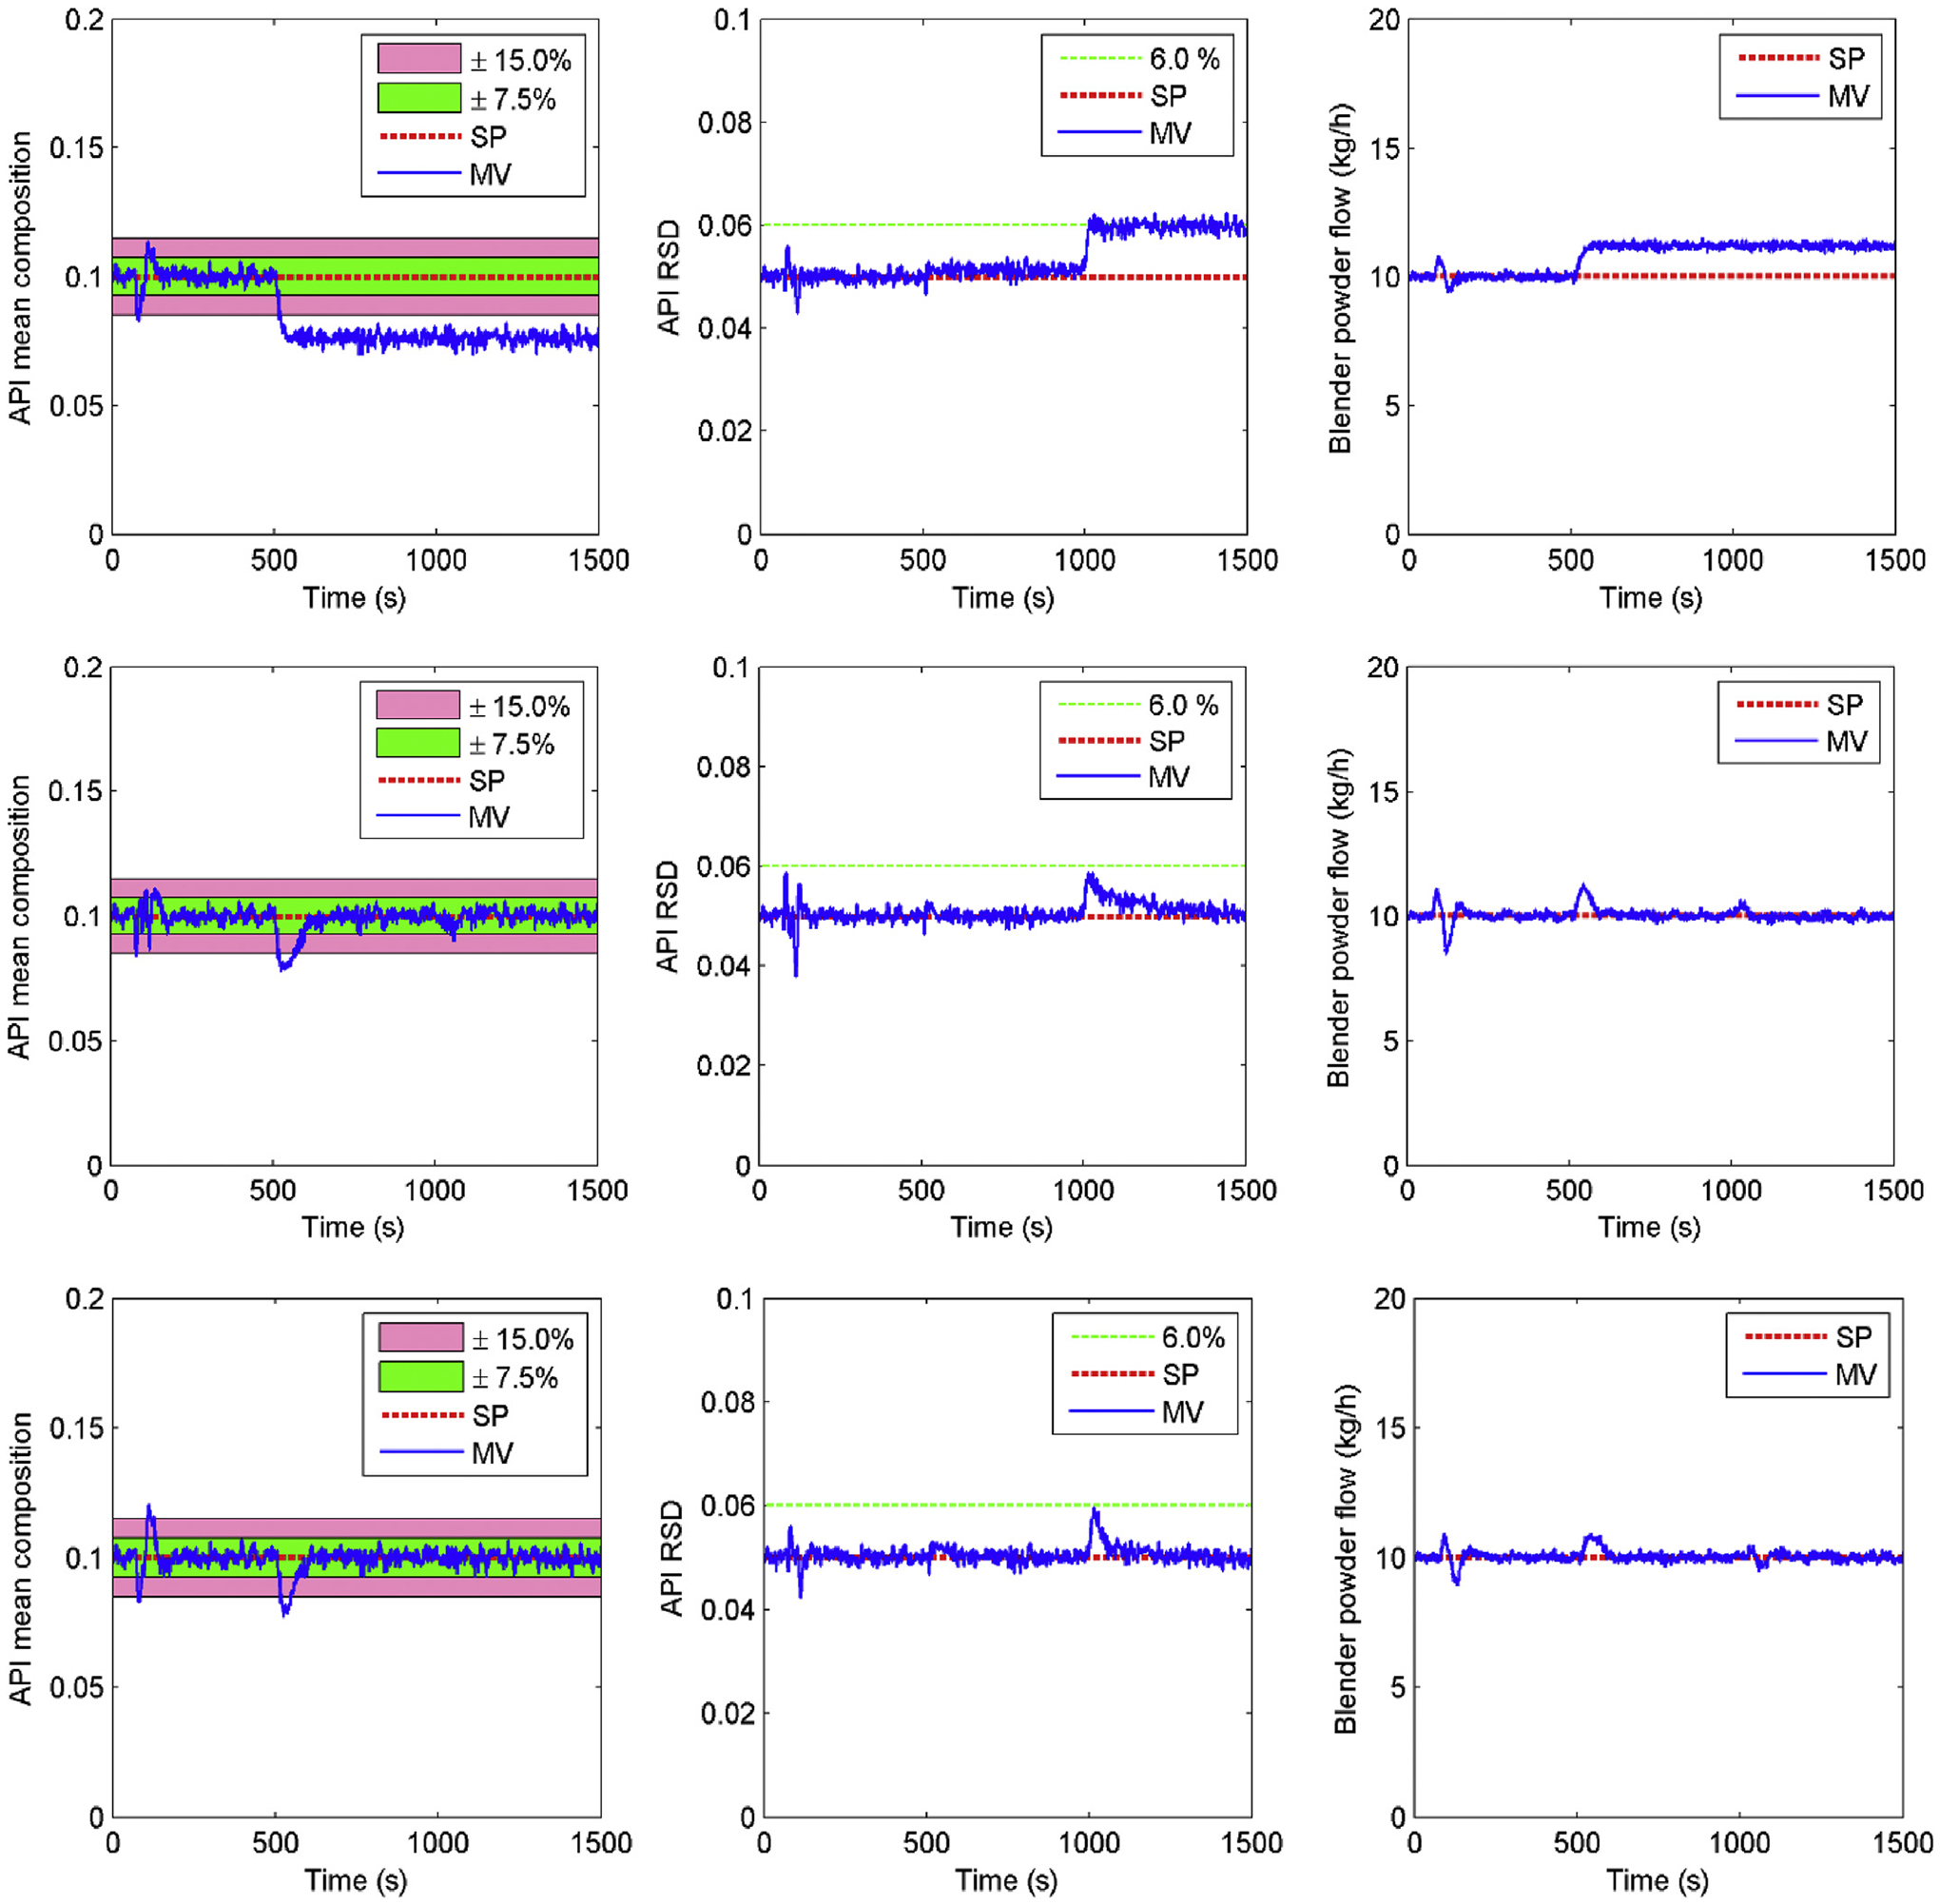
Control performances of different control Layers under risk scenarios (top three: Level 0 control; center three: Level 1 control; bottom three: Level 2 control).
It is observed that Level 0 control was capable of tackling the R0 detectable disturbance in the feeders. However, it failed to respond to risk scenarios R1 and R2. The API mean composition fell below the desired 10% set point from 500 s due to the R1 risk and the mixing uniformity variation increased to the upper limit of 6% after 1000 s when the R2 risk occurred. On the other hand, both the Level 1 and Level 2 controls were able to handle all the three risk scenarios. This was because any deviations in the CQAs from their desired set points could be detected by the PAT tools and corrected using feedback control. When it comes to the comparative performance of Level 1 and Level 2 controls, the MPC control technique used in Level 2 provided only slight improvement. The model-plant mismatch due to feeder calibration errors and variation in material properties under the R1 and R2 risk scenarios could lead to the less promising performance of the Level 2 MPC control.
Gross errors or signal drift due to probe fouling are detrimental to most of the PAT tools that are based on spectroscopy and associated calibration models (Huang and Pla, 2017), which are also categorized as an R2 risk. To illustrate this situation, the NIR probe for API composition measurement was considered to have drifted in the time interval from 40 to 100 s and to have suffered a gross error of 20% from 100 to 240 s before it was detected and corrected, as shown in Fig. 8 for Level 0 control. In this case the NIR probe was only used for API composition monitoring and not integrated within any feedback control loop. In Level 1 control, the faulty measurement was incorporated into the feedback control loop and was observed as a deviation in the API mean composition and blend uniformity from their set points before the failure in the NIR measurement was detected and corrected. The Level 2 control, which also employed a robust Kalman state estimator with a data reconciliation matrix, could reject the measurement gross error and continue the control actions with a predicted API composition when large model-plant mismatches were detected. The robust Kalman state estimator was designed using the identified state-space model to estimate the state variables (x) from the current process output measurement (y),
| (7) |
| (8) |
where x[k|k − 1] is the state variable for kth sampling time that is estimated at (k-1)th sampling time; y[k], e[k], and u[k] are the current process output, bias, and input measurement at kth sampling time, and M is the Kalman innovation gain. R is the data reconciliation matrix, using the Welsch robust estimator (Liu et al., 2018), to reject the gross error in measurements when model-plant mismatch ei deviates from its nominal standard deviation σi. Note that c is a tuning parameter.
Fig. 8.
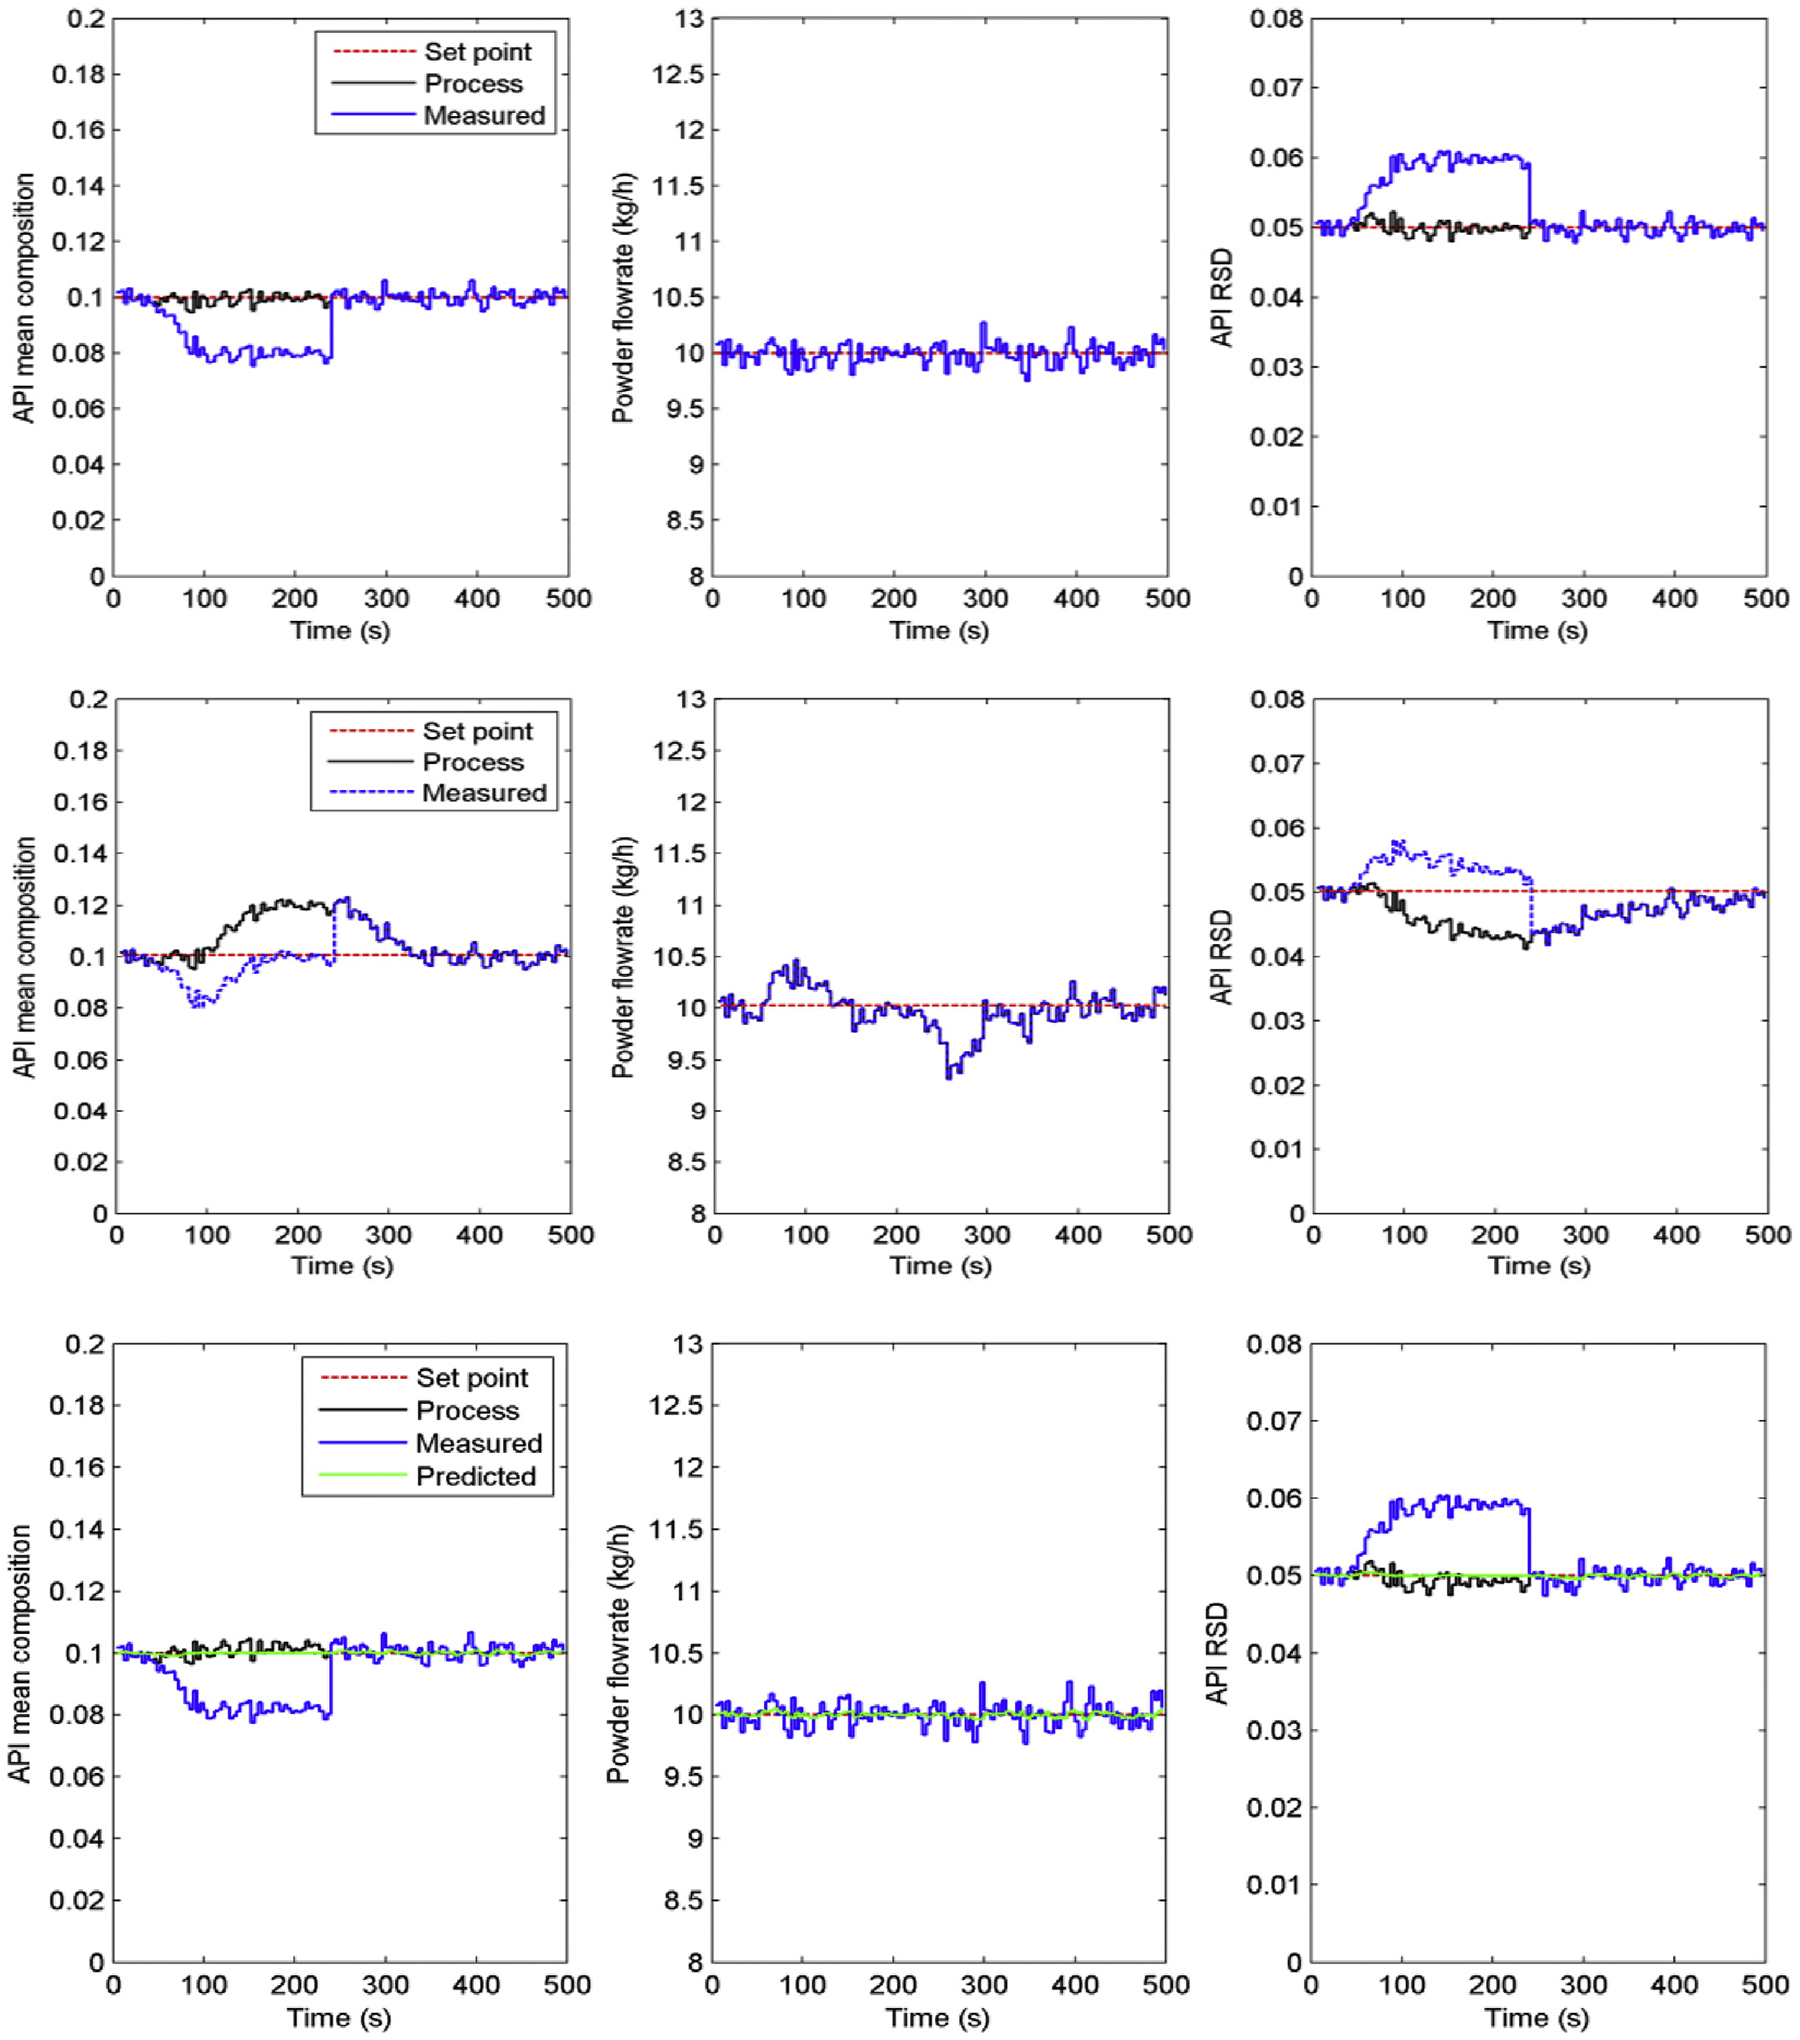
Control performance when R2 PAT gross error occurs to API composition measurement (top three: Level 0 control; center three: Level 1 control; bottom three: Level 2 control).
The overall risk assessment for the three-control designs can be found in Fig. 9, where the controllability of the three acceptable risk scenarios were assessed. It is pointed out here that the PAT tools for CQAs measurement play a vital role in the fault-tolerant control design for real-time release strategy in pharmaceutical continuous manufacturing (Yu et al., 2014).
Fig. 9.
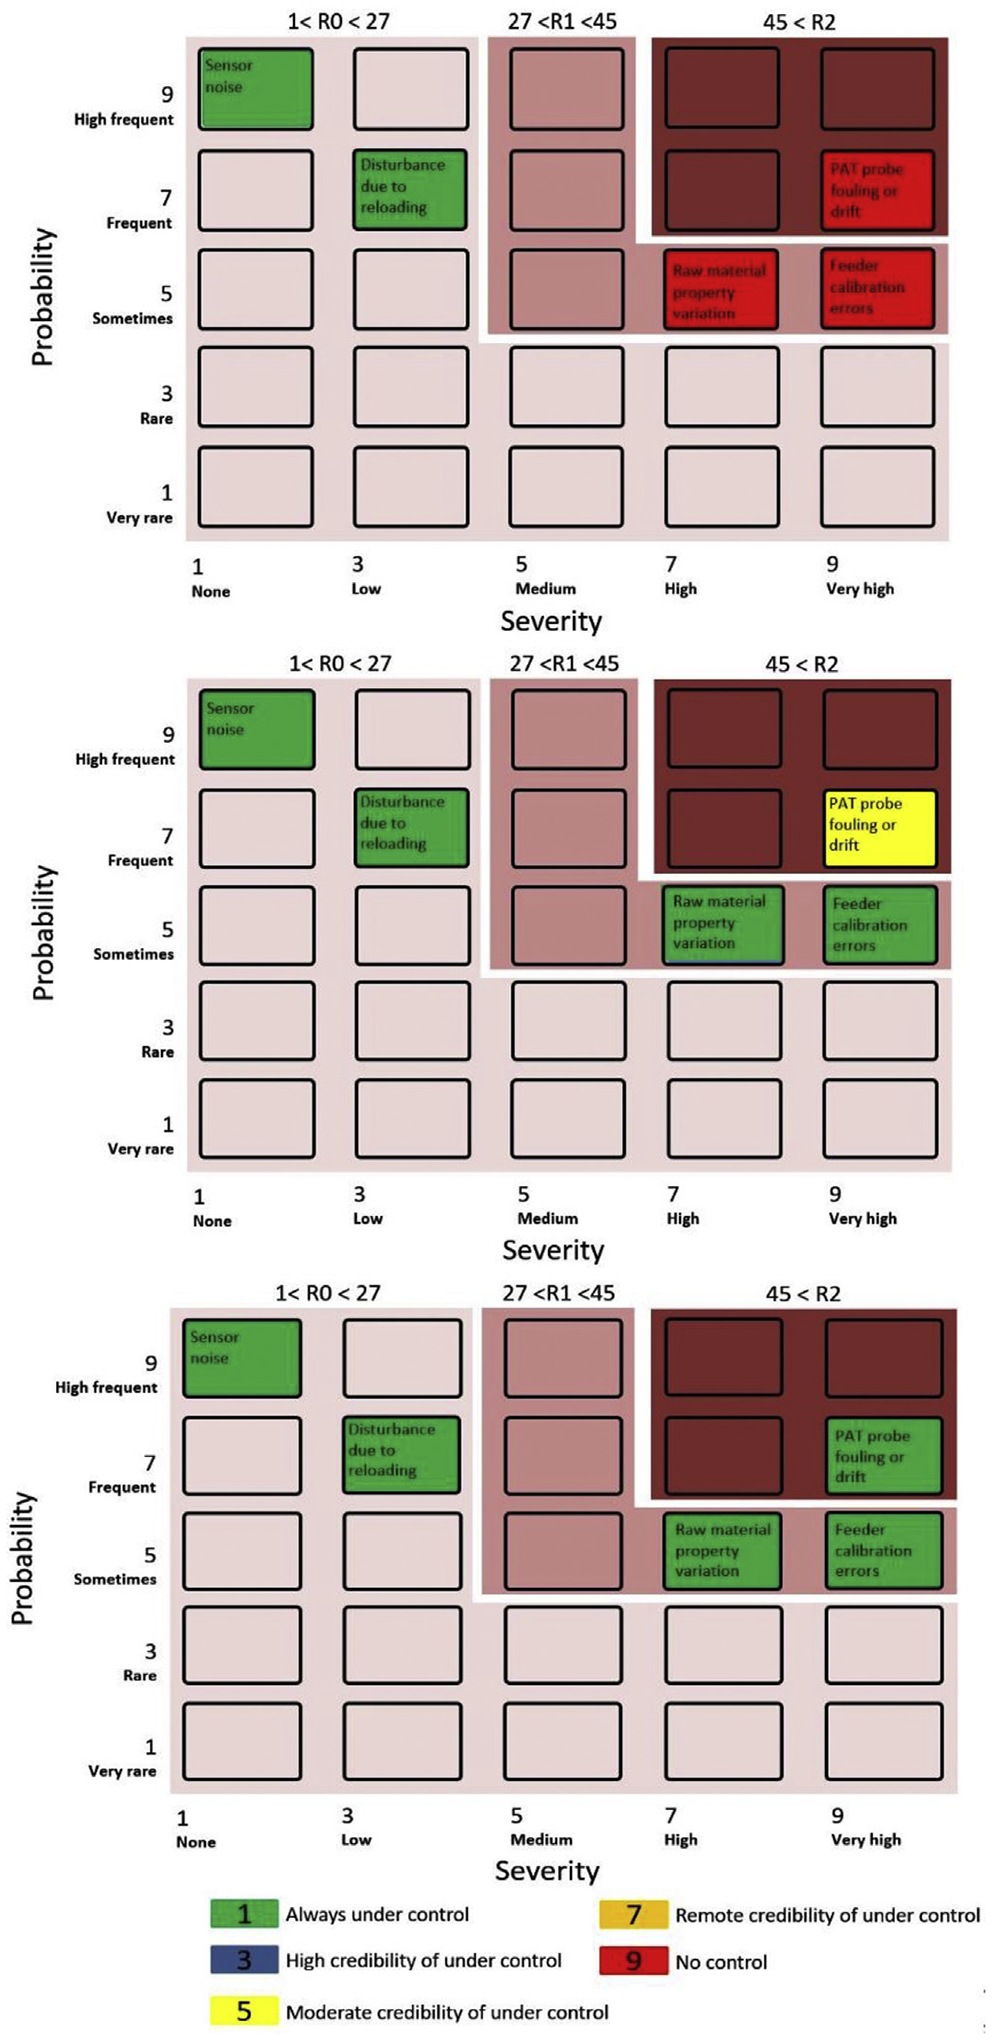
Risk assessment for three level control designs (top: Level 0 control; center: Level 1 control; bottom: Level 2 control).
4.3. Experimental verification of control performance
Based on the evaluation of the simulated risk scenarios, a Level 1 control design consisting of multiple SISO feedback and feedforward control loops, together with a Level 2 data reconciliation scheme for CPP and CQA variables, were suggested for the feeding-blending subsystem of the continuous direct compaction pilot plant. The Level 1 control scheme was practically implemented in DeltaV control platform in the pilot plant as shown in Fig. 10. A steady-state data reconciliation strategy to detect the gross error of NIR measurement of API composition or feeding flowrates of API and excipient in the feeding-blending system (Moreno et al., 2017) was also employed. A dynamic robust state-estimation for the feeding-blending system, which was proposed in our recent work (Liu et al., 2018) was not yet implemented in this study.
Fig. 10.
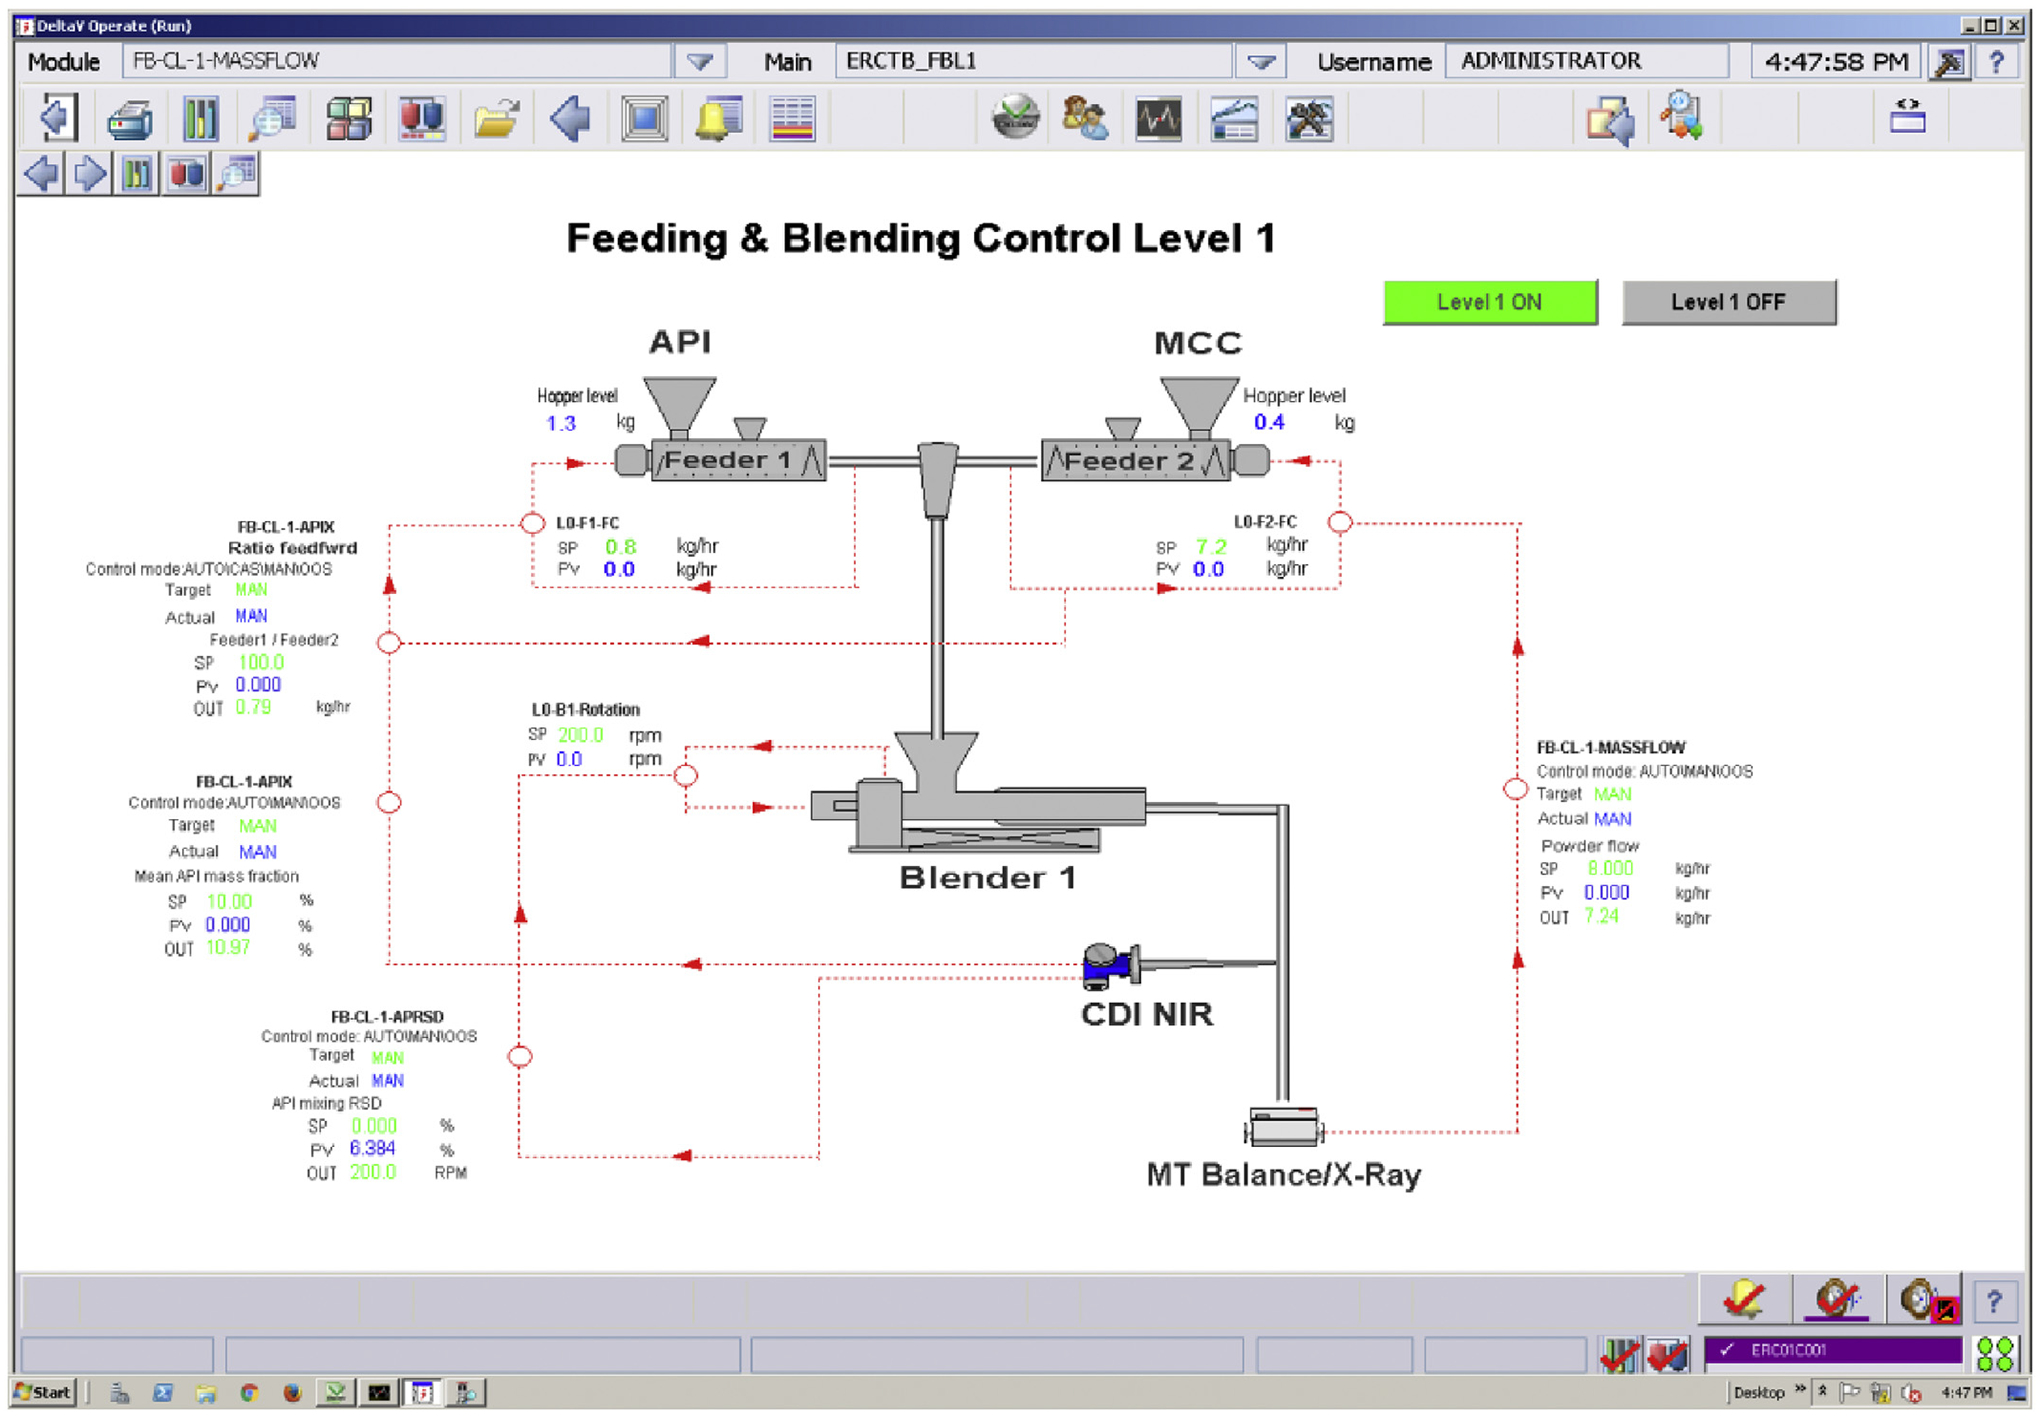
The Level 1 control of the feeding-blending system in the Purdue continuous tableting pilot plant.
The Level 1 control pairing and interaction analysis were also confirmed, as shown in Figs. 11 and 12. The blender powder flow can be well controlled with the major excipient MCC feeding flowrate with a single loop PID controller as auto tuned by DeltaV control studio, as was the API composition controlled by manipulating the API feeding flowrate. It should be noted that the general capacity of Gericke GCM-250 continuous blender allows to process a powder flow rate around 30 kg/h. Hence, due to the relatively low flow rate of 10 kg/h at the current nominal operating conditions, the blending uniformity of API was always satisfactory, as shown in Fig. 12. The relative standard deviation of the API composition was well below the target of 6.0% even under the set point changes of API composition, meaning the powder is always perfectly mixed. This may also be due to the fact that the RSD is calculated in a sampling time window instead of taking physical samples (Zhao et al., 2013). Nevertheless, more research efforts should be devoted to the NIR sensor in characterizing the mixing uniformity, e.g., multiple placements of NIR probes at the exit of the blender outlet.
Fig. 11.
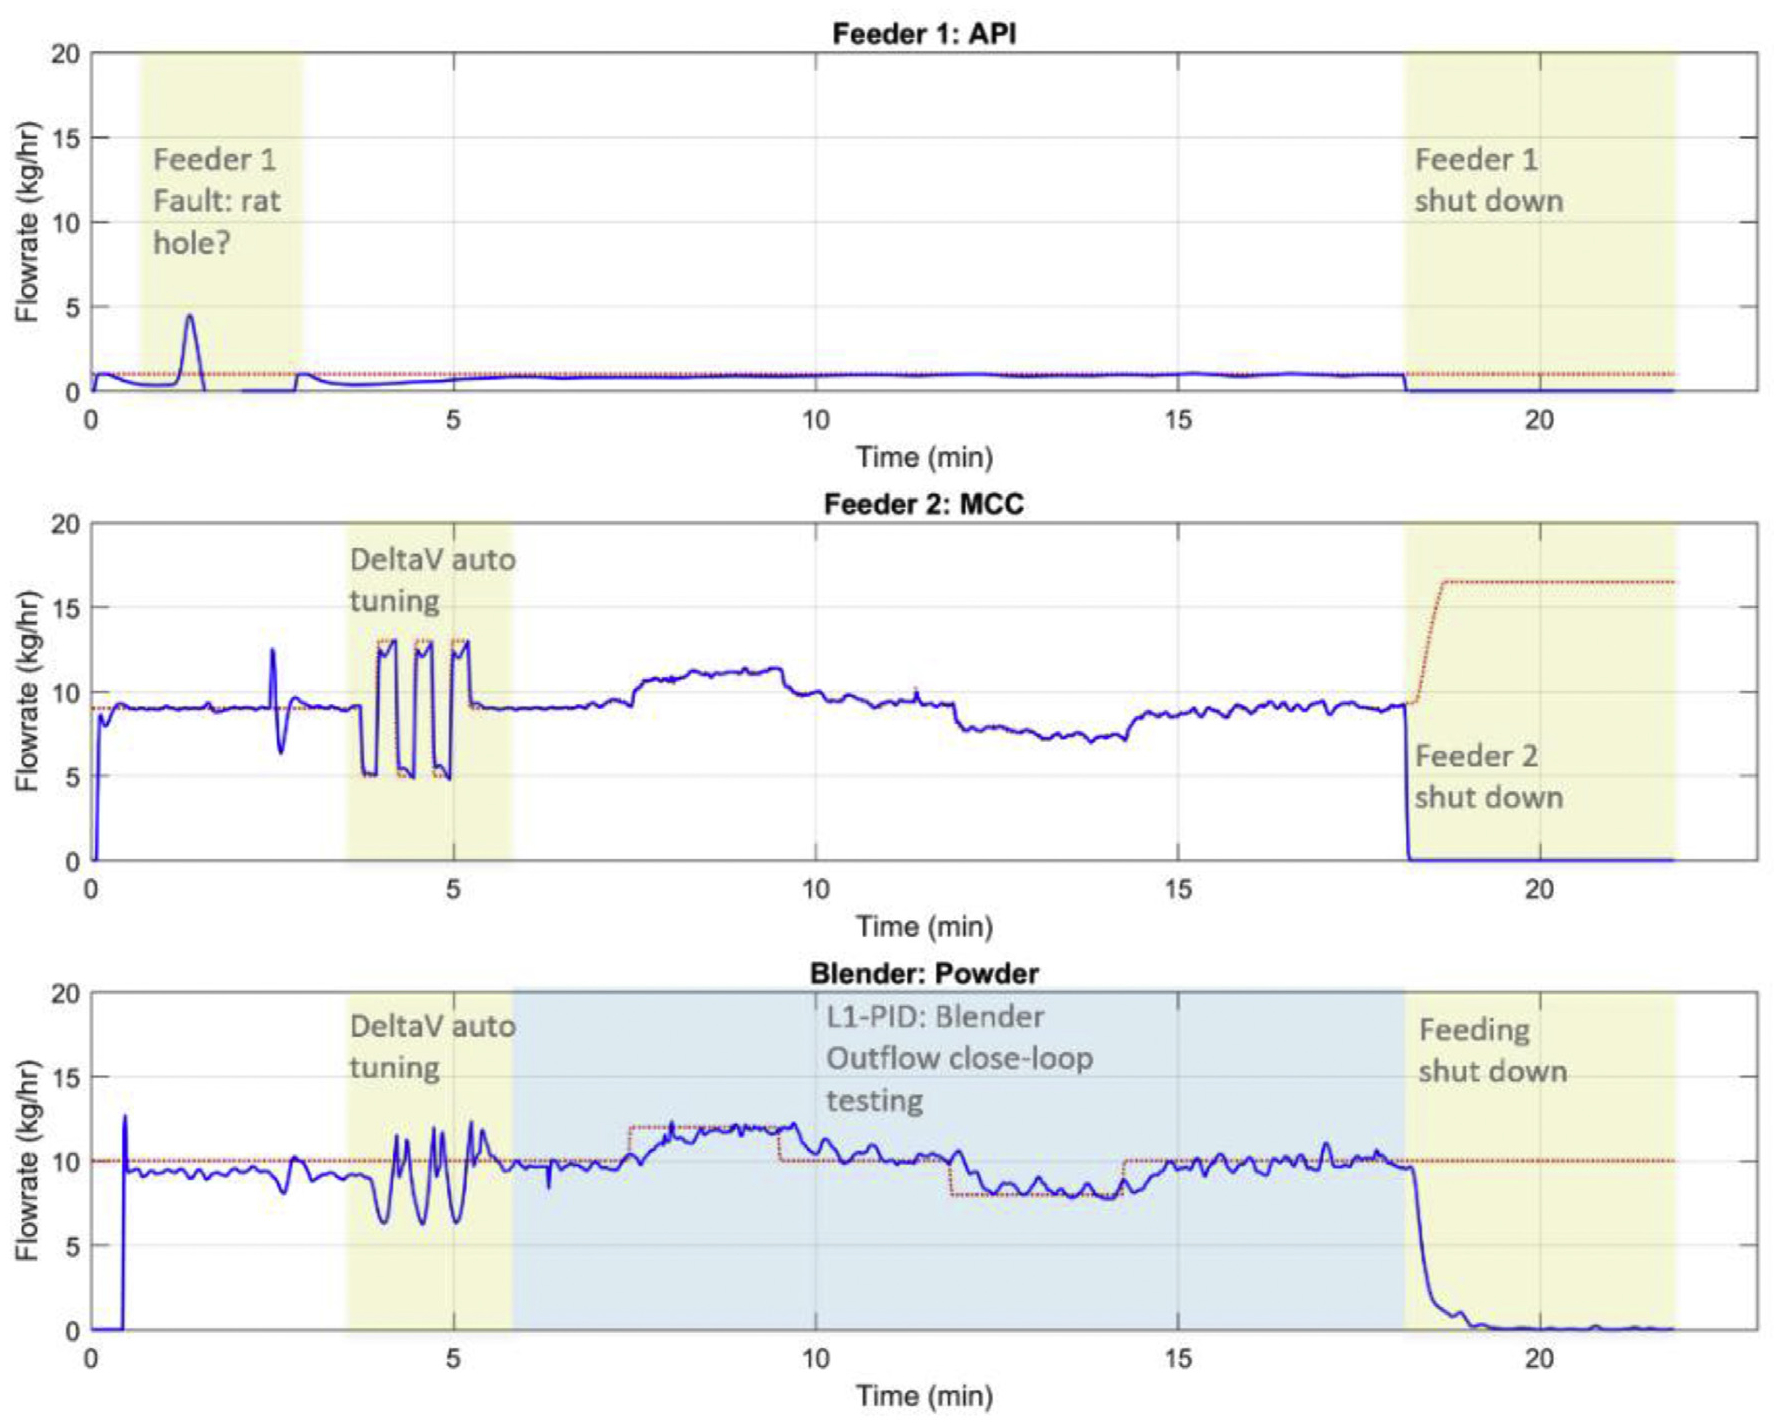
The Level 1 control for blender powder flow in a feeding-blending system in the Purdue pilot plant.
Fig. 12.
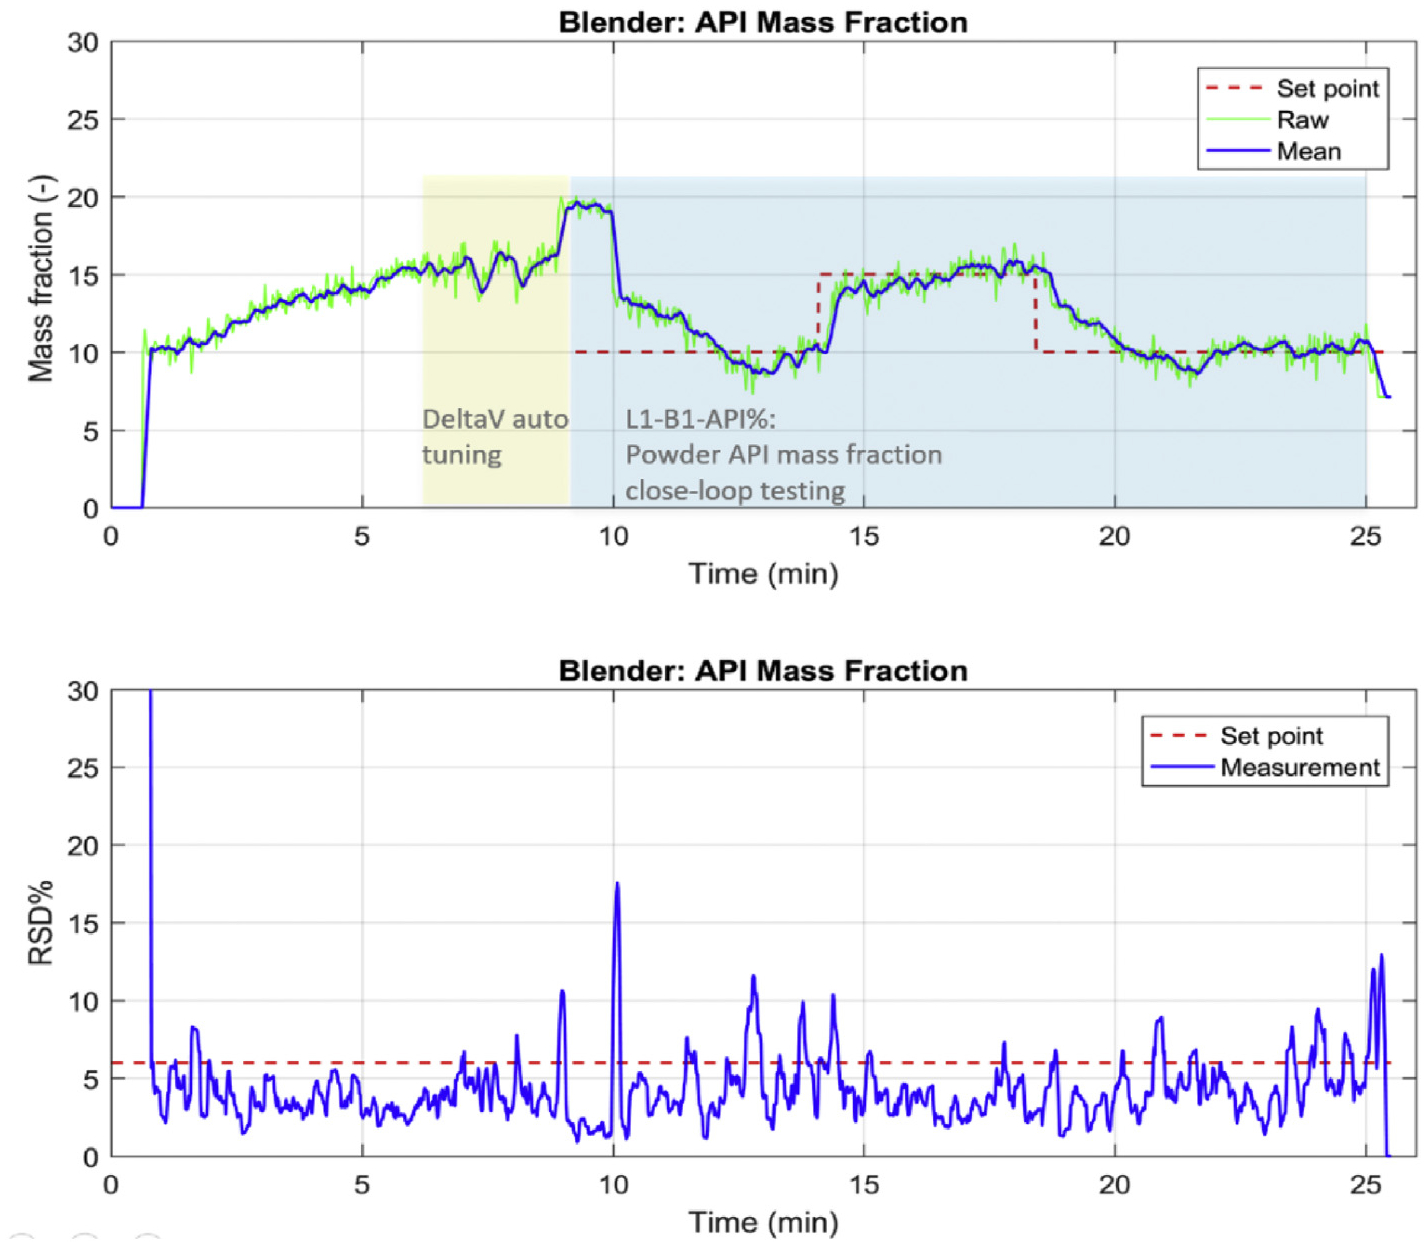
The Level 1 control for API composition and mixing uniformity in a feeding-blending system in the Purdue pilot plant.
The pharmaceutical continuous manufacturing processes will depend on the regulatory control systems to maintain production with consistent quality. However, changes made to the PAT sensor system and the natural degradation over time of the equipment may cause some controllers and process to suffer in performance (Hoo and Piovoso, 2003). Although the pioneering work on control performance monitoring was first reported almost three decades ago (Qin, 1998), and there are also many commercial services and products available (Bauer, 2016), e.g., the Emerson DeltaV Tune and the Honeywell Loop Scout®, the development of specific metrics and analysis methods with process knowledge and experience in certain unit operations still remain unresolved technical challenges (Jelali, 2013). In particular in the development of control performance monitoring and continuous improvement strategies in control systems for the emerging pharmaceutical continuous manufacturing, several research questions and regulatory concerns are to be explored as indicated in the proposed systematic framework.
5. Conclusions and future work
A systematic framework for a fault-tolerant control system design in continuous manufacturing processes has been proposed to evaluate each step of the control system development with resilience and risk analysis. The proposed hierarchical three-level control design approach has been applied to a feeding-blending system using a SIMULINK dynamic process model. Based on the risk MAP design, potential risks under which the control performance may deteriorate were also taken into account in evaluating the three-level control design. The selected Level 1 control with feedback and feedforward PID control loops for the feeding-blending system was demonstrated to have promising resilience against common cause errors using simulation studies at the design stage. Subsequently the selected Level 1 control system was implemented into the pharmaceutical continuous manufacturing pilot plant at Purdue University. The control performance evaluation and verification have demonstrated the importance of a systematic risk-based control evaluation to assure product quality in continuous manufacturing processes.
Continuous improvement is pursued in most manufacturing sectors as a consequence of the deeper understanding of the manufacturing system and its components, which naturally develop as manufacturing experience with a product and process are accumulated. Despite its potential, continuous improvement has not been pursued too aggressively in pharmaceutical manufacturing, given the real and perceived regulatory burden of approvals required for changes. Hence, the advent of continuous pharmaceutical manufacturing opens the door to continuous improvement at multiple levels, including predictive maintenance, control performance monitoring, control structure re-organizing, etc., since such improvements can be targeted to achieve tighter tracking of CQA and more robust plant wide control, which will maintain the process within its design operating space. The direct impact is to allow longer continuous runs without forced interruption, reduced frequency and duration of periods during which non-conforming materials are generated and reduced risk that a product lot released may actually include nonconforming material.
Acknowledgements
This work was supported by the Food and Drug Administration [DHHS-FDA U01FD005535-01] and the Purdue Process Safety and Assurance Centre (P2SAC).
References
- Austin J, et al. , 2014. A novel microwave sensor to determine particulate blend composition on-line. Anal. Chim. Acta 819, 82–93. [DOI] [PubMed] [Google Scholar]
- Bauer BHAXLJMTN, 2016. The current state of control loop performance monitoring-A survey of application in industry. J. Process Contr 38, 1–10. [Google Scholar]
- Blanke M, Izadi-Zamanabadi R, Bogh R, Lunau ZP, 1997. Fault-tolerant control systems-A holistic view. Contr. Eng. Pract 5 (5), 693–702. [Google Scholar]
- Ganesh S, et al. , 2017. Application of x-ray sensors for in-line and non-invasive monitoring of mass flow rate in continuous tablet manufacturing. J. Pharmaceut. Sci 106 (12), 3591–3603. [DOI] [PubMed] [Google Scholar]
- Gupta A, Giridhar A, Venkatasubramanian V, Reklaitis GV, 2013. Intelligent alram management applied to continuous pharmaceutical tablet manufacturing: an integrated approach. Ind. Eng. Chem. Res 52, 12357–12368. [Google Scholar]
- Hoo K, Piovoso MJSPRD, 2003. Process and controller performance monitoring: overview with industrial applications. Int. J. Adapt. Contr. Signal Process 17, 635–662. [Google Scholar]
- Huang J, Pla DL, 2017. GMP implementation of advanced process control in tablet manufacturing. Am. Pharmaceut. Rev 20 (2). [Google Scholar]
- ICH-Q10, 2007. Q10: pharmaceutical quality system. ICH tripartite guidelines. In: s.l.: International Conference on Harmonization of Technical Requirements for Registration of Pharmaceuticals for Human Use [Google Scholar]
- ICH-Q9, 2006. Q9: quality risk management. ICH harmonized tripartite guidelines. In: s.l.: International Conference on Harmonization of Technical Requirements for Registration of Pharmaceuticals for Human Use [Google Scholar]
- Ierapetritou M, Muzzio F, Reklaitis G, 2016. Perspectives on the continuous manufacturing of powder-based pharmaceutical processes. AIChE J 62 (6), 1846–1862. [Google Scholar]
- Jelali M, 2013. Control Performance Management in Industrial Automation: Assessment, Diagnosis and Improvement of Control Loop Performance Springer-Verlag, London. [Google Scholar]
- Jiang J, Yu X, 2012. Fault-tolerant control systems: a comparative study between active and passive approaches. Annu. Rev. Contr 36 (1), 60–72. [Google Scholar]
- Lakerveld R, Benyahia B, Braatz RD, Barton PI, 2013. Model-based design of a plant-wide control strategy for a continuous pharmaceutical plant. AIChE J 59 (10), 3671–3685. [Google Scholar]
- Lee SL, et al. , 2015. Modernizing pharmaceutical manufacturing: from batch to continuous production. J. Pharmaceut. Innovat 10 (3), 191–199. [Google Scholar]
- Liu J, et al. , 2018. Robust state estimation of feeding-blending systems in continuous pharmaceutical manufacturing. Chem. Eng. Res. Des 134, 140–153. [DOI] [PMC free article] [PubMed] [Google Scholar]
- Moreno M, et al. , 2017. Steady-state data reconciliation of a direct compression tableting line. Minneapolis, US. In: AIChE Annual Meeting [Google Scholar]
- Portillo P, Muzzio F, Ierapetritou M, 2008. Using compartment modeling to investigate mixing behavior of a continuous mixer. J. Pharmaceut. Innovat 3 (3), 161–174. [Google Scholar]
- Potter C, 2009. PQLI application of science- and risk-based approaches (ICH Q8, Q9, and Q10) to exisiting products. J. Pharmaceut. Innovat 4 (1), 4–23. [Google Scholar]
- Qin SJ, 1998. Control performance monitoring-a review and assessment. Comput. Chem. Eng 23, 173–186. [Google Scholar]
- Ramachandran R, Arjunan J, Chaudhury A, Ierapetritou MG, 2011. Model-based control-loop performance of a continuous direct compaction process. J. Pharmaceut. Innovat 6, 249–263. [Google Scholar]
- Singh R, Ierapetritou M, Ramachandran R, 2012. An engineering study on the enhanced control and operation of continuous manufacturing of pharmaceutical tablets via roller compaction. Int. J. Pharm 438, 307–326. [DOI] [PubMed] [Google Scholar]
- Singh R, Muzzio FJ, Ierapetritou M, Rohit R, 2015a. A combined feed-forward/feedback control system for a QbD-based continuous tablet manufacturing process. Processes 3, 339–356. [Google Scholar]
- Singh R, et al. , 2014. A systematic framework for onsite design and implementation of a control system in a continuous tablet manufacturing process. Comput. Chem. Eng 66, 186–200. [Google Scholar]
- Singh R, Sen M, Ierapetritou M, Ramachandra R, 2015b. Integrated moving horizon-based dynamic real-time optimization and hybrid MPC-PID control of a direct compaction continuous tablet manufacturing process. J. Pharmaceut. Innovat 10, 233–253. [Google Scholar]
- Su Q-L, Hermanto MW, Braatz RD, Chiu M-S, 2016. Just-in-Time-Learning based extended prediction self-adaptive control for batch processes. J. Process Contr 43, 1–9. [Google Scholar]
- Su Q, et al. , 2017. A systematic framework for process control design and risk analysis in continuous pharmaceutical solid-dosage manufacturing. J. Pharmaceut. Innovat 12, 327–346. [Google Scholar]
- Vanarase AU, et al. , 2010. Real-time monitoring of drug concentration in a continuous powder mixing process using NIR spectroscopy. Chem. Eng. Sci 65, 5728–5733. [Google Scholar]
- Yu L, 2016. Continuous manufacturing has a strong impact on drug quality [Online] Available at: http://blogs.fda.gov/fdavoice/index.php/2016/04/continuous-manufacturing-has-a-strong-impact-on-drug-quality, Accessed date: 29 March 2018.
- Yu LX, et al. , 2014. Understanding pharmaceutical quality by design. AAPS J 16 (4), 771–783. [DOI] [PMC free article] [PubMed] [Google Scholar]
- Zhao XJ, et al. , 2013. Implementation of a Control Loop for a Continuous Powder Mixing Process San Francisco, United States. (s.n). [Google Scholar]


